
A Two-stage Learning Approach for Traffic Sign Detection and
Recognition
Ying-Chi Chiu
1
, Huei-Yung Lin
1 a
and Wen-Lung Tai
2
1
Department of Electrical Engineering, National Chung Cheng University, Chiayi 621, Taiwan
2
Create Electronic Optical Co., LTD., New Taipei 235, Taiwan
Keywords:
Traffic Sign Detection, Traffic Sign Classification, Advanced Driver Assistance Systems (ADAS).
Abstract:
With the progress of advanced driver assistance systems (ADAS), the development of assisted driving tech-
nologies is becoming more and more important for vehicle subsystems. The traffic signs are designed to
remind the drivers of possible situations and road conditions to avoid traffic accidents. This paper presents a
two-stage network to detect and recognize the traffic sign images captured by the vehicle on-board camera. In
the detection network, we adopt Faster R-CNN to detect the location of the traffic signs. For the classification
network, we use SVM, VGG, and ResNet for validation and testing. We compare the results and integrate the
detection and classification systems. The datasets used in this work include TT100K and our own collected
Taiwan road scene images. Our technique is tested using the videos acquired from the highway, suburb and
urban scenarios. The results using Faster R-CNN for detection combined with VGG17 for classification have
demonstrated superior performance compared to YOLOv3 and Mask R-CNN.
1 INTRODUCTION
In advanced driver assistance systems (ADAS), one
specific important module is for the detection and
recognition of traffic signs. It provides the indispens-
able information for the drivers or autonomous vehi-
cles to comply with the traffic laws and regulations
(Lin et al., 2020). Major traffic accidents might be oc-
curred if drivers do not pay attention to the road signs.
Since most of the signs are in the outdoor scenes,
the detection and recognition have many difficulties
such as occlusion, distortion, lighting and color fad-
ing, etc. In the past few decades, there are many tra-
ditional methods utilizing image features, including
color, shape and gradient, to detect and recognize traf-
fic signs (Huang et al., 2017).
Recently, machine learning based methods have
made significant progress on object recognition. They
are also successfully adopted to many vehicle related
applications. The detection and classification of traf-
fic signs have been greatly improved with the con-
tinuous development of deep learning techniques. In
(Tabernik and Sko
ˇ
caj, 2020), Tabernik and D. Sk
ˇ
ocaj
present an approach for large scale traffic sign detec-
tion and classification. It is based on Mask R-CNN
and Detectron (He et al., 2017; Girshick et al., 2018),
a
https://orcid.org/0000-0002-6476-6625
with the online hard-example mining (OHEM) mod-
ule (Shrivastava et al., 2016). Their datasets are col-
lected by dashcam recorders for more than 200 types.
One major drawback of the proposed method is the
detection time of 0.5 seconds per image. Zhang et
al. modify YOLOv2 with several changes to the net-
work architecture and compare the accuracy and re-
call (Zhang et al., 2017; Redmon and Farhadi, 2017).
The traffic signs are only divided into three categories,
namely ‘mandatory’, ‘danger’ and ‘prohibitory’, for
detection and classification. Rajendran et al. im-
prove the accuracy of YOLOv3 by changing the size
of anchor boxes (Rajendran et al., 2019; Redmon and
Farhadi, 2018). In addition to the above literatures,
there are also many works using public datasets for
traffic sign detection (Yuan et al., 2019; Philipsen
et al., 2015; Liu et al., 2019). Since most of the pub-
lic datasets are created with the road scenes in Europe
and the US, there exist some variations for the traffic
sign detection in different countries. Table 1 shows
the comparison of various public datasets currently
available.
In this paper, we propose a two-stage network for
traffic sign detection and recognition. We adopt Faster
R-CNN implemented in Detectron as the backbone of
our detection framework (Ren et al., 2015). A fairly
loose criterion is first used to detect any possible traf-
276
Chiu, Y., Lin, H. and Tai, W.
A Two-stage Learning Approach for Traffic Sign Detection and Recognition.
DOI: 10.5220/0010384002760283
In Proceedings of the 7th International Conference on Vehicle Technology and Intelligent Transport Systems (VEHITS 2021), pages 276-283
ISBN: 978-989-758-513-5
Copyright
c
2021 by SCITEPRESS – Science and Technology Publications, Lda. All rights reserved

Table 1: The comparison of various public datasets for traffic sign detection and recognition. GTSDB (Houben et al., 2013),
GTSRB (Stallkamp et al., 2012), DFG (Tabernik and Sko
ˇ
caj, 2020), LISA (Mogelmose et al., 2012), TT100K (Zhu et al.,
2016).
GTSDB GTSRB DFG LISA TT100K
Resolution 1360 × 800
15 × 15
|
250 × 250
1920 × 1080
640 × 640
|
1024 × 522
2048 × 2048
Number of Images 900 over 50,000 7,000 6,610 100,000
Number of Classes 3 43 200 47 221
Usage Detection Classification Detection Detection Detection
Area Germany Germany Slovenian USA China
fic signs with the miss rate as low as possible in the
first stage. This might contain many false positives
corresponding to the background regions similar to
the traffic signs. The detection results are then sent
to the second stage for road sign recognition. Many
approaches, including SVM (support vector machine)
and CNN (convolutional neural network), are adopted
for image classification. The public dataset TT100K
is mainly used for training and testing (Zhu et al.,
2016). However, we also collect our own traffic scene
dataset since the road signs are not identical for dif-
ferent countries (Chiu et al., 2019). Moreover, it is
required to increase the number of samples for net-
work training.
For the traffic sign detection, the images with the
resolution of 512 × 512 in the datasets are used in the
first stage. The cropped road sign regions derived
from the first stage are used in the second stage as
the training and testing data. Due to the blur or oc-
clusion, it is difficult to classify small size road sign
images into specific categories. Thus, we set the min-
imum size of 25 × 25 pixels for recognition, which
corresponds to about 50 – 60 meters from the cam-
era. According to the frequency appeared in the road
scenes, there are 22 types of traffic signs considered
for detection and recognition currently. In the future,
as the growth of image data and annotation, the num-
ber of categories will be gradually increased.
2 METHOD
To improve the accuracy of traffic sign detection and
recognition, this work proposes a new two-stage ap-
proach. Figure 1 shows the flowchart of the proposed
technique. The first stage mainly detects the locations
of the traffic signs, followed by the second stage of us-
ing the cropped regions for image classification. The
proposed traffic sign detection framework is different
from the commonly adopted two-stage detectors such
as R-CNN, Faster R-CNN, etc. (Girshick et al., 2014;
Ren et al., 2015). Our first stage is designed to have a
very low miss rate and disregard the number of false
positives. The second stage is then carried out for the
validation and classification of traffic signs.
2.1 Detection Network
Our detection network is based on Detectron (Gir-
shick et al., 2018), with Faster R-CNN+ResNet50. It
is mainly used to detect the possible traffic signs and
derive the miss rate (or false negative rate, FNR) given
by
FNR =
FN
FN + T P
(1)
where FN and TP are the numbers of false negatives
and true positives, respectively. Compared with the
previous works, the most common problem encoun-
tered in traffic sign detection is the misunderstanding
of signboard and similar shapes.
Faster R-CNN is adopted in this work due to its
low miss rate and high accuracy. One of the most im-
portant architectures is the Region Proposal Network
(RPN). It uses softmax to determine the foreground
and background, and bounding box regression to cor-
rect the anchor position. The RPN contains two paths
and a proposal layer to eliminate smaller and out-of-
bounds proposals. We also added the Feature Pyra-
mid Network (FPN), by fusing the higher level fea-
tures with low-level features (Yang et al., 2016). The
semantic features of the high convolutional layer are
combined with the features from low convolutional
layers to improve the accuracy of target detection.
2.2 Classification Network
The traffic signs detected in the first stage are cropped
from the images, and only the classes of interest are
used for training in the second stage. We select a total
of 22 most common road sign types plus an additional
non-sign category for classification. They are further
divided into 1 category for danger sign, 2 categories
for mandatory signs and 19 categories for prohibition
signs.
A Two-stage Learning Approach for Traffic Sign Detection and Recognition
277
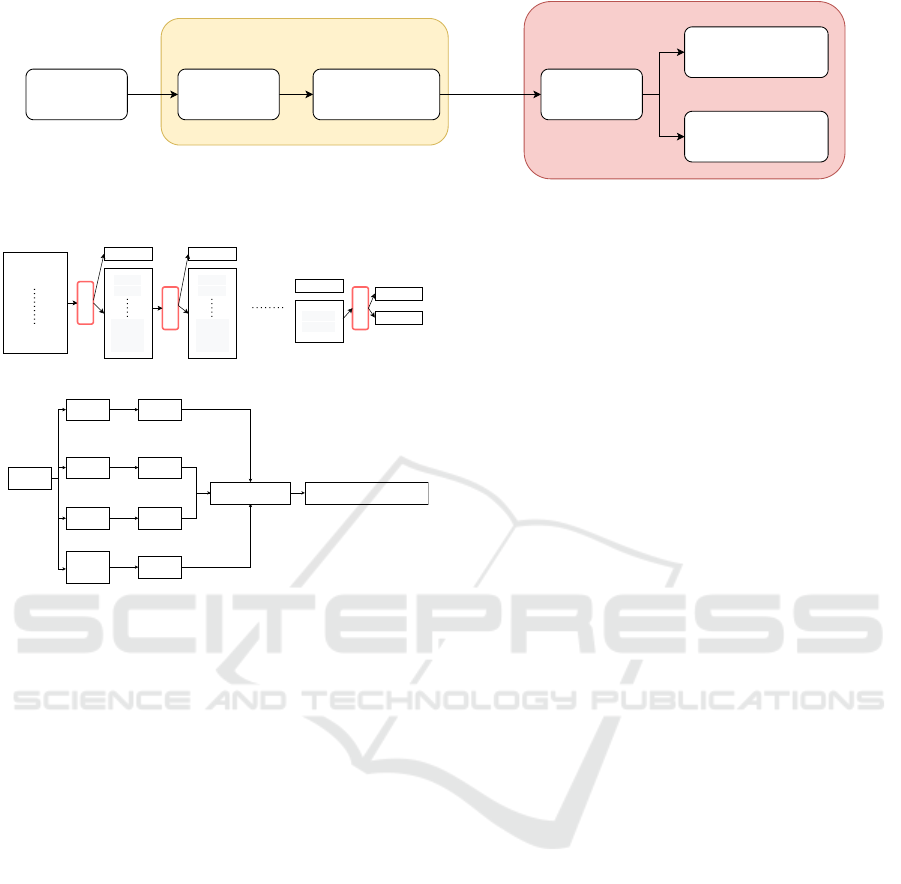
Faster-RCNNImage Signdetection
Detection
Classification
network
Crop
detectionsign
Classifysign
categoryanddisplay
removebackground
Classification
Figure 1: The flowchart of the proposed two-stage traffic sign detection and recognition.
Class1
Class2
Class3
Class18
Class19
Class20
S
V
M
Class1
Class2
Class3
Class18
Class19
Class20
Class2
Class3
Class4
Class18
Class19
Class20
S
V
M
Class18
Class19
Class20
S
V
M
Class19
Class20
(a) The cascading SVM classifier.
image
SVM
(4classes
+no)
SVM
(5classes)
SVM
(5classes)
SVM
(5classes)
prediction
prediction
prediction
prediction
SinglecategorySVM Highestconfidencevaluecategory
(b) The parallel SVM classifier.
Figure 2: Two different SVM variations (cascading and par-
allel) used for the second stage.
In the second stage, SVM, VGG16, ResNet and
SE-ResNet are adopted for traffic sign classification.
For SVM classifiers, the HOG (Histogram of Ori-
ented Gradient) features are used for training (Wahy-
ono et al., 2014; Zaklouta and Stanciulescu, 2012).
One approach is to set one category versus the rest,
and all SVMs are connected in series as shown in Fig-
ure 2(a). The other is to use parallel SVMs for the
initial predictions, followed by another SVM to select
the one with the highest confidence value, as illus-
trated in Figure 2(b). Due to the execution speed of
these two methods, other machine learning techniques
are further investigated.
Both VGG16 and ResNet have good performance
in the ImageNet classification competition. The net-
work structure of VGG16 is relatively simple, includ-
ing 13 convolutional layers, 3 fully connected layers
and 5 pooling layers. In our implementation, the in-
put image size, batch size and learning rate are set
as 224 × 224, 32 and 0.002, respectively. We trained
the network with roughly 900 epochs and the weights
are stored for every 300 epochs. Finally, the one with
the highest accuracy is used for testing. ResNet is a
residual network which solves the problem of infor-
mation loss caused by too many convolutional layers.
SE-ResNet inserts the SE (Squeeze-and-Excitation)
module into the residual structure of ResNet. By con-
trolling the scale size, important and unimportant fea-
tures are enhanced and weakened. In ResNet and SE-
ResNet, the network parameters are as follows: the
input image size for training: 40 × 40, the batch size:
64, the learning rate: 0.002, the training epoch: 3000.
The weights are also stored for every 300 epochs.
3 TRAFFIC SIGN DATASET
Most of the public datasets for traffic sign detection
are collected in Europe and the United States. How-
ever, Taiwan has the road scene complexity different
from Europe and the US. There are many motorcy-
cles on the streets in the urban areas, but less in other
countries. TT100K is by far the most suitable dataset
to train the networks for Taiwan’s traffic sign detec-
tion. Figure 3 shows all types traffic signs in TT100K.
Since there still exist discrepancies between our ap-
plication scenario and the dataset (such as no danger
signs in the dataset), we further include self-labeled
Taiwan road scene images for training and testing.
For the testing videos, the image sequences are cap-
tured by an on-board digital video recorder (DVR).
The original image size is 1280 × 800.
The dataset contains 23 categories (including 1
non-sign category) for the first stage detection, with
29,659 images for training and 15,766 images for test-
ing. To better detect the traffic sign locations and in-
crease the accuracy, the images are cropped into mul-
tiple 512 × 512 regions. The cropping process is car-
ried out in a sliding window fashion, starting from the
upper left corner to detect the traffic signs in the re-
gion. To ensure that no signs will be missed, the stride
is set as 400 and each movement follows an overlap
of 112 pixels. If there is a sign in the ROI, it will be
cropped into a 512 × 512 image.
In the second stage classification, the traffic sign
images are cropped from TT100K and our dataset.
There are 10,474 images for training (including 711
background images) and 4,496 images for testing (in-
cluding 55 background images). The background im-
VEHITS 2021 - 7th International Conference on Vehicle Technology and Intelligent Transport Systems
278
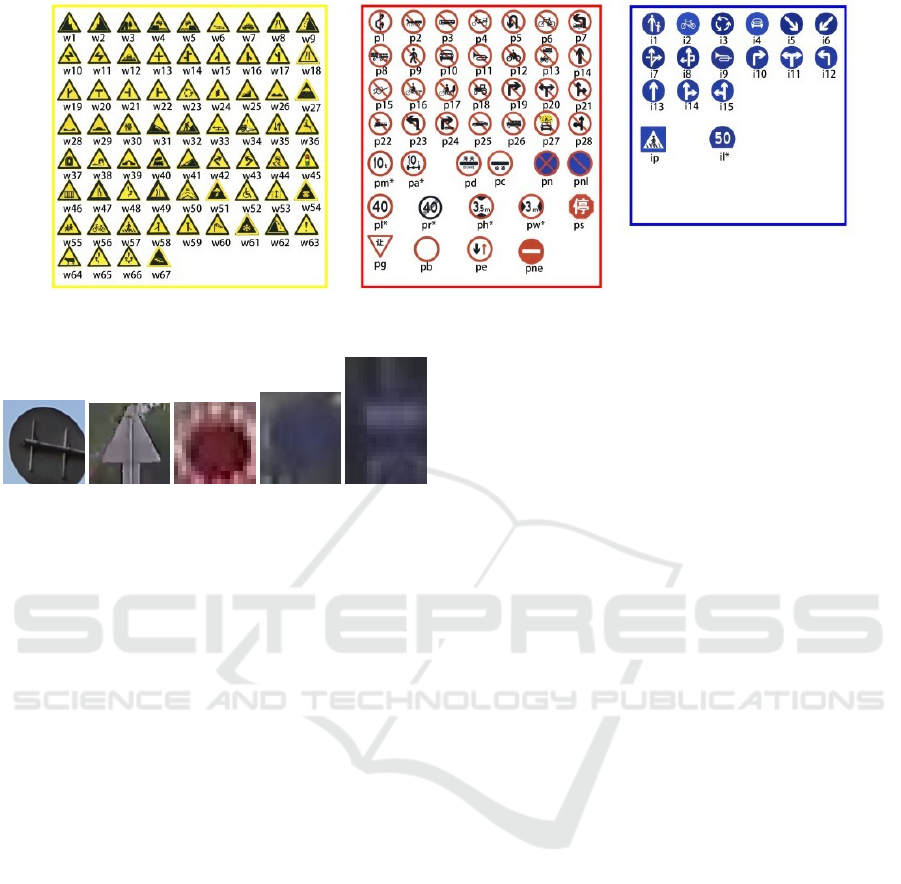
Figure 3: All types of traffic signs in the public dataset TT100K. It is mainly used in this work.
(a) (b) (c) (d) (e)
Figure 4: Some false positives in the first stage detection
used as the training samples in the second stage classifica-
tion.
ages are used to eliminate the false positives (FP) ap-
peared during the detection stage. They are cropped
from the false detection results, and used to train the
classification network. Figure 4 shows some false
positives of the traffic signs detected in the first stage
and used as the training samples in the second stage
classification.
We are mainly interested in the traffic sign de-
tection from car digital video recorders. However,
TT100K covers about 80% of images for network
training. The dataset contains still images which are
different from the image sequences acquired when the
vehicle is moving (with more severe blur and noise).
The images captured by the car digital video recorder
are blurry and noisy compared to the TT100K images.
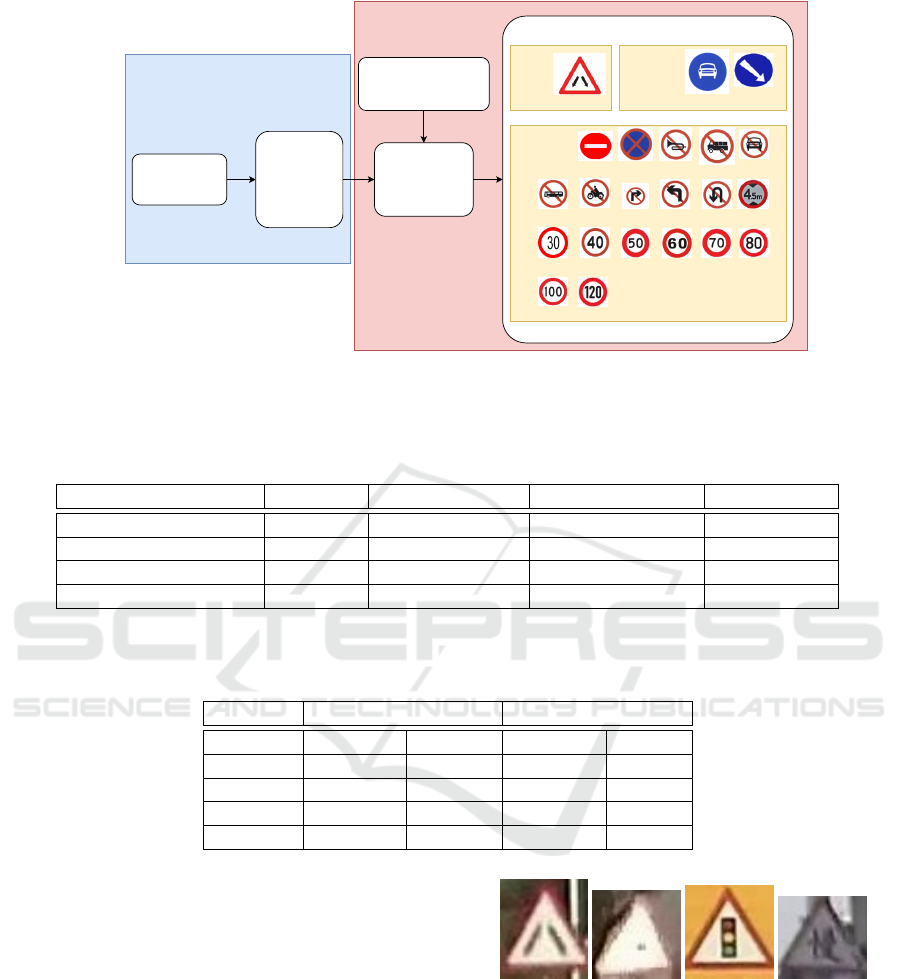
Thus, image processing is carried out to make the
dataset images close to the recorded video data. The
two-stage processing flowchart with three-category
detection is shown in 5. To provide a more re-
alistic testing environment for traffic sign detection
algorithms, we create three types of testing videos
including highways, suburbs and urban areas. There
are two image sequences generated for each scenario
with a total of six testing videos. The video play-
back is speeded up for the areas without traffic signs.
Each video is 3-minute long, and contains 5,400 im-
age frames. The image resolution of 1280 × 800 is
cropped into a 612 × 612 ROI. Since the sidewalks
and opposite lanes are removed, the detection speed
and accuracy can be greatly improved (Chiu et al.,
2019).
4 EXPERIMENTS
For the detection networks, we compare three meth-
ods: YOLOv3, Faster R-CNN in Detectron, and the
approach described in (Zhu et al., 2016). The traffic
signs are also divided into three categories, ‘manda-
tory’, ‘prohibitory’ and ‘danger’, for evaluation. In
the first stage, the main objective is to have a very low
miss rate. Table 2 shows the comparison of the miss
rate for three networks using the urban testing videos.
Among them, Faster R-CNN is evaluated with addi-
tional 3 categories. It is indicated in the table that
the low miss rate usually comes with more false pos-
itives. The results also show that Faster R-CNN often
recognizes the signboards or circular shapes as traffic
signs, but is capable of detecting obscured signs. It
is suitable for our first stage detection since the major
concern is low FNR instead of low FDR (false discov-
ery rate).
For the classification networks, we compare two
different approaches. One is to test with a still image
set containing 80% and 20% of images from TT100K
and our dataset, respectively. The other is to test with
the 6 video sequences created for highway, suburb
and urban road scenes as described in the previous
section. Since the test sets are the output of the first
stage detection and marking, the accuracy evaluation
of this stage is purely for the classification results.
In the implementation, there are two approaches
for the first stage. One is to detect the traffic signs
without classification, and the other is to detect and
classify the traffic signs into three categories, ‘manda-
tory’, ‘danger’ and ‘prohibition’. Thus, there are four
different classification networks trained separately. It
A Two-stage Learning Approach for Traffic Sign Detection and Recognition
279
TT100K
+
Taiwan's data
Danger
Prohibitory
Mandatory
Cropthesigns
accordingto
ground-truth
w1w1
i5i5i5i5
i4i4
Danger
Mandatory
Prohibitory
pnepne
p3
pl30
p11pn p26 p10
p19p12
p23 p5
ph4.5
pl40
pl50
pl60 pl70 pl80
pl100 pl120
Added false positive
detected by faster RCNN
The first stage
The two stage
Danger
Figure 5: The two-stage processing flowchart with three-category detection. The network training of the first stage is for all
signs or three categories. In the second stage, the background false positives are added for training.
Table 2: The comparison of the miss rate for three networks using the urban testing videos. Faster R-CNN is also evaluated
with additional 3 categories. It is indicated in the table that the low miss rate usually comes with more false positives. Only
the traffic signs larger than 25 ×25 in the videos are considered.
Miss Rate Number of Signs Number of Missed False Positive
YOLOv3 0.0796 1,257 100 1,766
Mask R-CNN 0.0387 1,257 68 1,995
Faster R-CNN 0.0135 1,257 17 1,985
Faster R-CNN (3class) 0.0220 1,257 50 1,436
Table 3: The evaluation of Image Test and Video Test using two classifiers, ResNet18 and SVM for the mandatory category.
‘i4’ and ‘i5’ are the traffic signs shown in Figure 5. ‘i4’ is not available in Video Test because it does not appear in our test
video. The input image size to ResNet18 is 40 × 40.
Image Test Video Test
Classifier
ResNet18 SVM ResNet18 SVM
mAP 81.53% 79.387% 95.42% 95.38%
i4 86.06% 93.97% – –
i5 86.07% 98.37% 97.35% 99.77%
non-sign 72.45% 45.79% 93.49% 91.00%
should be noted that if the wrong category is assigned
from the second approach, the subsequent classifica-
tion network will not be able to obtain the correct re-
sults. The first approach has no such issue but usually
results in a higher false positive rate.
We first consider the classification for the manda-
tory category. Currently there are two different signs,
‘i4’ and ‘i5’, as shown in Figure 5. Table 3 shows the
results of Image Test and Video Test using two clas-
sifiers, ResNet18 and SVM. It can be seen that the
video inputs have better accuracies than the still im-
ages. This is due to some unusual viewpoints of traf-
fic signs in the testing data of TT100K. In our video
testing dataset, the images are all captured with the
camera facing the traffic signs. For the danger cate-
gory, there is only one traffic sign ‘w1’ as shown in
Figure 5. The classification results using ResNet18
(a) w1 (b) x (c) x (d) x
Figure 6: The correct and incorrect triangular signs detected
in the first stage.
and SVM are tabulated in Table 4 for Image Test and
Video Test. The table shows the accuracy of SVM is
higher in Image Test while the accuracy of ResNet18
is higher in Video Test. This is caused by many tri-
angular signs detected in the first stage (as shown in
Figure 6), and considered as ‘w1’ for training in the
second stage.
There are a total of 19 types of prohibitory traf-
VEHITS 2021 - 7th International Conference on Vehicle Technology and Intelligent Transport Systems
280
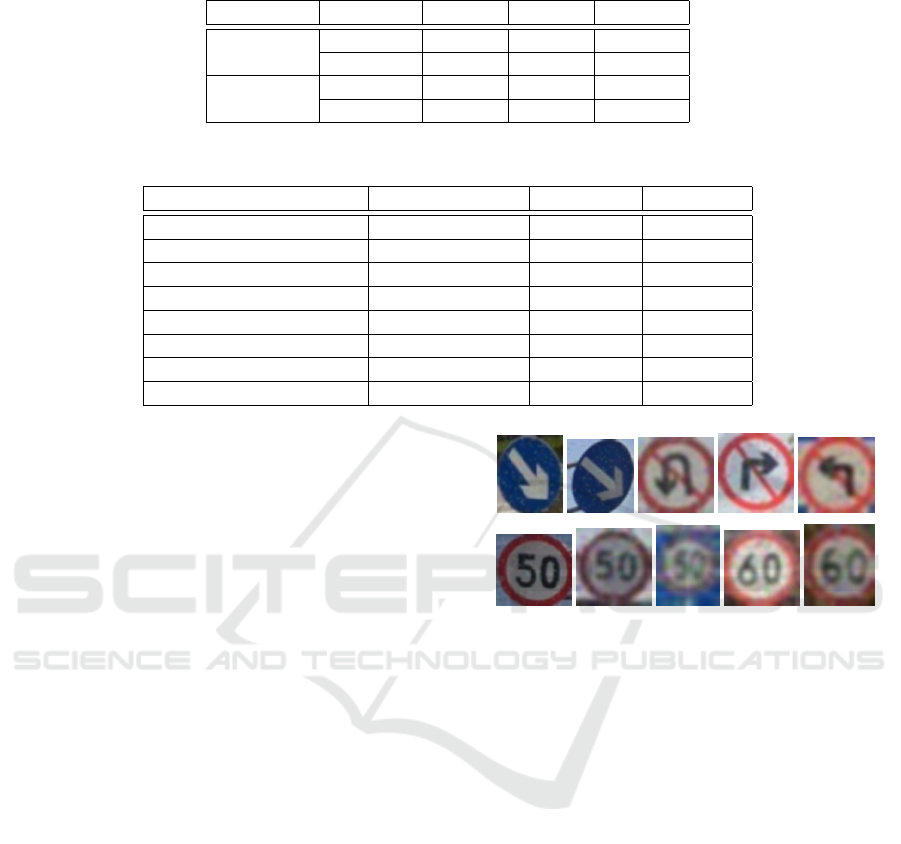
Table 4: The evaluation of Image Test and Video Test using two classifiers, ResNet18 and SVM for the danger category. ‘w1’
is the traffic signs shown in Figure 5. The input image size to ResNet18 is 40 × 40.
Classifier mAP w1 non-sign
Image Test
ResNet18 83.6% 90.01% 77.2%
SVM 97.46% 98.55% 96.36%
Video Test
ResNet18 75.77% 98.33% 53.21%
SVM 46.23% 72% 20.45%
Table 5: The evaluation of Image Test and Video Test using several SVM implementations, VGG16, ResNet18 and SE-
ResNet50 for the prohibitory category.
Classifier Input Image Size Image Test Video Test
Linear SVM 40 × 40 75.66% 40.16%
RBF SVM 40 × 40 76.66% 47.07%
Cascaded SVM classifier 64 × 64 89.85% 61.77%
Cascaded SVM classifier 40 × 40 85.22% 52.35%
Parallel+Cascaded SVM 64 × 64 89.78% 60.99%
VGG16 224 × 224 80.63% 66.46%
ResNet18 40 × 40 76.25% 56.9%
SE-ResNet50 40 × 40 76.77% 66.9%
fic signs for testing, and it is much more challeng-
ing than danger and mandatory. Several classifiers
are tested, including several SVM implementations,
VGG16, ResNet18 and SE-ResNet50, and the com-
parison is tabulated in Table 5. The table shows a big
difference between the accuracies of Image Test and
Video Test. It is mainly due to the low image qual-
ity of the video testing data compared to the TT100K
training dataset. To deal with the problem, Gaussian
blur and Gaussian noise are added to TT100K im-
ages for training. Figure 7 shows some examples of
the processed images, which can be considered as the
transferred version of TT100K dataset images to car
camera images.
To evaluate the effectiveness of this pre-
processing approach on the dataset images, we per-
form another Image Test and Video Test using only
the pre-processed TT100K images (without including
Taiwan road scene images) for training. The mAPs
of Image Test and Video Test without image pre-
processing using ResNet18 are 79.42% and 42.67%,
respectively. After the dataset images are processed
for training, the mAPs become 79.88% and 45.61%,
respectively. This shows the slight improvement on
Video Test using ResNet18. The comparison with
our traffic sign dataset included is shown in Table 6.
When examining the result images, it is found that
some detection results are worse if the pre-processed
training data are used. This is due to the over-filtering
on some low quality images in TT100K dataset. Thus,
image sharpness and Laplacian edge blur degree are
used as thresholds for image filtering. Table 7 shows
the comparison of SE-ResNet50 and VGG16 with
various dataset image alteration.
Figure 7: The processed TT100K images with Gaussian
blur and Gaussian noise for network training.
For the traffic sign detection on the three cate-
gories separately, VGG16 has the best detection ac-
curacy on the prohibitory signs. Thus, it is used as
the framework for the direct detection for all signs
(23 classes) without an initial mandatory, danger and
prohibitory classification. The input image size for
training is also 224 × 224. The mAP of Image Test
and Video Test are 83.41% and 78.57% respectively.
Compared to the approach separating three categories
in the first stage, the miss rate is lower but with a sim-
ilar classification mAP.
For the two-stage network using Faster R-CNN
combined with classifiers, we adopt SE-ResNet50.
The mAP is 80.86% for the evaluation on urban scene
videos, and the detailed comparison is shown in Ta-
ble 8. The first and second rows show our results us-
ing Faster R-CNN+VGG16 without and with setting
3 categories for detection. The third row shows the re-
sults using Mask R-CNN (Tabernik and Sko
ˇ
caj, 2020)
and trained on our dataset. The fourth and last rows
are the result of using Faster R-CNN and YOLOv3,
respectively.
Finally, we retrain the proposed method using
A Two-stage Learning Approach for Traffic Sign Detection and Recognition
281

Table 6: The evaluation of the pre-processing approach on the dataset images using ResNet18. The training data are TT100K
combined with Taiwan road scene images. The input image size is 40 × 40.
Classifier Categories for Pre-processing
Image Test Video Test
ResNet18 – 76.25% 56.9%
ResNet18
all 76.74% 64.13%
ResNet18 pl40, pl50, pl60, p12 (Gaussian Blur)
76.12% 56.74%
ResNet18 pl40, pl50, pl60, p12 (Motion Blur)
74.6% 62.99%
Table 7: The evaluation and comparison of SE-ResNet50 and VGG16 with various dataset image alteration.
Classifier
Input Image Size
Categories for Pre-processing
Image Test Video Test
SE-ResNet50 40 – 76.77% 64.42%
SE-ResNet50
40
pl40, pl50, pl60, p12
78.63% 75.34%
SE-ResNet50
40 all 79.41% 71.34%
VGG16 224 no 80.63% 66.64%
VGG16
224 all 83.54% 77.9%
Table 8: The comparison of the proposed two-stage network using Faster R-CNN combined with classifiers evaluated on
urban scene videos. The first and second rows show our results using Faster R-CNN+VGG16 without and with setting 3
categories for detection. The third row shows the results using Mask R-CNN and trained on our dataset. The fourth and last
rows are the result of using Faster R-CNN and YOLOv3, respectively. The computation time is given per fame.
mAP p23 p5 i5 p19 pl50 Computation Time
Faster R-CNN (1class)
with VGG16
80.86% 0.81% 0.74% 0.87% 0.91% 0.71% 0.087+0.02 sec.
Faster R-CNN (3class)
with VGG16
72.05% 0.77% 0.77% 0.36% 0.84% 0.87% 0.087+0.02 sec.
Mask R-CNN 54.92% 0.57% 0.6% 0.57% 0.5% 0.5% 0.94 sec.
Faster R-CNN 61.6% 0.76% 0.28% 0.88% 0.52% 0.28% 0.10 sec.
YOLOv3 53.55% 0.74% 0.33% 0.6% 0.52% 0.48% 0.03 sec.
GTSDB and GTSRB and compare with (Yang et al.,
2016). The paper adopts a color probability model
to extract traffic signs, and use SVM to classify into
three categories, followed by a CNN for the recog-
nition of individual signs. Our classification accura-
cies using VGG16 in the GTSRB are 97.68% in pro-
hibition and restriction, 86.33% in compliance, and
93.62% in warning categories, respectively.
5 CONCLUSIONS
In this paper, we present a two-stage approach for the
detection and recognition of traffic signs using Faster
R-CNN combined with a classifier. In the first stage,
Faster R-CNN is used and a lower threshold is used to
detect any possible traffic signs. In the second stage,
the classifier is used to recognize the type of a specific
traffic sign. We analyze the discrepancy between the
training dataset and the road scene images acquired
by on-board camera. A pre-processing stage is carried
out to make the image quality of the public dataset
similar to the testing data. Our method has achieved
the mAP of 80.86% on the testing videos, compared
to 53.55% from YOLOv3 and 54.92% from Mask R-
CNN.
ACKNOWLEDGMENTS
This work was financially/partially supported by the
Ministry of Science and Technology of Taiwan under
Grant MOST 106-2221-E-194-004 and Create Elec-
tronic Optical Co., LTD, Taiwan.
REFERENCES
Chiu, Y. C., Lin, H. Y., and Tai, W. L. (2019). Implementa-
tion and evaluation of cnn based traffic sign detection
with different resolutions. In 2019 International Sym-
posium on Intelligent Signal Processing and Commu-
nication Systems (ISPACS), pages 1–2.
Girshick, R., Donahue, J., Darrell, T., and Malik, J. (2014).
Rich feature hierarchies for accurate object detection
and semantic segmentation. In 2014 IEEE Conference
VEHITS 2021 - 7th International Conference on Vehicle Technology and Intelligent Transport Systems
282

on Computer Vision and Pattern Recognition, pages
580–587.
Girshick, R., Radosavovic, I., Gkioxari, G., Doll
´
ar, P.,
and He, K. (2018). Detectron. https://github.com/
facebookresearch/detectron.
He, K., Gkioxari, G., Doll
´
ar, P., and Girshick, R. (2017).
Mask r-cnn. In 2017 IEEE International Conference
on Computer Vision (ICCV), pages 2980–2988.
Houben, S., Stallkamp, J., Salmen, J., Schlipsing, M., and
Igel, C. (2013). Detection of traffic signs in real-world
images: The german traffic sign detection benchmark.
In The 2013 International Joint Conference on Neural
Networks (IJCNN), pages 1–8.
Huang, S. C., Lin, H. Y., and Chang, C. C. (2017). An in-
car camera system for traffic sign detection and recog-
nition. In 2017 Joint 17th World Congress of Inter-
national Fuzzy Systems Association and 9th Interna-
tional Conference on Soft Computing and Intelligent
Systems (IFSA-SCIS), pages 1–6.
Lin, H.-Y., Chang, C.-C., Tran, V. L., and Shi, J.-H.
(2020). Improved traffic sign recognition for in-car
cameras. Journal of the Chinese Institute of Engi-
neers, 43(3):300–307.
Liu, C., Li, S., Chang, F., and Wang, Y. (2019). Machine
vision based traffic sign detection methods: Review,
analyses and perspectives. IEEE Access, 7:86578–
86596.
Mogelmose, A., Trivedi, M. M., and Moeslund, T. B.
(2012). Vision-based traffic sign detection and analy-
sis for intelligent driver assistance systems: Perspec-
tives and survey. IEEE Transactions on Intelligent
Transportation Systems, 13(4):1484–1497.
Philipsen, M. P., Jensen, M. B., Møgelmose, A., Moeslund,
T. B., and Trivedi, M. M. (2015). Traffic light de-
tection: A learning algorithm and evaluations on chal-
lenging dataset. In 2015 IEEE 18th International Con-
ference on Intelligent Transportation Systems, pages
2341–2345.
Rajendran, S. P., Shine, L., Pradeep, R., and Vijayaragha-
van, S. (2019). Real-time traffic sign recognition us-
ing yolov3 based detector. In 2019 10th International
Conference on Computing, Communication and Net-
working Technologies (ICCCNT), pages 1–7.
Redmon, J. and Farhadi, A. (2017). Yolo9000: Better,
faster, stronger. In 2017 IEEE Conference on Com-
puter Vision and Pattern Recognition (CVPR), pages
6517–6525.
Redmon, J. and Farhadi, A. (2018). Yolov3: An incremental
improvement.
Ren, S., He, K., Girshick, R., and Sun, J. (2015). Faster
r-cnn: Towards real-time object detection with region
proposal networks. In Proceedings of the 28th Inter-
national Conference on Neural Information Process-
ing Systems - Volume 1, NIPS’15, page 91–99, Cam-
bridge, MA, USA. MIT Press.
Shrivastava, A., Gupta, A., and Girshick, R. (2016). Train-
ing region-based object detectors with online hard ex-
ample mining. In 2016 IEEE Conference on Com-
puter Vision and Pattern Recognition (CVPR), pages
761–769.
Stallkamp, J., Schlipsing, M., Salmen, J., and Igel, C.
(2012). Man vs. computer: Benchmarking machine
learning algorithms for traffic sign recognition. Neu-
ral Networks, 32:323 – 332. Selected Papers from
IJCNN 2011.
Tabernik, D. and Sko
ˇ
caj, D. (2020). Deep learning for large-
scale traffic-sign detection and recognition. IEEE
Transactions on Intelligent Transportation Systems,
21(4):1427–1440.
Wahyono, Kurnianggoro, L., Hariyono, J., and Jo, K.
(2014). Traffic sign recognition system for au-
tonomous vehicle using cascade svm classifier. In
IECON 2014 - 40th Annual Conference of the IEEE
Industrial Electronics Society, pages 4081–4086.
Yang, Y., Luo, H., Xu, H., and Wu, F. (2016). Towards real-
time traffic sign detection and classification. IEEE
Transactions on Intelligent Transportation Systems,
17(7):2022–2031.
Yuan, Y., Xiong, Z., and Wang, Q. (2019). Vssa-net: Verti-
cal spatial sequence attention network for traffic sign
detection. IEEE Transactions on Image Processing,
28(7):3423–3434.
Zaklouta, F. and Stanciulescu, B. (2012). Real-time
traffic-sign recognition using tree classifiers. IEEE
Transactions on Intelligent Transportation Systems,
13(4):1507–1514.
Zhang, J., Huang, M., Jin, X., and Li, X. (2017). A real-
time chinese traffic sign detection algorithm based on
modified yolov2. Algorithms, 10(4).
Zhu, Z., Liang, D., Zhang, S., Huang, X., Li, B., and Hu, S.
(2016). Traffic-sign detection and classification in the
wild. In 2016 IEEE Conference on Computer Vision
and Pattern Recognition (CVPR), pages 2110–2118.
A Two-stage Learning Approach for Traffic Sign Detection and Recognition
283
