
Open Data Integration in 3D CityGML-based Models Generation
Mcdonnell Ara
´
ujo Maieron
a
and Jos
´
e Palazzo Moreira de Oliveira
b
Informatics Institute, Federal University of Rio Grande do Sul, Av. Bento Gonc¸alves, 9500, Porto Alegre, Brazil
Keywords:
Smart Cities, Data Integration, 3D Models, CityGML.
Abstract:
Facing the increasing complexity of large urban centers caused by population growth and the dynamic nature
of cities, their managers seek to optimize services and infrastructures in terms of scalability, environment, and
security to adapt to demand, making their cities smarter. Therefore, these new modern centers’ administrators
should apply smart governance techniques to manage the physical and data infrastructure and seek alignment
with the global open data initiative. As a point of intersection between physical and data infrastructure, 3D
models of cities have been playing an important role in people’s daily lives, being a fundamental element for
several applications. In this context, CityGML, a semantic model for 3D data representation adopted by several
cities, appears as a possible solution for modeling. This paper presents an approach of integrating open data
in the semi-automatic generation of 3D models based on CityGML, “enriching” semantic information about
the instances with the association with the OpenStreetMaps database. A case study was performed using data
provided by the Municipality of Porto Alegre, BR. The model generated in CityGML goes through semantic,
geometric, and schema level validations, proving the proposed approach’s feasibility.
1 INTRODUCTION
Facing the increasing complexity of large urban cen-
ters caused by population growth and the dynamic
nature of cities, their managers seek to optimize ser-
vices and infrastructures in terms of scalability, en-
vironment, and security to adapt to demand, making
their cities smarter (Khatoun and Zeadally, 2016). Al-
bino et al. (2015) cites several components of smart
cities, among them the most relevant are: smart econ-
omy, smart people, smart governance, smart mobility,
smart environment, and smart living, directly related
to aspects of urban life such as industry, education, e-
democracy, logistics, infrastructures, efficiency, sus-
tainability, security, and life quality.
All components can be associated in some way
with the city’s physical and data infrastructure. For
instance, smart mobility is related to the available
transport modes, and smart governance needs inter-
operable platforms and databases to provide online
services and shareable data, using a standardized
semantic-based data model that unifies data format
and provides shared meaning to them.
As a point of intersection between physical and
data infrastructure 3D city models are essential. In
a
https://orcid.org/0000-0002-7098-7061
b
https://orcid.org/0000-0002-9166-8801
its review, Biljecki et al. (2015) cites several studies
related to the applications of 3D city models, among
them traditional ones such as urban planning, 3D reg-
istration, routing and also more specific studies such
as radio wave propagation, irradiation estimation, and
estimation of noise pollution propagation. Thus, it
is notable that 3D models should be considered an
essential part of the database of smart cities (Prandi
et al., 2013).
The inclusion of semantic aspects enhances the
capacity of the models. In studies related to disas-
ter management and emergency response, for exam-
ple, knowing the building’s function is necessary, as
strategic structures and hospitals require special at-
tention in this context (Gr
¨
oger and Pl
¨
umer, 2012).
Also, it is considered a good practice of governance
the adoption of international modeling standards by
the data providers to avoid heterogeneity and allow-
ing interoperability.
As a possible 3D model solution that covers both
the semantic aspects and the heterogeneity issue,
there is CityGML
1
. It is a shared semantic informa-
tion model for representing 3D urban objects man-
aged since 2008 by the OGC (Open Geospatial Con-
sortium) (Gr
¨
oger et al., 2012). CityGML has been
adopted worldwide, and several cities, in line with the
1
https://www.ogc.org/standards/citygml
Maieron, M. and Moreira de Oliveira, J.
Open Data Integration in 3D CityGML-based Models Generation.
DOI: 10.5220/0010383201670174
In Proceedings of the 23rd Inter national Conference on Enterprise Information Systems (ICEIS 2021) - Volume 1, pages 167-174
ISBN: 978-989-758-509-8
Copyright
c
2021 by SCITEPRESS – Science and Technology Publications, Lda. All rights reserved
167

government’s open data initiative, make their models
in this standard available for sharing.
Despite the absence of 3D data, some cities pro-
vide several 2D geographic data to generate 3D mod-
els when aggregated with altimetry data. In gen-
eral, these public data are generated from traditional
and well-established cartographic production meth-
ods, following a series of criteria and norms in the
production process. Consequently, their geometric
precision meets the quality standards stipulated for
this type of product. On the other hand, as a rule,
these data only describe the instances geometrically,
having little or no semantic information such as name,
address, class, and function, information of great rel-
evance for specific applications.
This article presents an hybrid approach for inte-
grating official open data in the semi-automatic gen-
eration of 3D models CityGML based, performing
the semantic “enrichment” of the instances associat-
ing official data with Volunteered Geographic Infor-
mation (VGI) data from OpenStreetMaps (OSM).
The expectation is that such an approach can
help city administrators who seek alignment with
smart city guidelines to generate their valid 3D se-
mantic models with reuse and integration of existing
data, taking advantage of the positive aspects of each
database, reducing costs in that process. In addition,
the approach is formalized in the form of workflows,
facilitating their reimplementation in different con-
texts.
This paper is organized as follows: Section 2
presents the main concepts. Section 3 describes the
proposed approach. Section 4 describes a study case,
commenting on primary results. Section 5 contains
the related work, and section 6 concludes the paper.
2 MAIN CONCEPTS
Data integration consists of combining data sets ob-
tained from different sources and providing a unified
version of them. It is an old and pervasive issue, found
in several scientific and governmental sectors (Lenz-
erini, 2001). As this is a broad subject, this section
only addresses issues related to spatial data.
Mohammadi et al. (2006) deals with the issue in
the context of implementing spatial data infrastruc-
tures and consolidates the technical aspect variables
to be analyzed in the integration process as follows:
Computational heterogeneity (standards and interop-
erability), Topology, Semantics, Reference system
and scale, Data quality, Data model and Metadata. In
these circumstances, international standards must be
followed, providing common concepts, such as (In-
ternational Organization for Standardization, 2013),
which defines six elements of spatial data quality de-
scribed below:
• Positional Accuracy: Comparison of the geo-
graphic coordinates of a feature with the geo-
graphic coordinates of the object it represents in
the real world within the same reference system;
• Thematic Accuracy: Accuracy of classifications
and themes associated with specific locations or
objects, that is, the class of a pixel in a land cover
image or label of a vector feature;
• Completeness: Presence or absence of features,
attributes or relationships regarding the specifica-
tions of the final product;
• Temporal Quality: Quality of temporal attributes
such as date of collection, date of publication, fre-
quency of updating or time validity;
• Usability: Alignment of data with the needs and
requirements of the end-user.
CityGML was designed as an open data model
based on XML, being an application scheme of
GML3 (Geography Markup Language 3), an exten-
sible international standard for sharing and coding
data spatial data issued by OGC and ISO TC 211
(Gr
¨
oger et al., 2012), having an adequate structure
to present city models with semantic information.
These semantic features allow users to perform func-
tions with the metadata provided by CityGML. The
modules in CityGML reflect the appearance, spatial
and theme characteristics of an object and with the
model, common definitions of the attributes and re-
lationships between basic entities of a 3D city model
were achieved, taking into account semantic and geo-
metric/topological aspects.
In CityGML, it is possible to model the instances
in five different levels of detail (LoD). The LoD pro-
vides the adequacy of the amount and refinement of
information data for specific end-user applications.
One of the implementations to maintain seman-
tic integrity in CityGML is the inclusion of codelists
2
with discrete values for filling in the attributes of the
features, thus avoiding common mistakes such as in-
correct typing or creation of values outside the at-
tribute domain. Such lists are specified in a schema
external to CityGML, and it is only referenced in the
model.
2
An example of codelist used as a reference in the
model’s technical specifications can be found at http://www.
sig3d.org/codelists/standard/
ICEIS 2021 - 23rd International Conference on Enterprise Information Systems
168

3 APPROACH DESCRIPTION
Due to each module of the CityGML model’s partic-
ularity, different workflows are defined according to
the need for processes to achieve the desired integra-
tion.
With a realistic view, where it is not easy to find
official data sources that provide detailed information
on features, such as positioning of windows, doors,
divisions of internal spaces, and other details that are
part of the features and necessary for the implemen-
tation of modules in LoD3 and 4, such levels of detail
were not included in the approach. Additionally these
details are not interesting for our application.
The workflow representing the proposed approach
to Building module is shown in Figure 1, with the
steps to be followed in the process of integrating
spatial data, improve semantics with OSM data and
implementing the CityGML-based model. Due to
space limitations, the workflows proposed for the
other modules have been omitted from this article.
It is important to note that the proposed approach is
directed to 2D input data aggregating altimetry in-
formation from the intersection with Digital Terrain
Model (DTM), representing ground data, and Digital
Surface Models (DSM), representing altimetry data of
all features above ground level like buildings, trees,
and bridges. However, there are different techniques
for generating 3D geometries in addition to this (e.g.,
photogrammetry). Still, parts of the process such as
integration with VGI data and LoD2 building genera-
tion can be used in other studies with different meth-
ods to create 3D geometries.
4 CASE STUDY
In this section, a practical application of the devel-
oped approach is carried out. Initially, the test area’s
characterization and input data are made, followed
by 3D modeling of each CityGML modules imple-
mented. Finally, the generated model’s validation re-
sults are presented at three levels: schema, geometric,
and semantics.
4.1 Test Area
Porto Alegre is the capital of the state of Rio Grande
do Sul - BR. Its estimated population is 1,488,252 in-
habitants and its total area is 495,390 km
2
. The city
is administratively divided into 94 neighborhoods, of
which three were chosen as the test area: Menino
Deus, Santa Tereza, and Praia de Belas. This area has
heterogeneous features, involving sports complexes,
shopping centers, parks, residential areas, and rugged
relief, having the necessary characteristics for apply-
ing the case study. The area encompassing the three
neighborhoods is 9,394 km
2
.
4.2 Spatial Data Sources
The Municipality of Porto Alegre (PMPA), through
the Municipal Department of Environment and
Sustainability (SMMAS/PMPA), provides the geo-
graphic data resulting from the 2010 cadastral map-
ping project as open data, following the guidelines of
intelligent governance concerning government data.
The files can be found in PDF and DWG formats
3
.
This database provides the 2D geometric contour of
the features. The final cartographic product gener-
ated was classified as “Class A” according to the
levels of planimetric tolerance stipulated in BRASIL
(1984) being compatible as inputs for implementing
CityGML models up to LoD3.
The altimetry data comes from the point cloud
obtained for the same mapping project, divided into
DTM and DSM. The average density is 2 pt/m
2
.
The data used for the semantic “enrichment” of
the features were obtained from the OSM. Because
it is a global open data source and developed by col-
laborative mappers, the final product, despite under-
going a series of validation processes, is not obtained
through formal and well-established cartographic pro-
duction methods. Therefore, positional accuracy and
the levels of generalization of the features differ from
the databases provided by the PMPA. On the other
hand, the description of the features through attributes
is much better in the OSM data than the official data.
Besides the categorization, OSM data is described by
tags, where the mapper can include additional infor-
mation.
4.3 3D Modeling
The primary tool used in data modeling and integra-
tion is the FME
4
. For some digitization steps that
were performed manually, the open-source QGIS
5
was used.
4.3.1 Building Module
The first common step in the implementation of
the Building module and other modules is the pre-
processing step, where the geometric integrity of the
3
http://www2.portoalegre.rs.gov.br/spm/default.php?
p secao=310
4
https://www.safe.com/
5
https://qgis.org/en/site/
Open Data Integration in 3D CityGML-based Models Generation
169
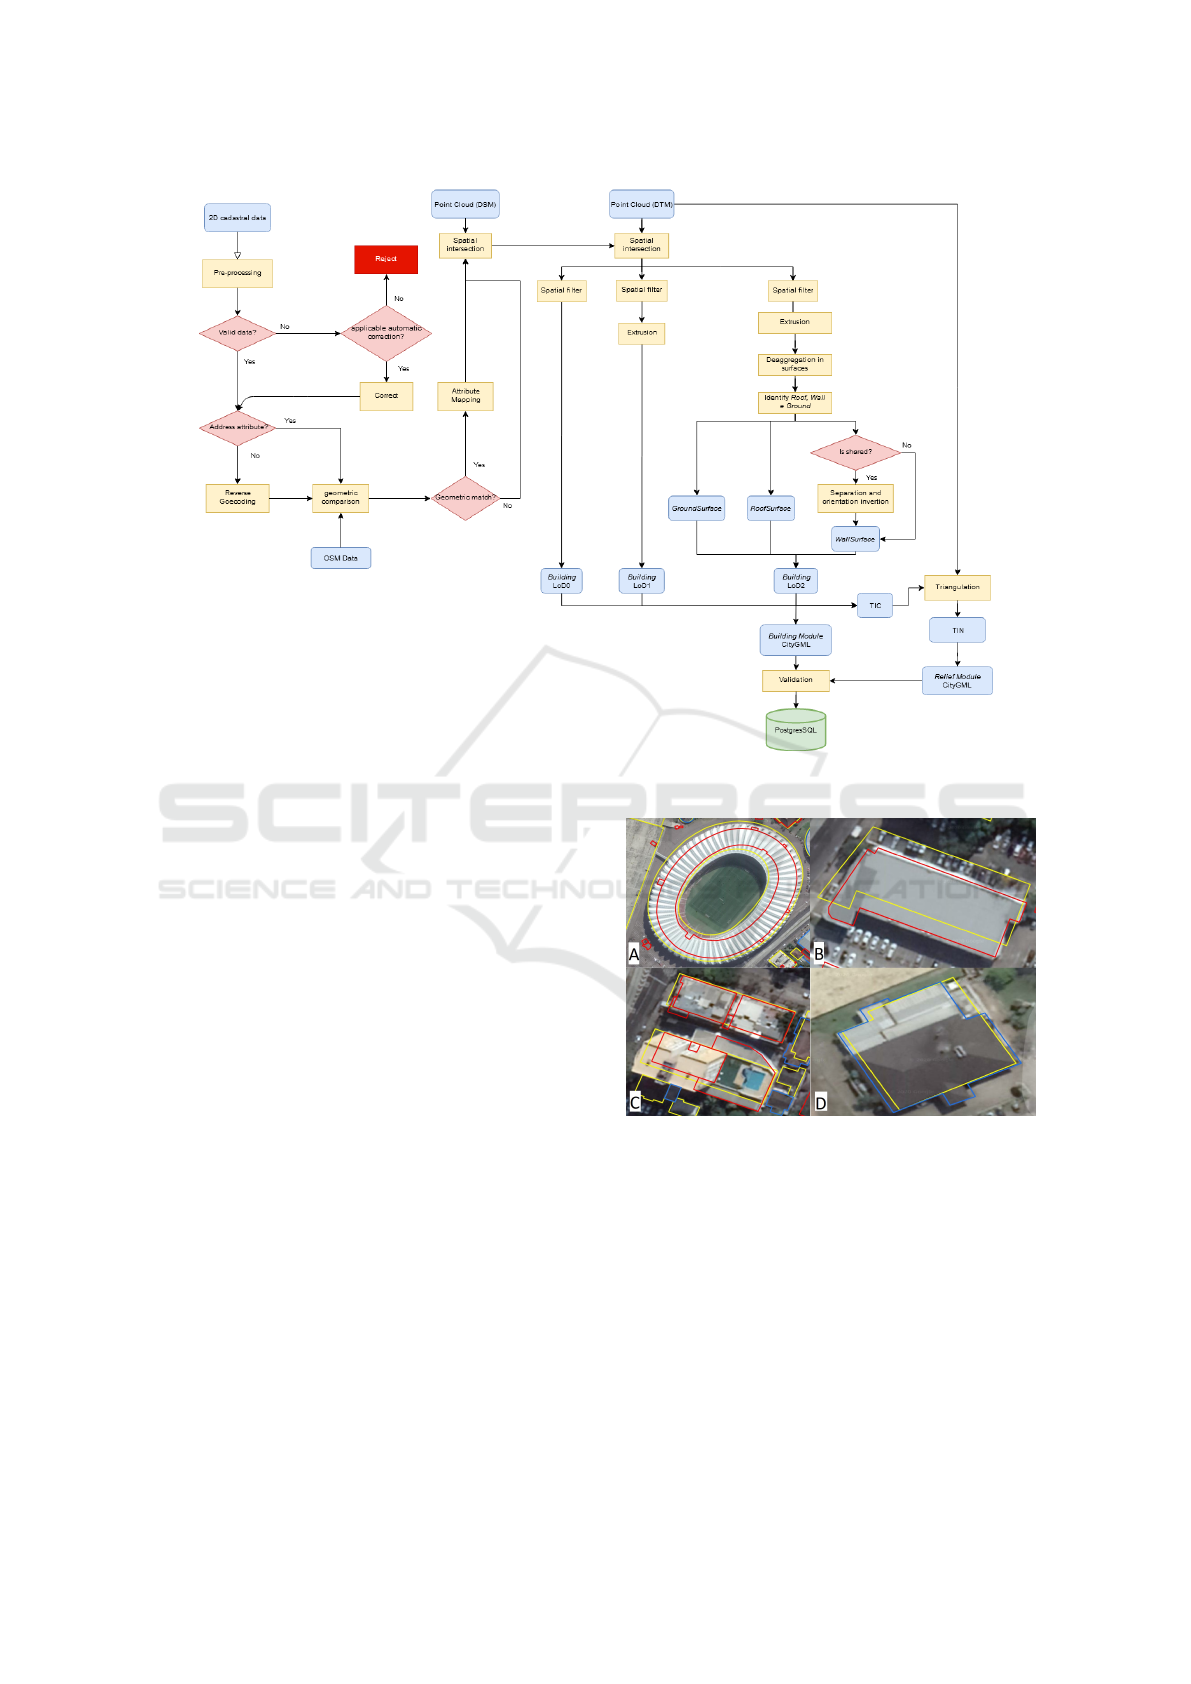
Figure 1: Building module integration workflow.
input features is checked, and the initial classification
of official data is also mapped to the corresponding
CityGML codelists.
As the official database does not have address
data, reverse geocoding was performed automatically
using the transformer geocoder. A script in Python
was used to adapt the returned address format to the
xAL format standards used in CityGML.
Although there is an initial classification of build-
ings in the official database, 95.08% of them are
classified as generic, lacking a semantic description.
Thus, an alternative found to minimize this missing
information is integration with the OSM database.
Initially, the geometric association between the fea-
tures is made, and, later, the attributes are mapped, as-
sociating the feature attribute of the OSM with those
existing in the codelists in the CityGML model. To be
considered corresponding features, the criteria used in
the building category are the comparison of the total
area of the polygons and the distance from the central
point of the building. Features with up to 36% of area
variance and a center point, not 5m apart, are consid-
ered corresponding. This wider range was necessary
due to the difference in some aspects of mapping be-
tween the two bases. Figure 2 shows particular cases
found in the geometric integration process.
The cases of non-association between the two
Figure 2: In the mosaic, the yellow outlines represent the
OSM database, the red outlines represent the features of
the official database that were not associated with the OSM
base, and the blue outline the features that were related. Im-
age source: Google.
bases shown in Figure 2 are related to the difference
in quality levels and generalization between both. In
case A, the difference in temporal accuracy between
the databases leads to the non-association. Case B
shows the difference in positional accuracy between
the bases caused by the divergence of reference sys-
tems and data acquisition methods. The difference
between the levels of generalization between the fea-
tures is evidenced in case C. Finally, case D shows an
ICEIS 2021 - 23rd International Conference on Enterprise Information Systems
170

Table 1: Number of features from the official base with
OSM attributes associated.
Attribute class function name SAG
Features 19 147 116 14
Attribute operator website description YOC
Features 29 73 31 10
example of the association between features. Despite
the differences in generalization and positional accu-
racy, the buildings passed the comparison criteria.
From 20.093 features present in the input data,
19.405 found a geometric match. The mapping of the
values of the OSM tags to the codelists was done pri-
marily automatically using the token sort ratio pro-
cess from the fuzzywuzzy
6
available for Python. Unas-
sociated values were analyzed individually to comple-
ment the mapping. Although, Table 1 shows a low
number of attributes added to the features of the offi-
cial base. This shows that, despite having good geo-
metric completeness and temporal quality, the OSM
data have low thematic completeness in the study
area. Table 2 shows an OSM data thematic complete-
ness comparative in four cities. We can see that the
other cities have a better collaborative mapping cul-
ture, which would allow a more significant aggrega-
tion of attributes in these regions. In this compari-
son, test areas that were visually similar to the test
area of this work were used, not encompassing cities
as a whole. The attribute SAG and YOC stands for
“storeys above ground” and “year of construction”,
respectively.
Regarding geometry, a filter is applied according
to the ground surface’s area and height to define the
LoD of each instance. In the Building module, fea-
tures up to LoD2 were implemented. To fully ex-
ploit the potential of CityGML within the possibili-
ties of the input data, the topological relationship be-
tween surfaces and buildings was implemented using
the GML3 Xlink mechanism.
Surfaces shared between two buildings are iden-
tified with the transformer SurfaceOnSurfaceOver-
layer, and they are assigned a new unique identifier.
Thus, the shared surface geometry is implemented
only once and referenced by the two buildings that
have a hierarchical relationship, avoiding redundancy
in the implementation of geometries. A shared sur-
face must be referenced in one of the buildings, in-
verting vertice’s orientation. It is necessary so that
the visualization platforms can correctly interpret the
geometries to display them in both buildings.
Figure 3 shows the study area features imple-
mented in this module.
6
https://pypi.org/project/fuzzywuzzy/
Figure 3: Building module overview in the study area.
4.3.2 CityFurniture Module
The implementation of the CityFurniture module is
simpler and straightforward and does not require in-
tegration with the OSM base. An additional phase
is the implementation of implicit geometries in the
classes light pole, energy tower and bus stop based
on pre-existing 3D models in 3DS format. Thus, the
geometry of the 3DS model is referenced, based on
the geographic coordinate of the original feature.
4.3.3 Vegetation Module
The Vegetation module implementation covered the
two classes provided by CityGML, PlantCover and
SolitaryVegetationObject. As in the CityFurniture
module, the features of the SolitaryVegetationObject
classes were associated with 3DS models as implicit
geometry. Due to the high number of SolitaryVegeta-
tionObject class features in the study area, a simple
3DS model was adopted to avoid overloading the vi-
sualization platforms. The tree’s height is obtained
from the DSM intersection so that the filter can be ap-
plied according to the LoD implemented. To keep the
final module clean and due to some inconsistencies
in the input data like vegetation polygons overlapping
other features, the PlantCover class was implemented
only as surfaces instead of solids.
4.3.4 WaterBody Module
In the official database, three data sets together form
the Hydrography class. The first contains the lake fea-
tures with polygon type geometry. The next two have
linear-type geometry but describe features differently.
In one, rivers and channels are described by their cen-
tral axis and, in the other, contour’s margins describe
the same features. A manual step was performed
to enable the implementation of features with Multi-
Surface geometry, creating polygon-type geometries
based on the linear geometry of the margins. In this
step, QGIS software was used.
As in the other modules, the initial classification
of features is mapped to CityGML codelists. As the
Open Data Integration in 3D CityGML-based Models Generation
171
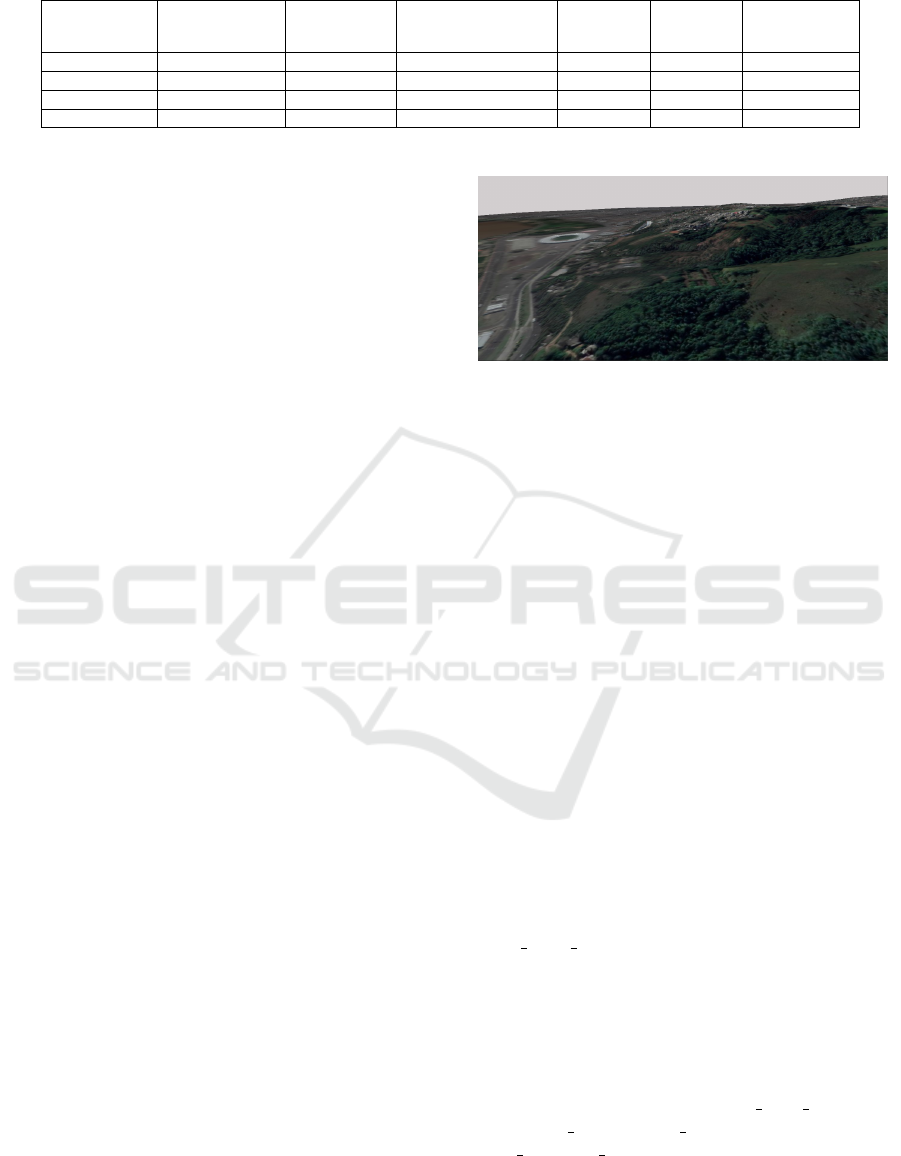
Table 2: Thematic completeness comparative in OSM data.
City # of Buildings
Attribute
”name” (%)
Building
Categorization (%)
YOC (%) SAG (%)
Average tags
per building
Porto Alegre 21.807 0,8 3,4 0 0 2,14
London 8.470 12,6 58,5 0,2 17,8 4,71
Berlin 8.398 5,2 70,1 1,0 61,8 3,7
Amsterdam 22.981 0,6 57,9 97,9 0,3 5,1
parameters of the generalization filters for each LoD
were not formalized in the model’s technical speci-
fications, all features existing in the official database
were implemented in LoD0 and 1.
4.3.5 Transportation Module
In the same way, as in the Watebody module, a manual
digitization step was performed to generate polygon
type geometries based on the data set containing the
roads’ external contour. Thus, LoD1 implementation
is possible.
Features with line-type geometry intersect with
the MDT and are converted directly to LoD0Network.
In polygonal features, a filter is applied to identify the
elevated features, such as viaducts, to aggregate the
altimetry data from the intersection with the DSM.
The other polygonal features receive the altimetry
data from the DTM.
4.3.6 LandUse and Relief Modules
The implementation of the LandUse module is sim-
pler since most of the geometries are absorbed from
other modules. In this way, only the features that do
not belong to any other module go through the inter-
section with the MDT to aggregate the altimetry data.
After that, the attributes are converted to the codelists
of the LandUse module.
After mapping attributes, the spatial relationship
analysis between layers is performed. If surfaces
overlap and the attributes of function and use are dif-
ferent, they are accumulated.
The implementation of the Relief module is
straightforward. The feature’s base geometry imple-
mented in the other modules is placed as breaklines
and the DTM point cloud as the primary input in the
triangulation. In this way, the final terrain model will
automatically adapt to the features’ contour, main-
taining the topological integrity between the modules.
Figure 4 presents an overview of the implemented
Relief module.
4.3.7 Validation and Data Management
Validation was performed at three levels: seman-
tic, geometric, and syntactic (or schema) to verify
Figure 4: Sample of features from Relief module.
the generated model’s integrity. The semantic anal-
ysis includes plausibility checks of attributes, allow-
ing only attributes compatible with the CityGML at-
tribute structure and type. The syntax check ensures
that the read data is conformant to the OGC standard
document for CityGML 2.0 and the geometric level
validate 3D primitives according to the international
standard ISO19107 (Wagner et al., 2013).
The first stage of validation is done by checking
the validation option in the CityGML writer in FME
Workbench. With that, the CityGML XSD is used
for validating the implementation at the schema level.
Some aspects of semantics, such as duplicate unique
identifiers and filling in some attributes that are de-
pendent on others, are also verified. In this step, the
inconsistencies presented were corrected by editing
the work flow in the FME.
To continue the validation, two open source tools
were used: Val3dity (Ledoux, 2018) and 3DCityDB
(Yao et al., 2018). Val3dity deals with the geomet-
ric validation of features. Only the Building mod-
ule presented inconsistencies generated when iden-
tifying shared surfaces. Thirteen errors type 101
(TOO FEW POINTS) were found generated when a
line-type feature is created when the surfaces overlap
were identified. It occurs due to a rounding error in
the 4
th
decimal place. The elimination of the linear
feature can be done without loss of information.
All other errors are related to the orienta-
tion of the surfaces. 60.5% of the features pre-
sented errors of type 302 (SHELL NOT CLOSED),
303 (NON MANIFOLD CASE), or 307 (POLY-
GON WRONG ORIENTATION). To correct this
type of error, invert the order of the indicated polygon,
but the validation report shows the building’s unique
identifier, not the surface, making it difficult to iden-
ICEIS 2021 - 23rd International Conference on Enterprise Information Systems
172

Table 3: Approach, completeness and validation compara-
tive in related works.
Rel.
work
Approach # of
Modules
Validation
Auto Semi Sch Geo Sem
(1) X 1 X X
(2) X 1 X
(3) X 8 X X X
(4) X 6 X
(5) X 3 X X X
(6) X 1
(7) X 7 X X X
tify the features for correction.
The Building module was also implemented with-
out the step of identifying shared surfaces, which is
optional. There were no inconsistencies presented by
the tool in this version, ensuring the final model’s in-
tegrity.
Once generated, 3D models can be stored in spa-
tial databases, facilitating their maintenance and man-
agement. For this, the 3DCityDB
7
platform was used,
a free 3D geo-database solution to import, manage,
analyze, visualize, and export virtual 3D city models
according to the CityGML standard. When loading
the model, the data goes through a scheme validation
phase again, confirming the final model’s quality.
5 RELATED WORK
Due to the growing acceptance of CityGML as a
model for implementing semantic 3D models, sev-
eral studies have been published presenting case
studies and reporting the modeling experiences with
different input data scenarios and integration plat-
forms. Most of the works deal with the integration
of official open data for semi-automatic generation
of the 3D model (Agugiaro, 2016)(1)(Buyukdemir-
cioglu et al., 2018)(2) (Soon and Khoo, 2017)(3).
Kolbe et al. (2015)(4) and (Jane
ˇ
cka, 2019)(5) used
an automatic method to generate the CityGML-based
model of New York City and Prague, respectively.
Other approaches suggest the automatic generation
of CityGML-based models from OSM data (Goetz,
2013) (6). A difference also noted is the number of
CityGML modules and validations implemented. Ta-
ble 3 shows a comparison of the cited studies con-
sidering the approach used, modules implemented,
and validations applied to the generated models. The
present work is indicated as the item (7).
This work has similar points with the previous
research, differentiating itself by proposing a hybrid
approach of using official open data and VGI data
7
https://www.3dcitydb.org/3dcitydb/
to mitigate the lack of thematic completeness of the
datasets available by government agencies. It is also
comparable to studies of a broader scope regarding
the number of CityGML modules implemented and
validations performed. Also, an approach for auto-
matic identification of shared surfaces in the Building
module is applied, with the limitations presented in
Section 4.3.7.
6 CONCLUSIONS
This paper presented a hybrid approach for semi-
automatic generation of 3D semantic CityGML-based
models from official databases and semantic ”enrich-
ment” from OSM database integration. The FME
workspaces used in the implementation, as well as
the spreadsheets used in mapping OSM attributes to
CityGML codelists will be available at https://github.
com/mcmaieron/DWG CityGML. the workspace was
designed in alignment with the case study’s input data
but can be used in a general scenario with some adap-
tations.
Thus, this work can assist city administrators who
want to start implementing a 3D database following
standards adopted worldwide.
Due to the lack of information about the hierarchy
between features in the input data, it was not possible
to use the full potential of CityGML, such as the im-
plementation of cityGenericGroup, BuildingParts and
BuildingInstalation
Some suggestions for future work to complement
the proposed approach are:
• Possible extension of CityGML for national pur-
poses, following van den Brink et al. (2013),
adding codelists specific to the national territory
mapping context, based on the current mapping
standards;
• Add semantic validation method to the VGI used;
• automatic identification of roof format from a
point cloud, aiming to bring the features closer to
reality;
• improve the implementation of the identification
of shared surfaces, increasing their efficiency and
avoiding validation errors;
• implementation of the bridge and tunnel modules
automatically;
ACKNOWLEDGEMENTS
This work was partially funded by one author indi-
vidual grant from CNPq, Brazil and also by institu-
Open Data Integration in 3D CityGML-based Models Generation
173

tional grants from the Ministry of Education’s agency
CAPES, Brazil - Finance Code 001.This work was
only possible with the support of the Brazilian Army
and the Board of Geographic Service (DSG).
REFERENCES
Agugiaro, G. (2016). First steps towards an integrated
citygml-based 3d model of vienna. ISPRS Annals of
Photogrammetry, Remote Sensing and Spatial Infor-
mation Sciences, III-4:139–146.
Albino, V., Berardi, U., and Dangelico, R. M. (2015). Smart
cities: Definitions, dimensions, performance, and ini-
tiatives. Journal of Urban Technology, 22(1):3–21.
Biljecki, F., Stoter, J., Ledoux, H., Zlatanova, S., and
C¸
¨
oltekin, A. (2015). Applications of 3D City Models:
State of the Art Review. ISPRS International Journal
of Geo-Information, 4(4):2842–2889.
BRASIL (1984). Decreto nº 89.817, de 20 de junho de
1984. estabelece as instruc¸
˜
oes reguladoras das normas
t
´
ecnicas da cartografia nacional.
Buyukdemircioglu, M., Kocaman, S., and Isikdag, U.
(2018). Semi-Automatic 3D City Model Generation
from Large-Format Aerial Images. ISPRS Interna-
tional Journal of Geo-Information, 7(9):339.
Goetz, M. (2013). Towards generating highly detailed
3D CityGML models from OpenStreetMap. Interna-
tional Journal of Geographical Information Science,
27(5):845–865.
Gr
¨
oger, G., Kolbe, T. H., Nagel, C., and H
¨
afele, K.-H.
(2012). OGC City Geography Markup Language
(CityGML) Encoding Standard. page 344.
Gr
¨
oger, G. and Pl
¨
umer, L. (2012). CityGML – Interopera-
ble semantic 3D city models. ISPRS Journal of Pho-
togrammetry and Remote Sensing, 71:12–33.
International Organization for Standardization (2013). Ge-
ographic information — data quality. Standard ISO
19157:2016, Geneva, CH.
Jane
ˇ
cka, K. (2019). Transformation of 3D geospatial data
into CityGML – a case of Prague. Reports on Geodesy
and Geoinformatics, 107(1):41–48.
Khatoun, R. and Zeadally, S. (2016). Smart cities: con-
cepts, architectures, research opportunities. Commu-
nications of the ACM, 59(8):46–57.
Kolbe, T. H., Burger, B., and Cantzler, B. (2015). Citygml
goes to broadway. In Fritsch, D., editor, Photogram-
metric Week ’15, pages 343–356, Stuttgart. Institute
for Photogrammetry, University of Stuttgart, Wich-
mann.
Ledoux, H. (2018). val3dity: validation of 3D GIS prim-
itives according to the international standards. Open
Geospatial Data, Software and Standards, 3(1).
Lenzerini, M. (2001). Data integration. In Proceedings
of the Twentieth ACM SIGMOD SIGACT SIGART
Symposium on Principles of Database Systems, pages
233–246, New York, NY, USA. Association for Com-
puting Machinery.
Mohammadi, H., Binns, A., Rajabifard, A., and
Williamson, I. (2006). Spatial data integration. In
Proceedings of the Seventeenth UN Regional Carto-
graphic Conference for Asia and the Pacific. United
Nations.
Prandi, F., De Amicis, R., Piffer, S., Soave, M., Cadzow,
S., Gonzalez Boix, E., and D’Hont, E. (2013). Us-
ing citygml to deploy smart-city services for urban
ecosystems. ISPRS - International Archives of the
Photogrammetry, Remote Sensing and Spatial Infor-
mation Sciences, XL-4/W1:87–92.
Soon, K. H. and Khoo, V. H. S. (2017). Citygml modelling
for singapore 3d national mapping. ISPRS - Interna-
tional Archives of the Photogrammetry, Remote Sens-
ing and Spatial Information Sciences, XLII-4/W7:37–
42.
van den Brink, L., Stoter, J., and Zlatanova, S. (2013). Es-
tablishing a national standard for 3D topographic data
compliant to CityGML. International Journal of Ge-
ographical Information Science, 27(1):92–113.
Wagner, D., Alam, N., and Coors, V. (2013). Geometric val-
idation of 3D city models based on standarized quality
criteria, page 197–210. CRC Press.
Yao, Z., Nagel, C., Kunde, F., Hudra, G., Willkomm, P.,
Donaubauer, A., Adolphi, T., and Kolbe, T. H. (2018).
3DCityDB - a 3D geodatabase solution for the man-
agement, analysis, and visualization of semantic 3D
city models based on CityGML. Open Geospatial
Data, Software and Standards, 3(1):5.
ICEIS 2021 - 23rd International Conference on Enterprise Information Systems
174
