
A Survey of Survival Analysis Techniques
George Marinos
a
and Dimosthenis Kyriazis
b
Digital Systems Department, University of Piraeus, Piraeus, Greece
Keywords:
Survival Analysis, Clustering, Machine Learning, Risk Stratification.
Abstract:
Survival analysis is a branch of statistics for analyzing the expected duration of the time until the event of inter-
est happens. It is not only applicable to biomedical problems but it can be widely used in almost every domain
since there is a relevant data structure available. Recent studies have shown that it is a powerful approach for
risk stratification. Since it is a well established statistical technique, there have been several studies that com-
bine survival analysis with machine learning algorithms in order to obtain better performances. Additionally
in the machine learning scientific field the usage of different data modalities has been proven to enhance the
performance of predictive models. The majority of the scientific outcomes in the survival analysis domain
have focused on modeling survival data and building robust predictive models for time to event estimation.
Clustering based on risk-profiles is partly under-explored in machine learning, but is critical in applications
domains such as clinical decision making. Clustering in terms of survivability is very useful when there is
a need to identify unknown sub-populations in the overall data. Such techniques aim for identification of
clusters whose lifetime distributions significantly differs, which is something that is not able to be done by
applying traditional clustering techniques. In this survey we present research studies in the aforementioned
domain with an emphasis on techniques for clustering censored data and identifying various risk level groups.
1 INTRODUCTION
The pursuit of accuracy is the primary purpose of al-
most all human field endeavors. A good pursuit of
accuracy might be the dominant expectation for the
practitioners, especially in the healthcare field, given
the extremely small margin of error on the predic-
tions which they make. Survival analysis is a major
decision technique in healthcare practices. It can be
used for a variety of reasons such as the deeper under-
standing of the effect of some genetic or proteomic
bio markers on prognosis of cancer patients, under-
standing the impact that risk factors such as diabetes,
hypertension and other cardiovascular diseases have
on Chronic Kidney Diseases (CVD) or even know the
outcome of physical exercises, diets or family health
history in understanding cardiac heart problems in pa-
tients. In general it is used to predict the time un-
til a particular event of interest happens. Although
it was initially created in terms of medical research
and the purpose was to model a patient’s survival, it
can be applied to several other application domains.
For instance, survival analysis can be used to estimate
a
https://orcid.org/0000-0002-2220-0009
b
https://orcid.org/0000-0001-7019-7214
the probability of failure of manufacturing equipment
based on the hours of operations. It turns out that the
vast majority of the survival analysis research results
have focused on time to event prediction either by us-
ing statistical methods or by using machine learning
algorithms. Despite its importance there is only lim-
ited number of research papers focused on survival
clustering. For instance in many real world cases
practitioner’s main pursuit is to discover the various
sub-groups of a cohort that corresponds to different
risk levels and not necessarily the individual risk esti-
mation of each subject. In such a scenario the target
would be the discovery of the clusters which not only
have similar traits but simultaneously have different
lifetimes. The purpose of this paper is to emerge the
importance of this type of methods used for risk strat-
ification. Such methods have been developed for risk-
profile based clusters-discovery in a cohort that may
have unknown number of clusters. The remainder of
this paper is divided into four sections which include
the taxonomy of methods that have been used for
survival analysis, problem formulation and the def-
initions of the main survival functions, summary of
all the methods used for risk-based clusters discovery
and conclusion.
716
Marinos, G. and Kyriazis, D.
A Survey of Survival Analysis Techniques.
DOI: 10.5220/0010382307160723
In Proceedings of the 14th International Joint Conference on Biomedical Engineering Systems and Technologies (BIOSTEC 2021) - Volume 5: HEALTHINF, pages 716-723
ISBN: 978-989-758-490-9
Copyright
c
2021 by SCITEPRESS – Science and Technology Publications, Lda. All rights reserved
Non
Parametric
Semi
Parametric
Parametric
Time to event
Prediction
Clustering
Based on
Risk Profile
Statistical
Methods
Machine
Learning
Methods
Survival Trees
Bayesian
Methods
Neural Networks
Support Vector
Machines
Advanced
Machine
learning
Statistical
Methods
Machine
Learning
Methods
Semi
Supervised
Clustering
Pre-weighted
sparce
Clustering
Deep
Lifetime
Clustering
Machine
learning for
survival
prediction on
high
dimensional
data
Kaplan Meier
Life Table
Cox Regression
Non Parametric
Non Parametric
Survival Analysis
Methods
Partial Cox
Regression
Analysis
Complementary
Hierarchical
Clustering
Supervised
Principal
Components
Relevant
survival types
identification
via clustering
Network data
Clustering
method for
cansored and
collinear
survival data
Survival
Clustering
Analysis
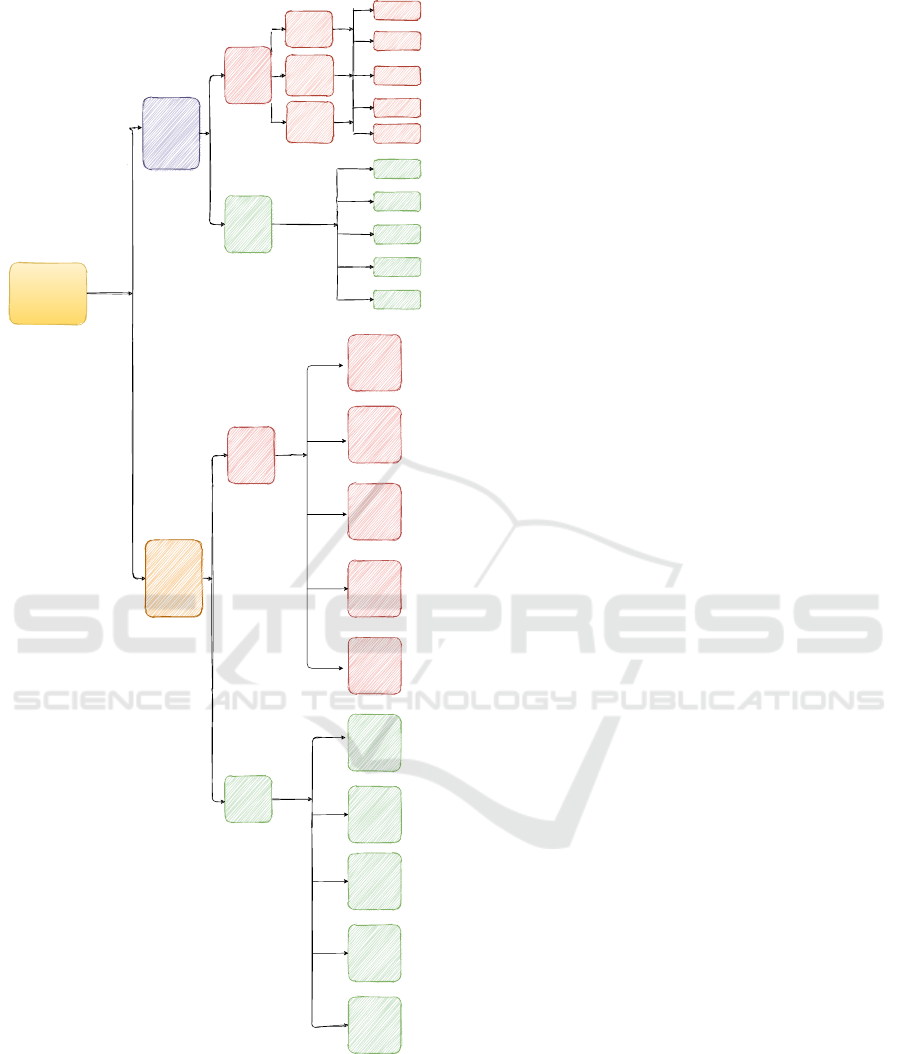
Figure 1: Survival Analysis Taxonomies.
2 TAXONOMY OF SURVIVAL
ANALYSIS METHODS
Survival Analysis methods can be divided in Statisti-
cal and Machine Learning methods. Statistical meth-
ods can be divided into three wide categories: (i) para-
metric, (ii) non-parametric and (iii) semi-parametric
methods. Under the assumption of having a data
set that follows a particular distribution, parametric
methods can be very efficient and accurate for time to
event prediction. For example assuming the time of
the examined data set follows a well known theoreti-
cal distribution such as exponential it is quite simple
to use it for time to event estimation. Although in real
life datasets, it is difficult to obtain data that follows a
known theoretical distribution. Non-parametric meth-
ods can be used in this case since there is no underly-
ing distribution for the event time and there are no as-
sumptions that need to be met. Kaplan Meier (Kaplan
and Meier, 1958) method is one of the most popular
methods of this category. Third category is a hybrid of
the parametric and non-parametric approaches. Like
non-parametric methods, at semi-parametric models
the knowledge of the underlying distribution of time
to event is not required. Cox model (Cox, 1972) is the
most widely used semi-parametric survival analysis
method in this category and it assumes the attributes
have a multiplicative effect in the hazards function
that is constant over time.
2.1 Machine Learning Techniques for
Time to Event Predictions
Despite statistical techniques which aim to character-
ize the distribution of the event times as well as the
statistical properties of the parameters of each (statis-
tical) model, machine learning methods seek for mak-
ing prediction of event phenomenon at a given time
point. Decision tree algorithm (Bou-Hamad et al.,
2011) which is grounded on splitting the data recur-
sively based on a particular splitting criterion adapted
for survival analysis (Bou-Hamad et al., 2011). Since
the main characteristic of such an algorithm is the
splitting criterion there have been some research stud-
ies focusing on the finding of a splitting criterion that
can be effectively used for survival analysis (Ciampi
et al., 1987). Bayesian Analysis is one of the most
fundamental principles in statistics which links the
posterior probability and the prior probability. Several
studies have used such models to predict the proba-
bility of the event of interest (Kononenko, 1993) and
benefit from the good properties of Bayesian mod-
eling (Ibrahim et al., 2014) such as interpretability.
Support vector machines (Van Belle et al., 2007) also
are a very important category of machine learning al-
gorithms which can be used both for classification
(Shivaswamy et al., 2007) and regression and have
been successfully adapted to survival analysis prob-
lems.
A Survey of Survival Analysis Techniques
717

In addition neural network - based machine learn-
ing models have been proposed to predict lifetime of
a subject. (Katzman et al., 2018) is based on the semi
parametric Cox Proportional Hazard model. Further-
more there have been introduced deep learning tech-
niques for life time prediction such as (Giunchiglia
et al., 2018) that is based on a recurrent neural net-
work architecture. The proposed neural network takes
as inputs at each time the features characterizing the
patient and the identifier of the time step, creates an
embedding, and outputs the value of the survival func-
tion in that time step. In Figure 1 we demonstrate a
graphic illustration for the taxonomy of all the sur-
vival methods that have been introduced in literature
not only for solving the task of time to event predic-
tion but also techniques that have been proposed for
clustering based on risk profile.
3 SURVIVAL ANALYSIS
PROBLEM FORMULATION
A given observation i in our dataset represented by a
triplet (X
i
, y
i
, z
i
), where X
i
∈ R
1×P
is the feature vec-
tor, z
i
is the binary event indicator which is marked
as 1 when the subject has experienced the event of in-
terest, otherwise it is marked as 0. Finally y
i
is the
observed time which is equal to the survival time T
i
if the given observation is uncensored otherwise C
i
, if
the given observation is censored.
y
i
=
(
T
i
, if z
i
= 1
C
i
, if z
i
= 0
(1)
The purpose of survival analysis is to estimate the
time to the event of interest for a new instance k with
feature predictors denoted by a new feature vector X
k
.
3.1 Concept of Censorship/ Censored
Data
In real world scenarios the collection of complete data
sets may be a challenging expectation due to various
reasons. Especially in clinical studies the data col-
lection period may last for several years and would
require consistency of the participants of the study in
order to keep tracking their data. It is possible that
the event of interest can not be observed for some in-
stances. Censorship is related to the problem of miss-
ing data, consequently this is the main reason which a
traditional regression model cannot be fitted for mak-
ing predictions in such kind of data (Prinja et al.,
2010). Censorship can generally be observed in three
variations (Clark et al., 2003): (i) right-censoring,
which is the most common type of censoring and it
occurs when the observed survival time is less than
or equal to the true survival time, (ii) left-censoring,
for which the observed survival time is greater than
or equal to the true survival time, and (iii) interval-
censoring, for which we only know that the event oc-
curs during a given time interval. In survival analysis
when utilizing censored data the time to the event of
interest is the target variable. This is only known for
those instances who have experienced the event dur-
ing the study period. In Figure 2 we cite an example
of a cohort that may be used in the context of survival
analysis. The cohort is made up of four subjects each
one of them belongs to a different category of censor-
ship and one not censored subject. Subject 1 is not
censored since we have monitored the duration of its
life from the early start until the event occurs. Subject
2 and subject 3 are considered to be right censored
because we have track them from the early start of
our study but it had not been experienced the event of
interest until the end of study so we do not have pre-
cisely information about the duration of its lifetime.
Subject 4 is considered to be left censored since it is
unknown when it entered the study and subject 5 is
considered to be interval censored since data collec-
tors lost its signals in the middle of the study.
Time
End of study
Start of study
Not Censored
Right Censored
Right Censored
Left Censored
Died
Alive
Known Period
Unknown Period
Interval Censored
Sub.2
Sub.3
Sub.4
Sub.5
Sub.1
Figure 2: Concept of Censorship.
3.2 Survival Analysis Formulas and
Definitions
The survival function (Lee and Wang, 2003) repre-
sents the probability that the time to the event of in-
terest is not earlier than a specified time t. Often sur-
vival function is referred as: the survivor function or
survivorship function in problems of biological sur-
vival, and as reliability function in mechanical sur-
HEALTHINF 2021 - 14th International Conference on Health Informatics
718

vival problems. Survival function is represented as
follows:
S(t) = P(T > t) (2)
The function above denotes an individual that sur-
vives longer than t. Survival function decreases when
the t increases. Its starting value is 1 for t = 0 which
represents that in the beginning of the observation all
subjects survive. From the definition of cumulative
death distribution function F(t),
S(t) = 1 − F(t) (3)
Cumulative death function represents the probability
that the event of interest occurs earlier than time t .The
survival function is therefore associated with a contin-
uous probability density function by
S(t) = P(T > t) =
Z
t
P(x)dx (4)
Similarly the survival function is related to a discrete
probability P(t) by
S(t) = P(T > t) =
∑
T >t
P(x) (5)
3.3 Survival Hazard Function
In survival analysis, another commonly used function
is the hazard function h(t), which is also called the
force of mortality, the instantaneous death rate or the
conditional failure rate (Dunn and Clark, 2009). The
hazard function t (Lee and Wang, 2003) does not in-
dicate the prospect or probability of the event of in-
terest, but it is the rate of event at time t as long as no
event occurred before time t. In this sense, the hazard
is a measure of risk. The hazard function is defined
as:
h(t) =
f (t)
S(t)
(6)
Specifically is the ratio of the probability density
function to the survival function. In particular since
by definition the probability density function is:
f (t) = lim
dt→ 0
F(t + dt) − F(t)
dt
(7)
where dt denotes the time interval we can write the
hazard function as:
h(t) = lim
dt→ 0
Pr(t ≤ T < t + dt|T ≥ t)
dt
(8)
It is defined as of failure during a very small time in-
terval assuming that the individual has survived to the
beginning of the interval. The hazard function can
also be defined in terms of the cumulative distribu-
tion function F(t) and the probability density function
f (t) as:
h(t) =
f (t)
1 − F(T )
=
f (t)
S(t)
(9)
and finally the cumulative hazard function describes
the accumulated risk up to time t given by
H(t) =
Z
t
0
h(x)dx (10)
In addition to the above relations, there is another
important connection between h(t) (or H(t)) and S(t)
given by
S(t) = exp(−
Z
t
0
h(x)dx) = exp(−H(t)) (11)
4 CLUSTERING BASED ON RISK
PROFILE
Li and Gui proposed a different extension of partial
least squares (PLS) regression to the censored sur-
vival data in the framework of the Cox model by pro-
viding a parallel algorithm for constructing the latent
components (Li and Gui, 2004). The proposed al-
gorithm involves constructing predictive components
by iterated least square fitting of residuals and Cox
regression fitting. These components can then be
used in the Cox model for building a useful predic-
tive model for survival. Although the purpose of
constructing such a method is not towards survival
clustering it can also be used for clustering survival
data since the principal components are constructed
as well.
In a relevant study, researchers noticed the impor-
tance of cancer subtype discovery using genes expres-
sion data and clinical data together (Bair and Tibshi-
rani, 2004). Discovered subtypes appeared to have
significant differences in terms of patients survival
when the semi supervised proposed technique was
used. The authors addressed the problem of can-
cer subtypes identification without having any prior
knowledge of the existence or the number of cancer
subtypes in the dataset. The whole process of this
approach has two parts. Firstly only genes expres-
sion data are utilized using Cox regression in order to
assign each of them a (“Cox”) score and then select
only those genes with high score. After that proce-
dure only significant genes have been chosen for the
dataset. Having chosen a subset of genes expression
they apply traditional clustering techniques e.g. K-
means only on genes expression data and they obtain
the desirable number of clusters. At the second part
of the proposed approach they test the cluster assign-
ment using only the clinical data. Utilizing clinical
data they set cluster assignment as the dependent vari-
able and apply classification algorithms. Finally the
classification algorithm performs well which means
A Survey of Survival Analysis Techniques
719

that clusters assignments have been correctly identi-
fied.
Bair (Bair et al., 2006) and Tibshirani (Bair and
Tibshirani, 2004) mentioned the drawback of the us-
age of principal components for regression and sur-
vival model which is the fact that few principal com-
ponents may summarise a large proportion of the vari-
ance present in the data in this way there is no guar-
antee that these principal components are associated
with the outcome of interest. Therefore they proposed
(Bair et al., 2006) a semi-supervised approach, which
they called supervised principal components (SPC).
In this method univariate Cox scores are computed
for each feature and the choice of the most significant
features is done by picking only the features with the
best Cox scores obtained . Mainly supervised prin-
cipal components method is similar to conventional
principal components analysis except that it uses a
subset of the predictors selected based on their asso-
ciation with the outcome. An improved variation of
previous method “pre-weighted sparse clustering” has
also been proposed (Gaynor and Bair, 2017). As men-
tioned before Sparse clustering method and also semi-
supervised clustering method have significant limita-
tions mainly because they are heavily depend on the
number of features that have been characterized as
“significant”. Pre-weighted sparse clustering aims to
overcome the limitations of sparse clustering by per-
forming conventional sparse clustering. It identifies
features whose mean values differ across the clusters.
Then the sparse clustering algorithm is run a second
time, but rather than giving equal weights to all fea-
tures as in the first step, this pre-weighted version of
sparse clustering assigns a weight of 0 to all features
that differed across the first set of clusters. The mo-
tivation is that this procedure will identify secondary
clusters that would otherwise be obscured by clusters
that have a larger dissimilarity measure. Moreover in
this study it is proposed the supervised version of pre-
weighted sparse clustering which assigns the initial
weights of the chosen clustering algorithm by giving
non zero weights to the features that are most strongly
associated with the outcome variable.
The identification of “secondary” clusters that
may be “covered” by the primary clusters involving
large numbers of high variance features has been a
case of research (Nowak and Tibshirani, 2008). At the
step of this method traditional hierarchical clustering
is performed on a data matrix X. A new data matrix
X results from this hierarchical clustering procedure
and is defined to be the expected value of the resid-
uals when each row of X is regressed on the group
labels when the hierarchical clustering tree is cut at a
given height. The expected value is taken over all pos-
sible cuts. This has the effect of removing high vari-
ance features that may be obscuring secondary clus-
ters. Traditional hierarchical clustering is then per-
formed on this modified matrix X, yielding secondary
clusters.
Zhang (Zhang et al., 2016) following the Bair
approach (Bair and Tibshirani, 2004) used a mixed
methodology composed by statistical and machine
learning methods. The proposed method was fo-
cused on clusters discovery over clinical and genes
expression data. Authors proposed a semi supervised
pipeline for survival clustering discovery. Authors
initially used only the clinical part of the data in or-
der to estimate the censored lifetimes. Actually they
utilized penalized logistic regression and penalized
proportional hazard model with the Expectation min-
imization algorithm in order to select only the most
significant clinical features which are correlated with
the event of interest. After a list of significant clinical
variables have been identified they used the K neigh-
bors based method (with 10 neighbors) on the filtered
data set for the survival time estimation for the pa-
tients with censored survival time. After they applied
silhouette method on the filtered data set in order to
identify the optimal number of clusters. Then Fast
correlation based filter method is applied on genes ex-
pression data n order to select the most significant fea-
tures. With this method redundant features with lower
relevancy are removed from the list until the number
of last features reaches a targeted low bound or there
are no more features to be removed. Finally a classi-
fier is used in the selected genes in order to predict the
label identified from the clinical data set. The perfor-
mance of the classifier can be considered as a measure
of the robustness of the performed clustering and also
if the identified groups share the same survival distri-
bution.
Mouli (Mouli et al., 2017) proposed a decision
tree based approach which aim for survival cluster-
ing. The final purpose of this research paper was to
cluster censored data and identify two or more pop-
ulations with different risk level. Paper’s objective
was the survival distributions identified to be differ-
ent across clusters. The initial step of this method is
to concretely break the data set in two populations and
based on attribute - values test to observe the identi-
fied populations survival distribution. This is done by
using the Kaplan-Meier estimates. Kuiper (Kuiper,
1960) statistics is used after in order to quantify the
the significance of the difference across survival dis-
tributions. The procedure is repeated for all attribute
- value pairs in order to choose the one with the best
results is used as a node in the constructed decision
tree. In this step of the algorithm best result is consid-
HEALTHINF 2021 - 14th International Conference on Health Informatics
720

ered to be the lowest p-value of the aforementioned
Kuiper statistic measure where the significance level
of the algorithm can be specified by the user. Au-
thors describe that the process of performing many
statistical tests at each node conduct a multiple hy-
pothesis problem which can be corrected using Bon-
ferroni (Rupert Jr et al., 2012) correction as proposed
in the paper. The suggested methodology results in a
tree where each leaf node has an associated popula-
tion of users and thus clusters can be observed at leaf
nodes. Despite the fact that in his way, subjects with
similar survival distributions will be placed closer in
the tree diagram, the degree of dissimilarity between
identified clusters may not necessarily be significant.
Hence the target is to identify clusters with differ-
ent survival distributions authors propose the usage
of complete graph. The graph consists of leaf nodes
as vertices and p-values as edge weights. Each nodes
will be connected to the other with the edges ( normal-
ized p-values) which will denote a significant or non
significant relationship between them. Markov clus-
tering algorithm (Van Dongen, 2001) is applied to the
final graph .
A recent research study (Mouli et al., 2019) intro-
duced DeepCLife an inductive neural network based
clustering model architecture. This framework aims
for the observation of empirical lifetime distribution
of underlying clusters. The final purpose of this
framework is to conduct clusters which have different
lifetime distributions whereas the subjects of the same
cluster share the same lifetime distribution. The pro-
posed model does not assume proportional hazards.
A very important asset of this research paper is that
it addresses the issue of unobservability of termina-
tion signals, meaning that it can be applied on data
sets that termination signals have not been recorded.
The main contribution of this work is the proposal
of a novel clustering loss function which is based on
Kuiper two-sample test. Authors provide a tight up-
per bound of the Kuiper p-value, without computa-
tionally expensive gradients which until then was the
main difficulty of its usage as a loss function (due
to the test’s infinite sum - this is not going to be in-
cluded). In this paper authors describe the usage of
a feedforward neural network although the proposed
model is not restricted to a feedforward architecture,
which makes this approach flexible and worthy to try
different models in order to observe differences in the
performance. The proposed model aims to identify
clusters with maximizing the divergence between the
empirical lifetime distributions of each cluster.
Liverani (Liverani et al., 2020) proposed a Dirich-
let process mixture model for censored survival data
with covariates, inspired predominantly by (Molitor
et al., 2011) and (Molitor et al., 2010). The proposed
model is a mixture of Weibull distributions and also
distributions suitable for the data set covariates which
non parametrically assigning data to clusters. In this
approach the response variable (the presense of ab-
sense of the event) and the covariates are modeled in-
dependently which allows the exploration of the com-
plex relationship between them. Despite the fact of
independently modelling this approach can uncover
linear and non-linear relationships between covariates
and response.
Unlike DeepCLife which aims to identify clusters
by maximizing pairwise differences between the sur-
vival function of all cluster pairs Chapfuwa’s (Chap-
fuwa et al., 2020) study focuses on characterization
of time-to-event predictive distributions from a clus-
tered latent space conditioned on covariates. In par-
ticular authors at Survival Cluster Analysis produced
a complex model which provides not only risk pro-
file based clustering but also acts as a deterministic
encoder that maps covariates into a latent representa-
tion and on top of that a stochastic survival predictor
feeds from the latent representation. In this paper a
Bayesian non parametric approach was used for the
clustering process. The Bayesian approach embold-
ened the latent representation to act like a mixture of
distributions while distribution matching approach (in
this study) follows a Dirichlet Process. Table 1 sum-
marize all the algorithms developed in the literature
that aim to address the problem of distinguish sub-
jects in a dataset based on their risk profile taking into
account also the censorship which is usually met in
real world datasets.
5 CONCLUSIONS
Survival analysis can be used widely in almost every
domain since there is a relevant data structure avail-
able. Notwithstanding the fact that there have been
published many scientific reports applying machine
learning techniques for time to event predictions
which have been obtaining very good performances,
published scientific researches dedicated to survival
clustering techniques were significantly fewer. Clus-
tering in terms of survivability is very useful when
there is a need to identify subpopulations in the over-
all dataset who are unknown. Such techniques aim
for identification of clusters whose lifetime distribu-
tions significantly differs which is something that is
not able to be done by applying traditional clustering
techniques.
A Survey of Survival Analysis Techniques
721

Table 1: This is a summary of all methods and algorithms that have been used in literature for clustering based on risk profile
while using censored data.
Survival Clustering Algorithms
Title Application
Domain
Characteristics / Attributes / Features
Partial Cox regres-
sion analysis for
high-dimensional
microarray gene
expression data
Applicable at
every Domain
Reduces the number of features in a high-dimensional dataset
since it aims to identify the principal components and parallel
apply partial least squares method. It has not computational lim-
itations in terms of number of variables in contrast to other sta-
tistical methods. Proportional Hazard assumption must be met
Semi-Supervised
Methods to Predict
Patient Survival from
Gene Expression
Data
HealthCare Restricted to be used for Medical data (clinical and genes ex-
pression). Results may depend heavily on the features chosen.
Proportional Hazard assumption must be met. It is dedicated to
clinical and genes expression data even thought it can be per-
fectly fitted in medical applications
Complementary hier-
archical clustering
HealthCare Uncovers structures arising from the weaker genes. It is an auto-
matic procedure and after performing the initial clustering, there
is no need to decide how many groups should be considered or
where to cut the dendrogram. The backfitting algorithm used
somewhat complicates the interpretation of the initial, comple-
mentary clustering
Supervised principal
components (SPC)
Applicable at
every Domain
Reduces the number of features in a high-dimensional dataset.
Proportional Hazard assumption must be met
Using the machine
learning approach
to predict patient
survival from high-
dimensional survival
data
Healthcare It is dedicated to clinical and genes expression data thought it
can be perfectly fitted in medical applications. Restricted to be
used for Medical data (clinical and genes expression). Results
may depend heavily on the features chosen. Proportional Hazard
assumption must be met.
Identifying User Sur-
vival Types via Clus-
tering of Censored
Social Network Data
Applicable at
every Domain
The model is based on decision trees and thus can handle both
categorical and numerical features with ease and without encod-
ing variables.
Identification of rel-
evant sub-types via
pre-weighted sparse
clustering
HealthCare It is not essential to choose an “optimal” set of initial weights
since the procedure tends to correct itself. Tends to self-correct
so that relevant features get nonzero weight (even if their initial
weight was zero) and irrelevant features get 1 zero weight (even
if their initial weight was nonzero)
Deep Lifetime Clus-
tering
Applicable at
any Domain
Does not assume Proportional Hazard. It can smoothly handle
the absence of termination signals. There is not a way to find the
optimal number of clusters apart from making many different
trials and keep the best results.
Clustering method
for censored and
col-linear survival
data
HealthCare Deals with data collinearity, therefore model can achieve a good
performance without to be necessary strongly correlated covari-
ates to be removed before. The independent response - covari-
ates modelling allows the exploration of the complex relation-
ship between the response and the covariates.
Survival Cluster
Analysis
Applicable at
any Domain
It is not necessary for the user to specify the number of clus-
ters since they are identified automatically. The model identifies
interpretable populations
HEALTHINF 2021 - 14th International Conference on Health Informatics
722

ACKNOWLEDGEMENTS
This research has been co-financed by the European
Union and Greek national funds through the Oper-
ational Program Competitiveness, Entrepreneurship
and Innovation, under the call RESEARCH – CRE-
ATE – INNOVATE (project code: BeHEALTHIER -
T2EDK-04207).
REFERENCES
Bair, E., Hastie, T., Paul, D., and Tibshirani, R.
(2006). Prediction by supervised principal compo-
nents. Journal of the American Statistical Association,
101(473):119–137.
Bair, E. and Tibshirani, R. (2004). Semi-supervised meth-
ods to predict patient survival from gene expression
data. PLoS Biol, 2(4):e108.
Bou-Hamad, I., Larocque, D., Ben-Ameur, H., et al. (2011).
A review of survival trees. Statistics surveys, 5:44–71.
Chapfuwa, P., Li, C., Mehta, N., Carin, L., and Henao, R.
(2020). Survival cluster analysis. In Proceedings of
the ACM Conference on Health, Inference, and Learn-
ing, pages 60–68.
Ciampi, A., Chang, C.-H., Hogg, S., and McKinney, S.
(1987). Recursive partition: A versatile method for
exploratory-data analysis in biostatistics. In Biostatis-
tics, pages 23–50. Springer.
Clark, T. G., Bradburn, M. J., Love, S. B., and Altman,
D. G. (2003). Survival analysis part i: basic con-
cepts and first analyses. British journal of cancer,
89(2):232–238.
Cox, D. R. (1972). Regression models and life-tables. Jour-
nal of the Royal Statistical Society: Series B (Method-
ological), 34(2):187–202.
Dunn, O. J. and Clark, V. A. (2009). Basic statistics: a
primer for the biomedical sciences. John Wiley &
Sons.
Gaynor, S. and Bair, E. (2017). Identification of relevant
subtypes via preweighted sparse clustering. Compu-
tational statistics & data analysis, 116:139–154.
Giunchiglia, E., Nemchenko, A., and van der Schaar, M.
(2018). Rnn-surv: A deep recurrent model for sur-
vival analysis. In International Conference on Artifi-
cial Neural Networks, pages 23–32. Springer.
Ibrahim, J. G., Chen, M.-H., and Sinha, D. (2014). B
ayesian survival analysis. Wiley StatsRef: Statistics
Reference Online.
Kaplan, E. L. and Meier, P. (1958). Nonparametric esti-
mation from incomplete observations. Journal of the
American statistical association, 53(282):457–481.
Katzman, J. L., Shaham, U., Cloninger, A., Bates, J., Jiang,
T., and Kluger, Y. (2018). Deepsurv: personalized
treatment recommender system using a cox propor-
tional hazards deep neural network. BMC medical re-
search methodology, 18(1):24.
Kononenko, I. (1993). Inductive and bayesian learning in
medical diagnosis. Applied Artificial Intelligence an
International Journal, 7(4):317–337.
Kuiper, N. H. (1960). Tests concerning random points on a
circle. In Nederl. Akad. Wetensch. Proc. Ser. A, num-
ber 1 in 63, pages 38–47.
Lee, E. T. and Wang, J. (2003). Statistical methods for sur-
vival data analysis, volume 476. John Wiley & Sons.
Li, H. and Gui, J. (2004). Partial cox regression analy-
sis for high-dimensional microarray gene expression
data. Bioinformatics, 20(suppl 1):i208–i215.
Liverani, S., Leigh, L., Hudson, I. L., and Byles, J. E.
(2020). Clustering method for censored and collinear
survival data. Computational Statistics, pages 1–26.
Molitor, J., Papathomas, M., Jerrett, M., and Richardson, S.
(2010). Bayesian profile regression with an applica-
tion to the national survey of children’s health. Bio-
statistics, 11(3):484–498.
Molitor, J., Su, J. G., Molitor, N.-T., Rubio, V. G., Richard-
son, S., Hastie, D., Morello-Frosch, R., and Jerrett, M.
(2011). Identifying vulnerable populations through an
examination of the association between multipollutant
profiles and poverty. Environmental Science & Tech-
nology, 45(18):7754–7760.
Mouli, S. C., Naik, A., Ribeiro, B., and Neville, J.
(2017). Identifying user survival types via cluster-
ing of censored social network data. arXiv preprint
arXiv:1703.03401.
Mouli, S. C., Teixeira, L., Ribeiro, B., and Neville, J.
(2019). Deep lifetime clustering. arXiv preprint
arXiv:1910.00547.
Nowak, G. and Tibshirani, R. (2008). Complementary hier-
archical clustering. Biostatistics, 9(3):467–483.
Prinja, S., Gupta, N., and Verma, R. (2010). Censoring in
clinical trials: review of survival analysis techniques.
Indian journal of community medicine: official pub-
lication of Indian Association of Preventive & Social
Medicine, 35(2):217.
Rupert Jr, G. et al. (2012). Simultaneous statistical infer-
ence. Springer Science & Business Media.
Shivaswamy, P. K., Chu, W., and Jansche, M. (2007). A
support vector approach to censored targets. In Sev-
enth IEEE International Conference on Data Mining
(ICDM 2007), pages 655–660. IEEE.
Van Belle, V., Pelckmans, K., Suykens, J., and Van Huffel,
S. (2007). Support vector machines for survival analy-
sis. In Proceedings of the Third International Confer-
ence on Computational Intelligence in Medicine and
Healthcare (CIMED2007), pages 1–8.
Van Dongen, S. (2001). Graph clustering by flow simula-
tion. 2000. University of Utrecht.
Zhang, W., Tang, J., and Wang, N. (2016). Using the
machine learning approach to predict patient sur-
vival from high-dimensional survival data. In 2016
IEEE International Conference on Bioinformatics and
Biomedicine (BIBM), pages 1234–1238. IEEE.
A Survey of Survival Analysis Techniques
723
