
A Principled Approach to Enriching Security-related Data for Running
Processes through Statistics and Natural Language Processing
Tiberiu Boros
1
, Andrei Cotaie
1
, Kumar Vikramjeet
2
, Vivek Malik
2
, Lauren Park
2
and Nick Pachis
3
1
Adobe Systems, Romania
2
Adobe Systems, U.S.A.
3
Formerly Adobe Systems, U.S.A.
Keywords:
Infrastructure, Machine Learning, Statistical Approach, Natural Language Processing, Labeling, Tagging,
Security, Process, Process Metadata, Enriching Data, Hubble Stack, Risk Based Anomaly Detection.
Abstract:
We propose a principled method of enriching security related information for running processes. Our method-
ology applies to large organizational infrastructures, where information is properly collected and stored. The
data we use is based on the Hubble Stack (an open-source project), but any alternative solution that provides
the same type of information will suffice. Using statistical and natural language processing (NLP) methods
we enrich our data with tags and we provide an analysis on how these tags can be used in Machine Learning
approaches for anomaly detection.
1 INTRODUCTION
Logging and monitoring are the most common tools
used by security teams across organizations with the
purpose of detecting breaches and reacting to inci-
dents. In simple environments, rule-based systems
are able to quickly identify and alert on suspicious
events. However, in complex cloud-based infrastruc-
tures, the inter-dependencies between various cloud
components (storage, computing, database, authenti-
cation etc.) makes it hard to detect systems that oper-
ate outside of normal parameters. Also, maintenance
or quick-fix operational events represent a large por-
tion of the noise that poises the data and adds over-
head for the security teams. In addition to that, log-
ging and verbosity are not necessarily standardised
across the entire infrastructure and this can be treated
as a separate topic.
Arguably, a deterministic process for well-
documented infrastructures can be as basic as: use a
list of allowed processes for each instance, a table for
scheduled execution and alert on any event that con-
tradicts these rules. In practice, this is is not feasible
for most infrastructures (a fact demonstrated by the
time-lapse between the incidents and their detection)
and the most common reasons are:
• Development cycles for applications and cloud
services often lack behavioral documentation un-
til the final (production) stage;
• Manual interventions such as planned mainte-
nance and quick fixes for critical system outages
(CSOs) often impact normal system behavior. As
a rule of thumb, the larger the infrastructure the
more noise/false positives you get in your data;
• Third party software that undergoes upgrades will
often behave differently after an update. Also,
there are not many cases where you receive
a complete specification that documents all the
changes/operations a given application will cause
to your instances;
• Most of the open-source stack will often rely on
scripts that run other applications for upgrade,
backup and synchronization (curl, wget, git, cc,
g++, awk, diff, etc.);
• Last but not least, rule-based systems are hard to
maintain and often fall behind of the number of
changes that affect your cloud infrastructure.
As such, heuristic and statistical methods are always
welcomed as an additional security layer, since they
are low-maintenance and, if implemented properly,
are able to scale with your infrastructure.
We propose a different approach to cloud-based
anomaly detection in running processes: (a) en-
rich the data with labels, (b) automatically analyze
the labels to establish their importance and assign
weights and (c) score events and instances using these
weights.
140
Boros, T., Cotaie, A., Vikramjeet, K., Malik, V., Park, L. and Pachis, N.
A Principled Approach to Enriching Security-related Data for Running Processes through Statistics and Natural Language Processing.
DOI: 10.5220/0010381401400147
In Proceedings of the 6th International Conference on Internet of Things, Big Data and Security (IoTBDS 2021), pages 140-147
ISBN: 978-989-758-504-3
Copyright
c
2021 by SCITEPRESS – Science and Technology Publications, Lda. All rights reserved

This type strategy has several advantages:
• Reduces the effects of data sparsity and allows
training of simple models using a small amount
of data, without overfitting - see section 4;
• Enables the macro-level analysis for a specific in-
stance, instead of triggering alerts for individual
events, that are often not informative. Usually,
a security compromise will trigger multiple alerts
whenever probing and lateral movement attempts
start. Macro-level analysis makes it easy to spot
spikes in alerts. Instances that are likely to be
affected by the intrusion are the ones interlinked
with the breached instance. This means that you
can also benefit from grouping together instances
that are dependent (we call them “accounts”), but
it is not mandatory to do so;
• Makes it easier for security analysts to go over the
alerts and see what triggered by looking at the la-
bels.
2 RELATED WORK
Machine learning applied in the field of security has
received a growing interest in recent years. Some in-
teresting contributions include behavioral based anal-
ysis of malware, high-level feature generation using
various deep learning methods (e.g. vector quantiza-
tion), intrusion detection systems, malware signature
generation and many others (Noor et al., 2019; Zhou
et al., 2020; Gomathi et al., 2020; Das et al., 2020;
Gibert et al., 2020; Piplai et al., 2020).
When it comes to SIEM-based solutions, static
rules and machine learning (ML) for anomaly detec-
tion are used as a primary filtering and alerting mech-
anism. Their application is narrowed to specific use-
cases. For instance, (Anumol, 2015) introduce a sta-
tistical ML model for intrusion detection based on
network logs, while (Shi et al., 2018) uses deep learn-
ing to predict if a domain is malicious or not. (Feng
et al., 2017) present a ML user-centred model de-
signed to reduce the number of false positive alerts
generated by static rules.
Based on the number of research papers (Idham-
mad et al., 2018; Suresh and Anitha, 2011; Zekri
et al., 2017; Osanaiye et al., 2016), Distributed De-
nial of Service (DDoS) was given significantly more
attention, probably because the successful execution
of these types of attacks yields in major service out-
ages. However, neither of them addressed the issue
of finding and uncovering indicators of compromise
which can firmly tell that a system was compromised
with attacker having control of the same.
The work of (Hendler et al., 2018) is related to our
own research. However, there are several major dif-
ferences: the authors target PowerShell activity with
their focus being on command-line activity only, and
not other attributes of the event using a purely super-
vised approach.
Also, it is important to note that we focus on ag-
gregating risk scores at instance level, instead of alert-
ing on every single anomaly. A similar effort is de-
scribed by (Bryant and Saiedian, 2020). They propose
adding metadata to cyber kill chain that following a
divide and conquer approach to different kinds of sys-
tem activities and their combinations. On the other
hand, a leading SIEM vendor in risk based alerting
(RBA) space tries to take it a step further by mon-
itoring system activity by combining multiple data
sources to look across the board
1
. This increases the
likelihood of catching anomalous activity, be it opera-
tional or an actual security threat. But these solutions
again don’t solve the problem of static rules and con-
stant intervention by the security analysts to maintain
them.
3 DATASET DESCRIPTION
The data involved in the research can generically be
described as host activity data, where by host we un-
derstand an individual computing resource. In our
case, the computing resources are virtual machines in
the public cloud, which are equipped with a software
agent called Hubble
2
. The role of the agent is to col-
lect information from the computing instance and to
send it to a centralized log management solution. The
agent collects data like: recorded users, command line
history, outbound connections, processes being exe-
cuted, environment variables, critical files modified
and so on.
The work presented in this paper uses the data ex-
tracted by Hubble for running processes. The main
three categories (source types) of events are: (a) run-
ning processes; (b) running processes listening for
network connections; (c) running processes with es-
tablished outbound network connections;
The later two mentioned source-type overlap with
the first one, but they provide additional information
as: source port/IP, destination, listening port.
For clarity, we will enumerate all the fields present
in the meta-data associated with running processes:
1
https://conf.splunk.com/files/2019/slides/SEC1803.pdf
- Last Accessed 2020-10-31.
2
https://hubblestack.io/
A Principled Approach to Enriching Security-related Data for Running Processes through Statistics and Natural Language Processing
141

• Account ID: the account from where the data is
collected (this was mentioned in the introduction);
• Cloud Instance ID: unique identifier of the com-
puting resource;
• Parent Process Name: the service/binary process
that generated the event (apache, bash, jupyter
and so on);
• Process Name: the main utility used for the exe-
cution of the command (bash, php, mysql and so
on);
• User: the local user account under which the
parent process is already running (and with what
privileges);
• Group: the local group to which the User is allo-
cated;
• Command Line: the full execution of the pro-
cess with all involved parameters or additional
services;
• Environment Variables: system and user vari-
ables associated with the event and user;
• Open Files: threads associated with the execu-
tion of the process (files that the process reads or
writes);
• Path: the logic location on the disk from where
the process is being executed;
• Time: a timestamp of the moment when that
event was generated (when the process was exe-
cuted).
Each account generates an unique subset of data de-
pendent on the services it provides. Also, each ac-
count has a different number of computing resources
associated and a different computing load. Because of
these factors, the data generated by an account over a
period of time differs from the others. Some accounts
are highly active and can generate up to dozens of mil-
lions of events in a two hour time frame, while others
can generate just tens of thousands of events. In or-
der to preserve this uniqueness, we treat each account
separately but with an identical processing pipeline.
Also, due to technical limitations, we aggregate
the data before we process it. For aggregation we
use all the fields mentioned before, except the time
field, which is replaced with a count value. This way,
we extract only the unique events themselves with an
associated number of occurrences. By doing so, we
limit the data generated by one account to a maximum
of a couple of hundred thousands of observations for
every two hour interval.
4 PROPOSED METHODOLOGY
While some anomalies can be caught by purely statis-
tical approaches, it is often the case where data spar-
sity makes it difficult to spot outliers. This is a specific
trait of text-based data and because we are dealing
with command-lines, our dataset partially falls into
this category.
Our methodology (see Figure 1)
3
overcomes this
by adding a description layer to raw data examples in
the form of tags. The role of these tags is two-fold:
(a) bring domain-specific knowledge inspired by the
way security analysts perform their investigation and
(b) reduce data sparsity.
In what follows, we will describe our tagging
strategy (Section 4.1), introduce two methods for
scoring the events (one supervised and one unsuper-
vised) (Section 4.2) and validate our approach (Sec-
tion 5)
4.1 Describing Events using Tags
As security experts, whenever we analyse an event or
a series of events, we don’t blindly go head-on and
check every possible anomaly. Instead, we look for
specific indications of compromises such as particu-
lar commands (e.g. “netcat”, “telnet”, “useradd”) or
system users (“www-data”, “mysql” etc.) running ab-
normal commands.
The tags we generate are meant to highlight some
particular behaviors of compromised applications. In-
deed, they are not straight-forward indications of ma-
licious activity but when combined they are able out-
line some suspicious events that are potential candi-
dates for further analysis.
For clarity, we will detail each individual tag or
tagset:
• FIRST TIME SEEN ANOMALY: a tag ap-
plied to newly observed command-lines, based on
historical records. This tag is applied after the
cleanup process (see below note for clarification);
• RARE OUTBOUND CONNECTION: is ap-
plied if a process generates an outbound connec-
tion to a host that appears in less than 1% of the
data;
• RARE LISTENING PORT: is applied for a
process that opens a listening port and, based on
past observations, that listening port is used in less
than 1% of the data;
3
The distinction between malicious/benign examples
only apply for the supervised part - see section 4.2.2 for
details.
IoTBDS 2021 - 6th International Conference on Internet of Things, Big Data and Security
142
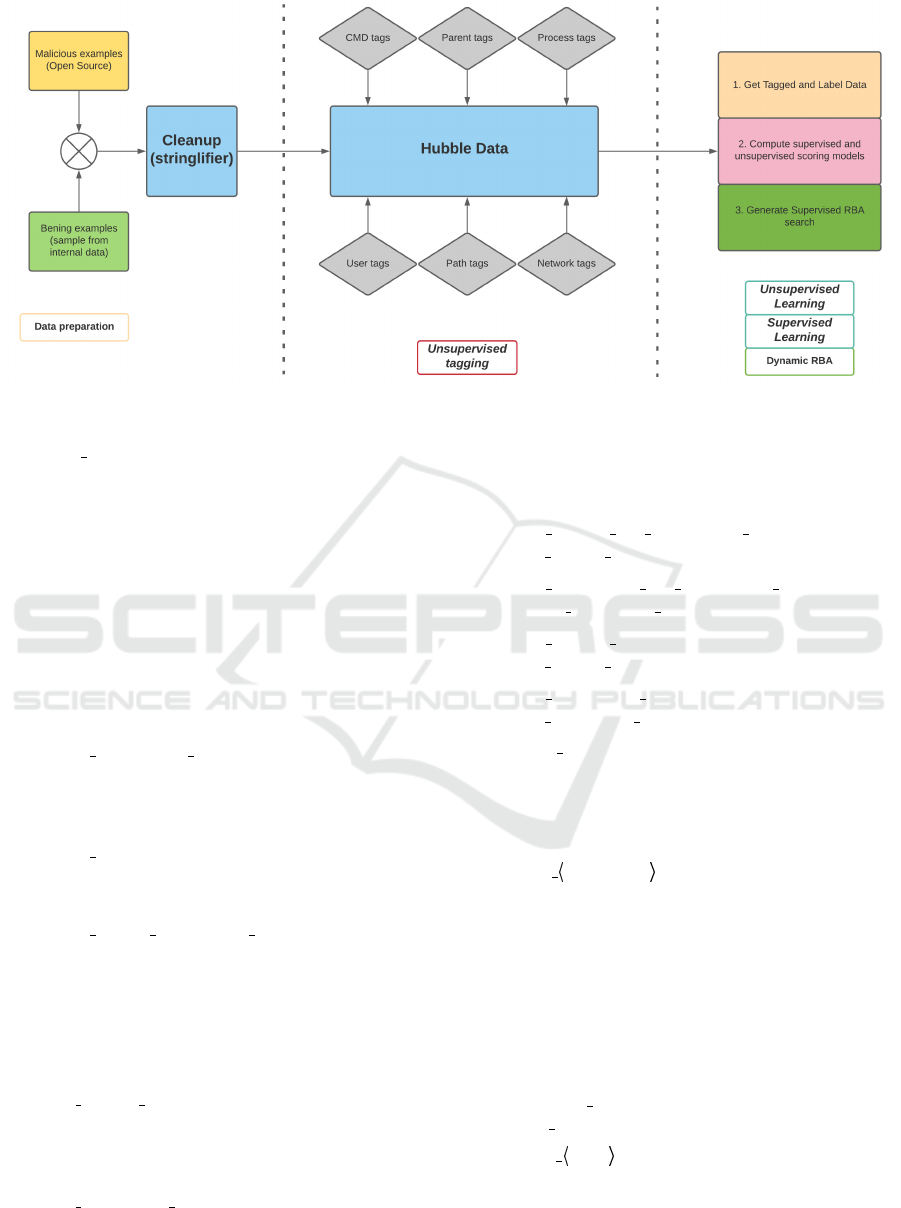
Figure 1: Overview of our proposed methodology.
• CMD ENTROPY: this tagset is based on the per-
plexity of the command-line, which is computed
using a tri-gram language model (LM) with sim-
ple interpolation smoothing. We also use corpora-
wide statistics for perplexity (µ and σ) to generate
three flavours of this tag:
MEDIUM: if perplexity is between (µ +
σ,µ + 2σ)
HIGH: if perplexity is between (µ + 2σ,µ +
4σ)
EXTREME: if perplexity is larger than µ +
4σ
• RARE PROCESS PATH: the presence of this
tag signifies that the process is launched from an
atypical location - less than 1% of the instances of
this process are executed from this location;
• RARE PARENT: based on the process tree, this
process has had the given parent process in less
than 1% of the observations;
• RARE USER PROCESS PAIR: the specific
user has executed the current process in less than
1% of the observations. This only applies for
a specific list of known system users: “mysql”,
“root”, “www-data”, “postgresql”, “ldap” etc.
Any manually added user instance will never trig-
ger this tag.
• ENV RARE PATH: this tag is set whenever the
PAT H environment variable has a combination of
values which is not frequent. In this case we use a
absolute threshold value of 5;
• ENV MISSING PATH: this tag is set if the
PAT H variable is empty or missing for a specific
process. The tag is only triggered if, for that spe-
cific process, based on past observations, the vari-
able was present and non-empty in more than 95%
of the cases;
• ENV RARE LD LIBRARY PATH: analog to
ENV RARE PATH;
• ENV MISSING LD LIBRARY PATH: analog
to ENV MISSING PATH;
• ENV RARE PWD: analog to
ENV RARE PATH;
• ENV MISSING PWD: analog to
ENV MISSING PATH;
• USER CMD: this tag is set if the user that
launched a command is not in our list of known
system users. This might not be entirely accurate,
since we maintain this list manually, but it holds
in most of the cases;
• CMD command : this is a multipur-
pose tag used in conjunctions with a list of
applications/command-line tools that we chose
to track. This list includes most command-line-
interface (CLI) UNIX/Linux tools (wget, curl, nc,
telnet, ssh, useradd, usermod, groupadd etc.) and
some additional non-standard packages. This tag
is dynamically generated whenever we encounter
one of the target CLI commands. For instance,
when we see a curl command, we automatically
add CMD CURL, when we see a pwd we add
CMD PWD and so on.
• PATH path : this is also a multipurpose tag,
based on a defined list on interesting system paths
that might appear inside the text body of an ex-
ecuted command. Example of such paths are:
/dev/mem, /dev/tcp, /dev/kmem, /etc/hostname,
A Principled Approach to Enriching Security-related Data for Running Processes through Statistics and Natural Language Processing
143

/etc/ssh/sshd* and so on. The scope of such tags
is to highlight activity that might indicate man-
ual manipulation of system files or services. For
example, an user can initiate an outbound connec-
tion from the host without using the standard util-
ities like wget or curl, but by using such utilities
like:
bash − i>&
/dev/tcp/attacker ip/at tacker port0>&1.
• PARENT parent name : the purpose of this
tag is to highlight events which are being executed
by interesting parents, from a security point of
view. Parent processes like apache, nginx, httpd,
cupsd, mysqld and so on are on their own rare
events and can highlight abuse of that particular
process or service. Such tags bring more context
and correlations to the tag analysis phase.
• IP PUBLIC\IP PRIVATE: this tag is attributed
in two cases. First, the event is generated by a
process which establishes an outbound connection
and we have information regarding the destination
IP. Second, the command line itself contains one
or multiple character sequences representing IPs.
Once all IPs are extracted they are classified as
PUBLIC or PRIVATE IPs. Such information is
highly useful in classifying what kind or activity
is a processes behaving.
• REF LOCALHOST: tag highlights events
where the localhost component is referenced.
This can be done by using the localhost syntax in
network connections oriented commands or the
localhost IP itself 127.0.01. Network connections
commands containing only localhost without
other IP tags (especially IP PUBLIC tag) should
have a smaller impact in a decision process.
• PROCESS APPEARS LESS THAN 5 TIMES:
this tag is highly depended on the cloud environ-
ment for which the tag is generated. Its purpose
is to inform on processes that occurs very rare
(few times seen). Such a tag can have a short
life, if the process itself becomes a common
component of the environment. But in case of a
malicious event, skilled attackers can use system
utilities (which aren’t commonly executed) reach
their goals. Such a tag can filter down new and
interesting events recently reported.
NOTE. For the LM and the FIRST TIME SEEN tags
we use a pre-processing step in which all command-
lines are stripped of numbers and random character
sequences. This is done by passing them through a
tool called Stringlifier
4
, which is an open-source ML
4
https://github.com/adobe/stringlifier
model that identifies high-entropy strings (passwords,
hashes, API keys) as well as strings that follow spe-
cific patterns (e.g. IP addresses).
For events labelling, we look at various event data
fields and generate tags as per inherit characteristics
of those fields. Tags capture certain facets of the event
or log, which are important in terms of security in-
cident detection point of view. One of the common
tags generated is FIRST T IME SEEN ANOMALY
when command in an anomalous event is seen first
time for particular account. Another tag USER CMD
accounts for commands that are executed explicitly
by users on production instances. Similarly, tags are
generated for user commands executed on instances.
Certain tags accounts for environment variable abnor-
mality. Tags are also generated for network related ar-
tifacts. For example, the IP PUBLIC or IP PRIVATE
tags describe the type of the destination resource
for that network connection (local network or pub-
lic/internet). Tags like REF LOCALHOST describe
processes that connect via network protocols to other
services available on the same computing machine
hosting the processes (ex: 127.0.0.1 or localhost).
4.2 Risk based Scoring
As tags are not direct indicators of compromise, the
role of risk-based scoring (RBS) is to highlight sus-
pect activity by jointly analysing the assigned la-
bels. For simplicity, we define our scoring method as
a linear function between the input features (combina-
tions of labels/tags) with a scalar output. The primary
goal is to assign high scores to suspicious activity and
low scores to normal operations.
There are two main ways to compute the scoring
model: supervised learning and unsupervised learn-
ing. Both methods have their merits and demerits. For
instance, unsupervised learning is likely to perform
worse on this dataset than its supervised counterpart.
On the other hand, supervised learning requires la-
beled data, which is not easy to come. Furthermore,
the bias of this training data is likely to also bias the
model.
This is why we will analyze both approaches in
the following sections and compare the results.
4.2.1 Unsupervised Scoring
Customary, Term Frequency Inverse Document Fre-
quency (TF-IDF) has been used to analyze observa-
tions based on associated tags/words. In our case,
tags are unique per observation, thus there is a strong
correlation between the term frequency and inverse
document frequency, rendering TF-IDF not an good
IoTBDS 2021 - 6th International Conference on Internet of Things, Big Data and Security
144

Table 1: Converting set to N-grams.
Set
(CMD CP, RARE PARENT,
USER CMD)
Unigrams
(CMD CP),
(RARE PARENT),
(USER CMD)
Bigrams
(CMD CP, RARE PARENT),
(CMD CP, USER CMD),
(RARE PARENT, USER CMD)
Trigrams
(CMD CP, RARE PARENT,
USER CMD)
Table 2: Example of N-grams and their probabilities.
Probability N-Grams
0.001958
ENV RARE PWD
PARENT SSHD
0.176561 RARE USER PROCESS PAIR
0.015053 RARE PARENT
0.000012
CMD EXTREME ENTROPY
CMD PS
PARENT PYTHON
candidate for our goal. Instead, we focus on two un-
supervised methodologies for detecting correlations
between tags and assigning scores: a probabilistic n-
gram approach and frequent itemset mining.
Probabilistic N-gram Approach. In this method, the
event’s tags are arranged into unique combinations of
tags to represent unigrams, bigrams and trigrams, as
shown in Table 1. The occurrence frequency of a spe-
cific n-gram provides an idea about how often the tags
in n-gram are expected to appear together. We also
expect that frequent n-grams are correlated with nor-
mal operations, while rare n-grams are related to what
can be considered anomalous events (see Table 2 for
examples). Thus, our scoring procedure is defined
as follows: (a) compute n-gram probabilities (we use
maximum likelihood estimates); (b) assign a “rarity
score” for each n-gram computed as the negative log
likelihood of that n-gram appearing. If G
k
is the set
of all n-gram combinations for event E
k
and P
t
is the
probability of observing tag t, than the RBA score for
E
k
is defined by Equation 1
RBA
E
k
= −
∑
t∈G
k
logP
t
(1)
Frequent Itemset Mining. A common use case of
Frequent Itemset Mining involves identifying rela-
tions among items purchased by shoppers, and gen-
erating association rules to better understand buying
behaviors and provide better incentives. Similarly, in
our use case we can derive associations among tags
and their frequency by using the Apriori Algorithm
(Agarwal et al., 1994). Table 3 shows support score
of tags generated using this approach.
Table 3: Example of frequent itemsets and support.
Support Itemsets
0.016336
ENV RARE PWD
PARENT SSHD
0.449426 RARE USER PROCESS PAIR
0.039277 RARE PARENT
0.000347
CMD EXTREME ENTROPY
CMD PS
PARENT PYTHON
Similar to the probabilistic n-gram model, we use
the negative logarithm of the support value in our
scoring.
4.2.2 Supervised Scoring
The dataset used for supervised scoring is composed
on 10K benign events (collected for our own logs) and
245 malicious command-lines extracted from open
data-sources. For training/testing we split the data
into two subsets, while carefully preserving the ratio
between malicious and benign examples. 70% of the
data was used for training and 30% for testing.
Our scoring model is a single layer perceptron
with sparse input. For computational efficiency, in-
stead of performing n-hot encoding and sparse ma-
trix multiplications, we preferred to link each feature
to the weight it would normally trigger in the per-
ceptron model. This way, the output activation for
a given example input is computed by summing over
the weights of the non-zero (present) features in that
particular example. This is similar to the probabilis-
tic n-gram approach, but instead of using the negative
log-likelihood for an n-gram we now use a precom-
puted weight.
To train our model, we initialized our feature
weights with zeros (this is a linear model) and we used
the delta-rule update (Equations 2 and 3).
y
E
k
=
∑
t∈G
k
w
t
(2)
∆w
t
= η · (t
E
k
− y
E
k
) (3)
where G
k
has the same meaning as before, y
E
k
is the
predicted output for example E
k
, t
E
k
is the desired out-
put for that examples and η is the learning rate
5
.
Note 1. While both unsupervised methods generate
scores for unigrams, we don’t use this type of feature
in our scoring, because, as stated earlier, tags out of
context are not informative enough to provide the nec-
essary support for deciding if an event is malicious or
not.
5
We used a learning rate of 1e − 4.
A Principled Approach to Enriching Security-related Data for Running Processes through Statistics and Natural Language Processing
145

Note 2. In the training phase of the unsupervised
methods we only use the benign dataset, because
adding malicious examples in the mix would prone
the model to consider them non-anomalies at runtime.
Note 3. The supervised and unsupervised methods
generate scores for known tag combinations. How-
ever, there are always situations where the algorithm
can encounter previously unseen tag combinations
during runtime. We observed that best results are ob-
tained by scoring this special class of rare events with
a constant value
6
.
5 EXPERIMENTAL VALIDATION
We validate our approach using an artificially con-
structed dataset, which was assembled through a sim-
ilar strategy as the one presented in Section 4.2.2. We
note that the manually introduced malicious events
have not been previously used in training the super-
vised scoring function.
Ideally, we would prefer that the risk score would
highlight malicious events by assigning high values
to them. As such, we use a linear and an exponen-
tial decay function for evaluating both the supervised
and unsupervised scoring methods. Alternatively, we
could use the F-score computed on a limited number
of events. However, we feel that hard limits such as
top k events or score thresholds don’t fully character-
ize the system, since their choice can yield high recall
values by generating large and unmanageable num-
bers of events.
Let e
k
be one malicious event with score s
k
and
b
k
the number of benign events that have a score
s
i
>s
k
. Then, our linear decay function (L) is defined
by Equation 4 and our exponential (E) decay function
by Equation 5.
L
e
k
=
1
1 + 2 · b
k
(4)
E
e
k
=
1
2
b
k
(5)
The model is characterized by the average scores over
all malicious events (
1
m
∑
m
k=1
L
e
k
and
1
m
∑
m
k=1
E
e
k
, re-
spectively).
Note. Benign examples are not explicitly modeled
in our evaluation, because they are used in scoring
of the malicious events, which makes them indirect
participants to the overall accuracy.
Table 4 shows the results for all the presented models,
using both evaluation metrics.
6
Our models are evaluated using a heuristically obtained
value of −log(10
−8
).
Table 4: Model evaluation using linear and exponential de-
cay scoring.
Method Linear Exponential
Supervised Delta 0.9470 0.9461
Itemset Mining 0.6255 0.5962
N-Grams 0.5033 0.4798
6 CONCLUSIONS AND FUTURE
WORK
We introduced a methodology of reducing data spar-
sity and introducing domain-specific knowledge at the
same time, into security related application logs. We
explored both supervised and unsupervised methods
of performing risk-based-scoring and we evaluated
our methods using an artificially created dataset.
The results show the obvious: supervised score
generation works better than unsupervised methods
(at least for this type of data). However, we do ar-
gue that it is not always possible to collect or gener-
ate labeled data, hence both methods bring their own
value.
A potential use case for unsupervised methods is
to highlight operational hygiene issues for a specific
cloud account. If an environment follows operational
and security best practices the number and the diver-
sity of anomalous events would be uniform. An un-
supervised approach could highlight deviation from
such expectations.
We further plan to extend this methodology by
adding more types of labels and introduce additional
types of data. Extending our research on the unsuper-
vised and supervised scoring methods is also on our
road-map.
REFERENCES
Agarwal, R., Srikant, R., et al. (1994). Fast algorithms for
mining association rules. In Proc. of the 20th VLDB
Conference, pages 487–499.
Anumol, E. (2015). Use of machine learning algorithms
with siem for attack prediction. In Intelligent Com-
puting, Communication and Devices, pages 231–235.
Springer.
Bryant, B. and Saiedian, H. (2020). Improving siem alert
metadata aggregation with a novel kill-chain based
classification model. Computers & Security, page
101817.
Das, S., Ashrafuzzaman, M., Sheldon, F. T., and Shiva, S.
(2020). Network intrusion detection using natural lan-
guage processing and ensemble machine learning. In
2020 IEEE Symposium Series on Computational In-
telligence (SSCI), pages 829–835. IEEE.
IoTBDS 2021 - 6th International Conference on Internet of Things, Big Data and Security
146

Feng, C., Wu, S., and Liu, N. (2017). A user-centric ma-
chine learning framework for cyber security opera-
tions center. In 2017 IEEE International Conference
on Intelligence and Security Informatics (ISI), pages
173–175. IEEE.
Gibert, D., Mateu, C., and Planes, J. (2020). The rise of
machine learning for detection and classification of
malware: Research developments, trends and chal-
lenges. Journal of Network and Computer Applica-
tions, 153:102526.
Gomathi, S., Parmar, N., Devi, J., and Patel, N. (2020). De-
tecting malware attack on cloud using deep learning
vector quantization. In 2020 12th International Con-
ference on Computational Intelligence and Communi-
cation Networks (CICN), pages 356–361. IEEE.
Hendler, D., Kels, S., and Rubin, A. (2018). Detecting ma-
licious powershell commands using deep neural net-
works. In Proceedings of the 2018 on Asia Con-
ference on Computer and Communications Security,
pages 187–197.
Idhammad, M., Afdel, K., and Belouch, M. (2018). Semi-
supervised machine learning approach for ddos detec-
tion. Applied Intelligence, 48(10):3193–3208.
Noor, U., Anwar, Z., Amjad, T., and Choo, K.-K. R. (2019).
A machine learning-based fintech cyber threat attribu-
tion framework using high-level indicators of compro-
mise. Future Generation Computer Systems, 96:227–
242.
Osanaiye, O., Cai, H., Choo, K.-K. R., Dehghantanha,
A., Xu, Z., and Dlodlo, M. (2016). Ensemble-based
multi-filter feature selection method for ddos detec-
tion in cloud computing. EURASIP Journal on Wire-
less Communications and Networking, 2016(1):130.
Piplai, A., Mittal, S., Abdelsalam, M., Gupta, M., Joshi,
A., and Finin, T. (2020). Knowledge enrichment by
fusing representations for malware threat intelligence
and behavior. In 2020 IEEE International Conference
on Intelligence and Security Informatics (ISI), pages
1–6. IEEE.
Shi, Y., Chen, G., and Li, J. (2018). Malicious domain name
detection based on extreme machine learning. Neural
Processing Letters, 48(3):1347–1357.
Suresh, M. and Anitha, R. (2011). Evaluating machine
learning algorithms for detecting ddos attacks. In In-
ternational Conference on Network Security and Ap-
plications, pages 441–452. Springer.
Zekri, M., El Kafhali, S., Aboutabit, N., and Saadi, Y.
(2017). Ddos attack detection using machine learn-
ing techniques in cloud computing environments. In
2017 3rd International Conference of Cloud Comput-
ing Technologies and Applications (CloudTech), pages
1–7. IEEE.
Zhou, H., Hu, Y., Yang, X., Pan, H., Guo, W., and Zou,
C. C. (2020). A worm detection system based on deep
learning. IEEE Access, 8:205444–205454.
A Principled Approach to Enriching Security-related Data for Running Processes through Statistics and Natural Language Processing
147
