
Advanced Car Driving Assistant System: A Deep Non-local Pipeline
Combined with 1D Dilated CNN for Safety Driving
Francesco Rundo
1
, Roberto Leotta
2
, Francesca Trenta
2
, Giovanni Bellitto
3
,
Federica Proietto Salanitri
3
, Vincenzo Piuri
4
, Angelo Genovese
4
, Ruggero Donida Labati
4
,
Fabio Scotti
4
, Concetto Spampinato
3
and Sebastiano Battiato
2
1
STMicroelectronics, ADG Central R&D, Italy
2
University of Catania, IPLAB Group, Italy
3
University of Catania, PerCeiVe Lab, Italy
4
University of Milan, Computer Science Department, Italy
Keywords:
Drowsiness, Deep Learning, D-CNN, Deep-LSTM, PPG (PhotoPlethysmoGraphy).
Abstract:
Visual saliency refers to the part of the visual scene in which the subject’s gaze is focused, allowing significant
applications in various fields including automotive. Indeed, the car driver decides to focus on specific objects
rather than others by deterministic brain-driven saliency mechanisms inherent perceptual activity. In the au-
tomotive industry, vision saliency estimation is one of the most common technologies in Advanced Driver
Assistant Systems (ADAS). In this work, we proposed an intelligent system consisting of: (1) an ad-hoc
Non-Local Semantic Segmentation Deep Network to process the frames captured by automotive-grade cam-
era device placed outside the car, (2) an innovative bio-sensor to perform car driver PhotoPlethysmoGraphy
(PPG) signal sampling for monitoring related drowsiness and, (3) ad-hoc designed 1D Temporal Deep Convo-
lutional Network designed to classify the so collected PPG time-series providing an assessment of the driver
attention level. A downstream check-block verifies if the car driver attention level is adequate for the saliency-
based scene classification. Our approach is extensively evaluated on DH1FK dataset, and experimental results
show the effectiveness of the proposed pipeline.
1 INTRODUCTION
The term ”drowsiness” indicates a state characterized
by a low level of awareness and difficulty in main-
taining the wakeful state. Driver’s drowsiness may
cause serious road traffic accidents involving vehi-
cles. In the automotive field, the ability of detect-
ing an attention state of a driver may facilitate eval-
uation of his/her fitness to drive a vehicle, preventing
road accidents. In this respect, several studies have
highlighted the correlation between the level of at-
tention and Heart Rate Variability (HRV) of a subject
(Igasaki et al., 2015). HRV is a measure of heart ac-
tivity over beat-to-beat interval. Indeed, estimating
HRV of a driver may permit to obtain useful infor-
mation concerning possible drowsiness (Igasaki et al.,
2015). Specifically, HRV reflects the heartbeat-to-
beat interval that results mainly from the dynamic in-
teraction between the Autonomous Nervous System
and the heart (Igasaki et al., 2015; Cai et al., 2017;
Winterlich et al., 2013). However, the driver’s atten-
tion level must be adequate for the driving scenario.
For instance, driving with low traffic and low speed
requires a lower level of attention than a driving sce-
nario that includes risky maneuvers (overtaking, lane
changes, etc.) and at high speeds. Within this per-
spective, we propose an algorithm based on salience
analysis to understand the driving scenario in order
to adjust the monitoring of the attention level accord-
ingly. Saliency Detection is a method to identify the
most outstanding and informative parts in a video or
still image. It has been widely studied in such dif-
ferent kind of applications including automotive (Cai
et al., 2017; Winterlich et al., 2013). The proposed
work will show how the saliency analysis is able to
improve the robustness of the implemented car driver
drowsiness pipeline. The paper is organized as fol-
lows. Section 2 reports a brief introduction on the re-
lated works. In Section 3, we provide details about the
used hardware framework to acquire the PPG signal
along with the related processing pipeline. In Section
4, we described our innovativeDeep learning pipeline
Rundo, F., Leotta, R., Trenta, F., Bellitto, G., Salanitri, F., Piuri, V., Genovese, A., Labati, R., Scotti, F., Spampinato, C. and Battiato, S.
Advanced Car Driving Assistant System: A Deep Non-local Pipeline Combined with 1D Dilated CNN for Safety Driving.
DOI: 10.5220/0010381000810090
In Proceedings of the International Conference on Image Processing and Vision Engineering (IMPROVE 2021), pages 81-90
ISBN: 978-989-758-511-1
Copyright
c
2021 by SCITEPRESS – Science and Technology Publications, Lda. All rights reserved
81
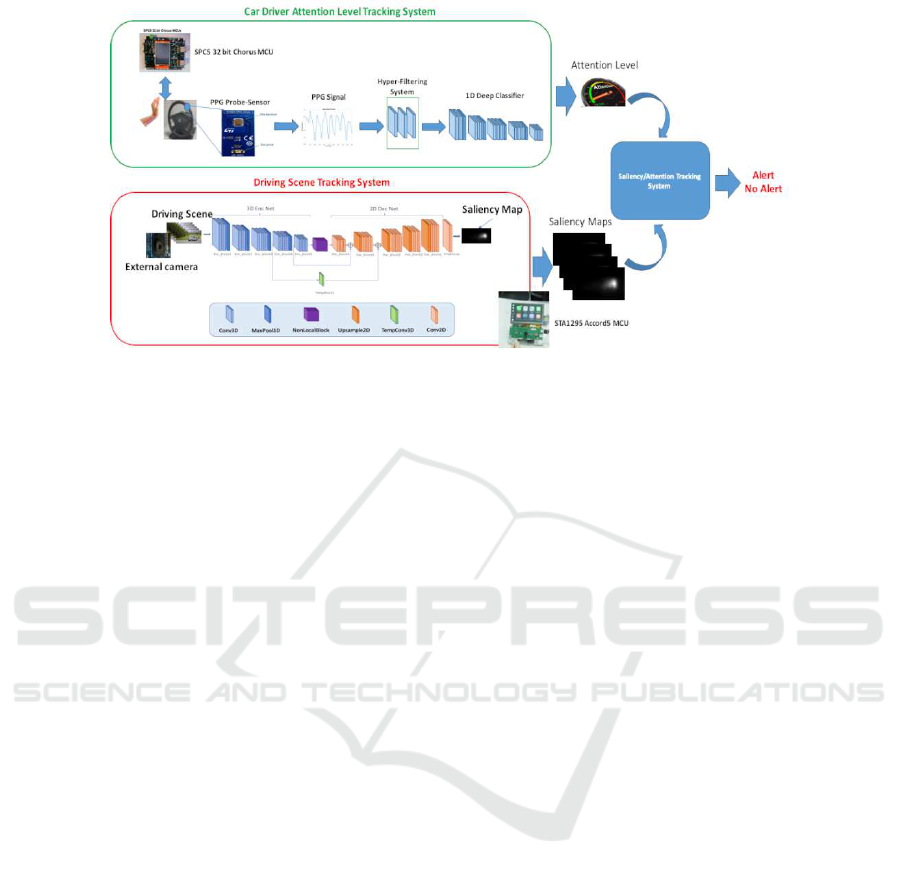
Figure 1: The overall scheme of the proposed pipeline.
to evaluate the car driver’s drowsiness alongside the
driving scenario. Finally, experimental results and fu-
ture works are reported in Section 5.
2 RELATED WORKS
In this section, we summarize previous approaches on
evaluating car-driver attention level as well as driving
scene understanding. In (Vicente et al., 2011), the au-
thors introduced an innovative pipeline for monitoring
a car driver’s drowsinessanalyzing the ElectroCardio-
Graphy (ECG) signal alterations analysis, which may
introduce noise and artifacts while measuring HRV.
Indeed, they proposed a pipeline to perform ECG sig-
nal stabilization and classification based on classical
linear discriminant analysis. In (Szypulska and Pi-
otrowski, 2012), the authors proposed a reliable ap-
proach for detecting fatigue and sleep onset. Specifi-
cally, the authors showed a method to discriminate ac-
tivity, drowsiness, and sleep, taking into account the
LF/HF ratio detected over the R-R tachogram com-
puted from the ECG frequency analysis. The re-
sults obtained are promising and can be used to de-
velop a drowsiness detection system for ADAS ap-
plications. In (Fujiwara et al., 2018), the authors an-
alyzed specific changes in sleep condition by using
the HRV signal. The authors proposed eight hand-
crafted HRV signal features to be processed using a
multivariate statistical process framework for detect-
ing specific HRV dynamics. The results showed the
effectiveness of the proposed method through stan-
dard confirmation based on usage of the ElectroEn-
cephaloGraphy signal (EEG). Generally, existing ap-
proaches based on HRV detection propose invasive
ECG sampling. In particular, it is necessary to have
at least three electrodes in contact with the human
skin according to the minimum configuration known
as Einthoven’s Triangle (Abi-Saleh and Omar, 2019).
Both car driver’s hands must remain on the steering
wheel where the two electrodes of the ECG signal
sampling system are usually placed. Then, the third
electrode is placed on the driver’s seat. This require-
ment raises a specific well-known issue related to the
robustness of the ECG signal sampling system in au-
tomotive applications (Abi-Saleh and Omar, 2019).
For this reason, many authors have proposed meth-
ods based on the PhotoPlethysmGraphy (PPG) sig-
nal analysis rather than on the ECG. In (Rundo et al.,
2018b), the authors presented a solution for evaluat-
ing the HRV from the PPG signal to analyze parasym-
pathetic nervous activity and classify the subject’s
drowsiness level. The obtained results confirmed the
robustness of the proposed approach based on apply-
ing a low-power PPG probe. In (Rundo et al., 2018b;
Rundo et al., 2018c), the authors proposed an inter-
esting indicator from the PPG signal, which has been
analyzed. In (Xu et al., 2012; Kurian et al., 2014),
the authors implemented effective algorithms based
on PRV (Pulse Rate Variability) data processing as
a measure of the ANS and then the drowsiness of
the subject. An interesting approach has been pro-
posed in (Ryu et al., 2018) in which the authors pro-
jected a flexible sensor array composed of red organic
light-emitting diodes (OLEDs) and organic photodi-
odes (OPDs) for detection of photoplethysmographic
(PPG) signal. The reported test benchmarks in (Ryu
et al., 2018) confirmed that the proposed flexible PPG
sensor estimates the drowsiness with high accuracy
concerning the classical PPG probe. Over the last
years, researchers have investigated the use of Deep
Learning in order to estimate the drowsiness of a sub-
ject from bio-signals and imaging. In (Hong and
IMPROVE 2021 - International Conference on Image Processing and Vision Engineering
82
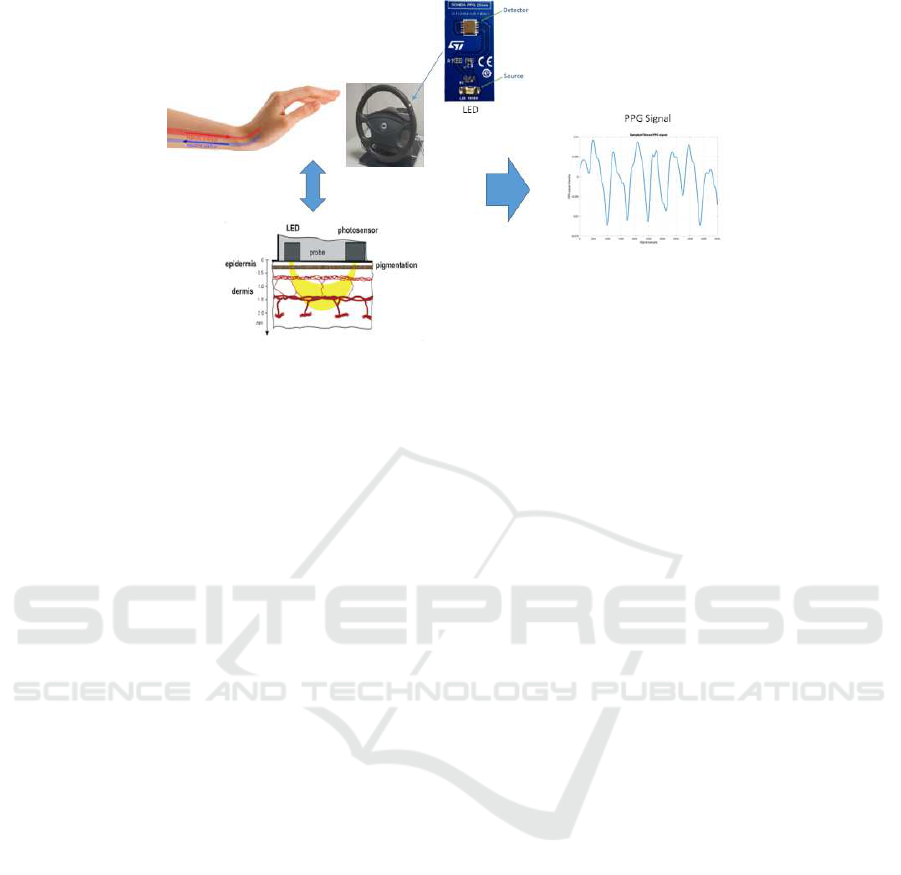
Figure 2: The PPG pattern formation scheme.
Qin, 2007; Alshaqaqi et al., 2013), the authors pro-
posed effective pipelines in order to estimate the car-
driver drowsiness by examining the ”eye state” of
the driver through applying such image processing
methods. However, the main issues of the proposed
solutions involve the quality of video frames. In-
deed, the effectivenessof these approachesmay be af-
fected by environmental conditions (illumination, oc-
clusions, etc.) of the passenger compartment. As in-
troduced, recent Deep learning advances in automo-
tive applications allow such innovation in the field of
the Drowsiness Detection system as confirmed by the
pipeline proposed in (Sari and Huang, 2016). In (Sari
and Huang, 2016), the authors presented an intelli-
gent algorithm consisting of the wavelet packet trans-
form (WPT) and a functional-link-based fuzzy neural
network (FLFNN) to provide early detection of car-
driver drowsiness. The drowsiness analysis is based
on the HF/LF analysis (Alshaqaqi et al., 2013). A
similar approach was proposed in (Cheon and Kang,
2017), where a Support Vector Machine (SVM) ap-
proach has been successfully applied to classify the
car-driver physiological data coming from an array
of bio-sensors placed over the steering wheel. An-
other promising approach is (Choi et al., 2018) in
which the authors designed a system based on Mul-
timodal Deep Learning that recognizes both visual
and physiological changes in the state of attention of
the driver. More specifically, they used a deep learn-
ing framework consisting of Long Short-Term Mem-
ory (LSTM) to classify the driver’s condition based
on both visual and physiological data properly pre-
processed. The results reported in (Choi et al., 2018)
confirmed the robustness of the proposed approach.
In (Altun and Celenk, 2017), the authors introduced
an interesting vision-based driver assistance system
for scene awareness using video saliency analysis.
The results reported that the proposed pipeline was
able to detect how the driver’s gaze was focused dur-
ing driving. In (Deng et al., 2016), the authors col-
lected the eye-tracking data of 40 subjects consisting
of non-drivers and experienced drivers when viewing
100 traffic images. In particular, the authors proposed
a solution to assess the drowsiness level and a moni-
toring system regulatedby the information of the driv-
ing scenario.
3 METHODS AND MATERIALS
This section describes the overall pipeline. The at-
tention level tracking system is described first. Af-
terwards, we introduced a Visual Saliency Scene
pipeline. Finally, we provide details about our im-
plemented ad-hoc Saliency/Attention Tracking Sys-
tem to evaluate the driver’s attention level determined
by the analysis of the car driver PPG signal with the
salience map. The Fig. 1 shows the overall scheme
of the proposed pipeline. The following sections de-
scribe each of the blocks included in the pipeline
shown in Fig. 1.
3.1 The Car Driver Attention Level
Tracking System
This system is based on the usage of PPG signal sam-
pled from the car driver to track the corresponding
attention level. We provide hereinafter a brief intro-
duction to PPG signal. The PPG sampling is a non-
invasive method to monitor cardiovascular dynamic
of a subject. Both heart health as well as respira-
tory rate and vascular disorders may be monitored by
means of ad-hoc analysis of such PPG signal dynamic
Advanced Car Driving Assistant System: A Deep Non-local Pipeline Combined with 1D Dilated CNN for Safety Driving
83
Figure 3: The proposed driver drowsiness monitoring pipeline.
(Rundo et al., 2018b). In few words, by means of ad-
hoc analysis of the PPG signal we are able to collect a
non-invasive measure of the heart activity and blood
volume dynamic. A classical PPG raw waveform is
composed by a pulsatile (‘AC’) physiological signal
which is correlated to cardiac-synchronouschanges in
the blood volume (in sync with heart-beat) superim-
posed with a slowly varying (‘DC’) component con-
taining lower frequency signals which is correlated
to respiration, thermoregulation and skin tissues (in
which the PPG sensor is plugged). For each cardiac
cycle the heart pumps blood to the subject body with
a specific pressure enough to distend the arteries and
arterioles in the subcutaneous tissue. Through a sim-
ple sensing device composed by a light-emitter and
a photo-detector attached over the subject skin, the
blood volume changes can be detected as part of the
PPG dynamic. More in details, the change in volume
caused by the heart pressure pulse can be detected
by illuminating the skin and then by measuring the
amount of back-scattered light either transmitted or
reflected to the photo-detector (Rundo et al., 2018b).
Further information about PPG patter formation and
dynamics are provided in (Rundo et al., 2018b). The
Fig. 2 shows the physiologicalphenomena underlying
PPG waveform(s) formation as previously described.
For the proposed pipeline, the authors implemented
a PPG sensing device composed by a Silicon Photo-
multiplier sensor coupled with a LEDs emitter (Vin-
ciguerra et al., 2018; Mazzillo et al., 2018; Rundo
et al., 2019a; Rundo et al., 2019b).
The proposed PPG sensing probe is composed by
a large area n-on-p Silicon Photomultipliers (SiPMs)
fabricated at STMicroelectronics (Mazzillo et al.,
2018). The used SiPMs array device has a total area of
4.0×4.5 mm
2
and 4871 square microcells with 60µm
pitch. The devices have a geometrical fill factor of
67.4% and are packaged in a surface mount housing
(SMD) with about 5.1× 5.1 mm
2
total area (Fujiwara
et al., 2018). We used a Pixelteq dichroic bandpass
filter with a pass band centered at about 540nm with
a Full Width at Half Maximum (FWHM) of 70nm
and an optical transmission higher than 90− 95% in
the pass band range was glued on the SMD package
by using a Loctite 352TM adhesive. With the dichroic
filter at 3V-OV the SiPM has a maximum detection ef-
ficiency of about 30% at 565nm and a PDE of about
27.5% at 540nm (central wavelength in the filter pass
band). From our studies we obtained that the so im-
plemented dichroic filter reduces the absorption of en-
vironmental light of more than 60% when the detec-
tor works in the linear range in Geiger mode above
its breakdown voltage (∼27V). As described, the
PPG detector needs a light emitter together with the
introduced detector based on SiPM technology. We
have used successfully the OSRAM LT M673 LEDs
in SMD package emitting at 529nm and based on In-
GaN technology (Fujiwara et al., 2018). The used
LEDs devices have an area of 2.3 × 1.5 mm
2
, view-
ing angle of 120
◦
, spectral bandwidth of 33 nm and
lower power emission (mW) in the standard opera-
tion range. The authors to get the PPG probe easily to
use, have designed a printed circuit board (PCB) han-
dled by a user-interface developed over the NI (Na-
tional Instruments) equipment. The PCB is populated
by a 4V portable battery, a power management cir-
cuits, a conditioning circuit for output SiPMs signals,
several USB connectors for PPG probes and related
SMA output connectors. About the used hardware,
more implementation details can be found in (Vin-
ciguerra et al., 2018; Mazzillo et al., 2018; Rundo
et al., 2019a; Rundo et al., 2019b). An implemented
set of PPG sensing probes have been placed in the
steering of the car where statistically it is more likely
IMPROVE 2021 - International Conference on Image Processing and Vision Engineering
84

Table 1: Hyper low-pass filtering setup (in Hz).
F f1 f2 f3 f4 f5 f6 f7 f8 f9 f10 f11
HP 0.5 / / / / / / / / / /
LP 0 1.5 2.2 2.3 3.1 3.9 4.2 4.3 5 5.9 6.9
Table 2: Hyper high-pass filtering setup (in Hz).
F f1 f2 f3 f4 f5 f6 f7 f8 f9 f10 f11
HP 0.5 1.2 3 3.2 3.3 3.9 4.2 4.5 5 5.7 6.9
LP 7 / / / / / / / / / /
that the driver rests his hand. Please note that to sam-
ple the PPG signal a single driver’s hand only (placed
on top of the embedded PPG sensor probe) is needed
in order to trigger the detecting of the physiological
signal. In this way we have covered the first issue
aforementioed and related to the use of the ECG dif-
ficult to be sampled on the car. As showed in Fig. 2,
the proposed PPG sensing probe is embedded in the
car steering. We populated the car steering with dif-
ferent PPG sending devices. More details about the
hardware setup of this solution can be found (Vin-
ciguerra et al., 2018; Mazzillo et al., 2018; Rundo
et al., 2019a). The sampled PPG raw data will be fed
into SP5C Chorus Dual Cortex A7 Microcontrollers
(MCUs) having ad-hocs Analog to Digital Convert-
ers (ADCs) ports. An overall scheme of the proposed
PPG based pipeline is reported Fig. 3 (Rundo et al.,
2019b).
In the following paragraphs the pipeline reported
in Fig. 3 will be detailed. Preliminary, we confirmed
that the PPG waveforms (raw data) of the car driver
will be collected as per scheme reported in Fig. 1.
The sampled raw PPG signal will be furtherly pro-
cessed by the hyper-filtering system (Rundo et al.,
2019b) having the cut-off frequencies reported in Ta-
bles 1, 2. The collected hyper-filtered PPG signal
patterns (Mazzillo et al., 2018) were classified by
ad-hoc designed 1D Temporal Dilated Convolutional
Neural Network as reported in Fig. 3. The main
building block consists of a dilated causal convolu-
tion layer that operates over the time steps of each
sequence. The proposed 1D-CNN includes multi-
ple residual blocks, each containing two sets of di-
lated causal convolution layers with the same dila-
tion factor, followed by normalization, ReLU acti-
vation, and spatial dropout layers. Furthermore, a
1 − by − 1 convolution is applied to adapt the num-
ber of channels between the input and output as well
as a final activation function. Specifically, we imple-
mented a 1D pipeline composed of 18 blocks with a
downstream softmax layer. Each of the Deep blocks
comprises a dilated convolution layer with 3 × 3 ker-
nel filters, a spatial dropout layer, another dilated
convolution layer, a ReLU layer, and a final spatial
dropout. The dilation size starts at two and increases
for each block. A softmax layer completes the pro-
posed pipeline. The so-designed 1D Dilated Tempo-
ral CNN output represents the drowsiness level of the
car-driver from which the pipeline has sampled and
processed the PPG signal. This output is a scalar num-
ber in the range [0, 1] that defines the attention level
of the car driver, i.e., from the drowsy driver (0) to
wakeful driver (1). The obtained results confirmed
that the proposed Deep Learning framework correctly
estimates the driver’s drowsiness with high accuracy.
The implemented 1D Deep CNN backbone is ported
over the STA1295 Accord5 embedded MCU platform
(Mazzillo et al., 2018).
3.2 The Video Saliency Scene
Understanding Block
This block is able to generate the saliency map of
the video frames representing the driving scene cap-
tured by the external automotive grade camera. The
Fig. 4 shows the overall scheme of this block. The
video frames acquired by the external camera device
during the driving are processed by the implemented
Non-Local Semantic Segmentation Fully Convolu-
tional Network (NL-FCN) as schematized in Fig. 4.
Semantic segmentation of the samples driving scene
will be performed by the encoder/decoder architec-
ture, which provides a saliency map representing the
most salient object in the acquired video frames. The
proposed NL-FCN architectures are composed of an
encoder and a decoder block. The encoder block
(3D Enc Net) performs spatiotemporal feature extrac-
tion, and it is composed of five blocks. The first
two blocks are composed of two separable convolu-
tion layers with a 3 × 3 × 2 kernel filter followed by
batch normalization, ReLU layer, and a downstream
1 × 2 × 2 max-pooling layer. The remaining three
blocks consist of two separable convolution layers
with a 3 × 3 × 3 kernel filter followed by batch nor-
malization, another convolutional layer with 3×3×3
kernel, batch normalization, and ReLU with a down-
Advanced Car Driving Assistant System: A Deep Non-local Pipeline Combined with 1D Dilated CNN for Safety Driving
85
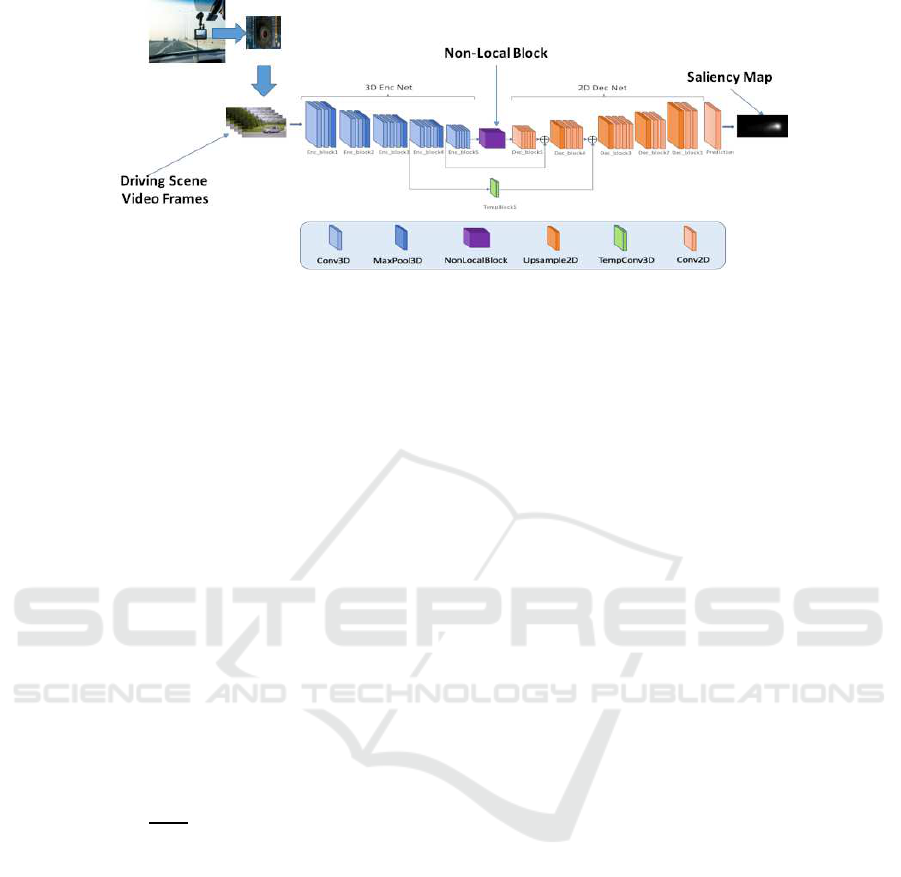
Figure 4: The proposed video saliency scene understanding block.
stream 1 × 2 × 2 max-pooling layer. Furthermore,
we inserted a Non-Local processing layer. Non-local
blocks have been recently introduced (Wang et al.,
2018) as a reliable approach for capturing space-time
long-range dependencies and correlation on feature
maps, providing a sort of “self-attention” mechanism.
Self-attention through non-local blocks aims to en-
force the model to extract correlation among feature
maps by weighting he averaged the features at all pos-
sible positions in the generated feature maps (Wang
et al., 2018). In our pipeline, non-local block is able
to extract features in dependencies at multiple abstract
levels for holistic morphological modeling of the in-
put driving scene frames. The mathematical formula-
tion of non-local operation is reported in the following
equations. Let x a general input data; the employed
non-local operation computes the corresponding re-
sponse y
i
(of the given Deep architecture) at i location
in the input data as a weighted sum of the input data
at all positions j 6= i:
y
i
=
1
ψ(x)
∑
∀ j
ζ(x
i
, x
j
)β(x
j
) (1)
With ζ(·) being a pairwise potential describing the
affinity or relationship between data positions at index
i and j respectively. β(·) is, instead, a unary potential
modulating ζ according to input data. The sum is then
normalized by a factor ψ(x). The parameters of ζ, β
and ψ potentials are learned during model’s training
and defined as follows:
ζ(x
i
, x
j
) = e
Θ(x
i
)
T
Φ(x
j
)
(2)
Where Θ and Φ are two linear transformations of
the input data x with learnable weights W
Θ
and W
Φ
:
Θ(x
i
) = W
Θ
x
i
Φ(x
j
) = W
Φ
x
j
β(x
j
) = W
β
x
j
(3)
For the β(·) function, a common linear embed-
ding (classical 1× 1 × 1 convolution) with learnable
weights Wβ is employed. The normalization function
ψ is:
ψ(x) =
∑
∀ j
ζ(x
i
, x
j
) (4)
In Eqs. (1) - (4), and Embedded Gaussian setup
is reported (Wang et al., 2018). The selection of the
Embedded Gaussian based affinity function is com-
pliant with recent self-attention approaches (Wang
et al., 2018) specifically recommended for 2D or 3D
applications. Through Non-Local Blocks, we cap-
ture long-range Spatio-temporal dependencies on the
frames representing the driving scene, improving the
capability of the saliency-based semantic segmenta-
tion pipeline. The Decoder backbone (2D Dec Net)
decodes the visual features of the encoder. The De-
coder Backbone shows a structure similar to the en-
coder one. Indeed, it comprises five blocks including
2D separable convolutional layers with 3 × 3 kernel,
batch normalization layers, and ReLU. Such resid-
ual connections through a convolutional block are
added. In particular, we have interpolated an up-
sampling block (with a bi-cubic algorithm) to ad-
just the size of the feature maps. The output of the
so-designed NL-FCN is the feature map of the ac-
quired scene frame i.e., the segmented area of the
most salient object. The Fig. 5 shows some instances
of the saliency analysis of the video reporting the driv-
ing scene. In Fig. 5, some frames of a driving sce-
nario are reported. The fixation point over the driv-
ing scene video frames represents the most salient
area detected by our proposed NL-FCN architecture.
The corresponding saliency map (output of the NL-
FCN) is reported in Fig. 5. The NL-FCN has been
trained and tested on the DHF1K dataset (Min and
Corso, 2019). The proposed architecture reports ac-
ceptable performance on DHF1K dataset (Min and
Corso, 2019) (Area Under the Curve: 0.875; Sim-
IMPROVE 2021 - International Conference on Image Processing and Vision Engineering
86
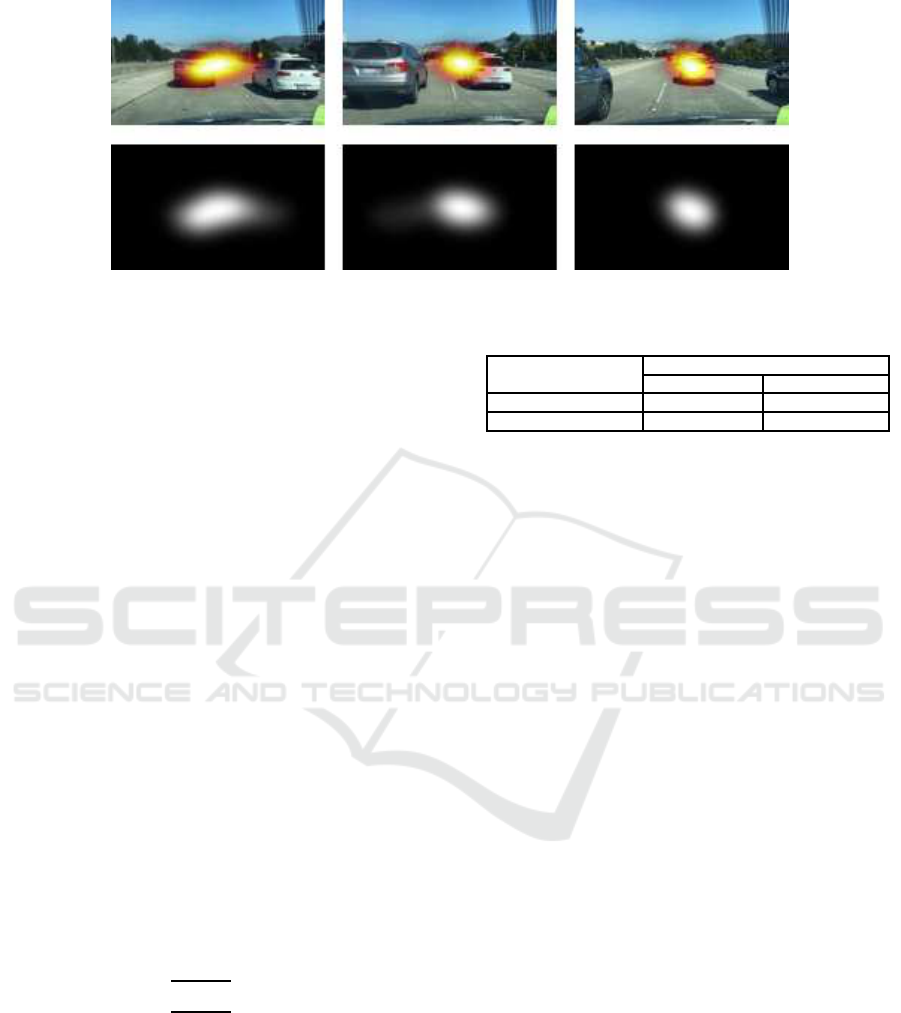
Figure 5: Saliency analysis of the video representing the driving scene.
ilarity: 0.318; Correlation Coefficient: 0.416; Nor-
malized Scanpath Saliency: 2.613) compared with the
performance of similar architectures (Min and Corso,
2019). However, we noticed that the architectures
performing better than our pipeline are particularly
complex computationally and require an expensive
hardware. Conversely, our solution does not require
specific hardware accelerations as it runs on the CPU
in the STA1295 Accordo5 MCU platform (STMicro-
electronics, 2019).
3.3 The Saliency/Attention Tracking
System
This block is designed to evaluate the driver’s atten-
tion level determined by the PPG signal analysis with
the salience map generated by the NL-FCN block.
Therefore, with a static salience maps (low dynamic
of the driving scene frames), the level of attention re-
quired does not necessarily have to be high. On the
contrary, with a high temporal dynamic of the driv-
ing scene saliency map, the system checks if the car
driver attention level is adequately high. Formally, if
we set S
f
(x, y,t) as the saliency map and O
c
(t) the
output of the 1D-CNN model, this block performs the
following mathematical analysis:
V(S(x, y,t)) =
(
∂S
f
(x,y,t)
∂t
6 ϑO
c
(t) 6 ϕ
∂S
f
(x,y,t)
∂t
> ϑO
c
(t) > ϕ
(5)
Basically, as described in Eq. 5 the Driver
Attention Block checks the changing dynamic of
the saliency map S
f
(x, y,t) through ad-hoc defined
threshold ϑ verifying that the level of attention deter-
mined by the Drowsiness Monitoring system (through
analysis of the PPG signal) is followed according to
an ϕ threshold. The thresholds ϑ and ϕ are heuristi-
cally determined as described in the next sections.
Table 3: Benchmark performance of the proposed pipeline.
Car Driver Attention Estimation
Drowsy Driver Wakeful Driver
Proposed 98.71 % 99.03 %
(Rundo et al., 2019b) 96.50 % 98.40 %
4 EXPERIMENTAL RESULTS
In this section, we present and analyze the obtained
results. To carry out the experiments, we trained and
tested the above-described saliency processing sys-
tem on the DH1FK dataset (Mazzillo et al., 2018),
including other driving scenarios acquired by a cam-
era device having a resolution of 2.3 Mpx as and a
framerate of 60 fps. Moreover, we trained and tested
the 1D-CNN model over several PPG signals sampled
on a well recruited dataset. More in detail, under the
scientific coordination of physiologists who partici-
pated in this study, we recruited several subjects to
which we have sampled the PPG signals simulating
different attention levels confirmed by the collected
EEG signal (Rundo et al., 2019a). Furthermore, we
sampled the subject’s PPG signal by using the hard-
ware setup described in this paper with a sampling
frequency of 1 kHz. We collected a total of 70 sub-
jects, males and females having an age range from 21
to 70 years. For each recruited subject, the PPG signal
was acquired, considering various levels of attention.
For each condition (i.e., Drowsy and Wakeful), we
collected 5 minutes of PPG signals. Afterward, we
subdivided the dataset, consisting of PPG time-series
and video driving scenes, taking the 70% of data as
the training data and 30% of data as testing and val-
idation data. The table 3 reports the results obtained
with the proposed pipeline.
The following Fig. 6 shows some instances of the
validated scenarios. In Fig. 6, we show the over-
all proposed pipeline detecting the required driver’s
attention level by analyzing the driving scene us-
Advanced Car Driving Assistant System: A Deep Non-local Pipeline Combined with 1D Dilated CNN for Safety Driving
87
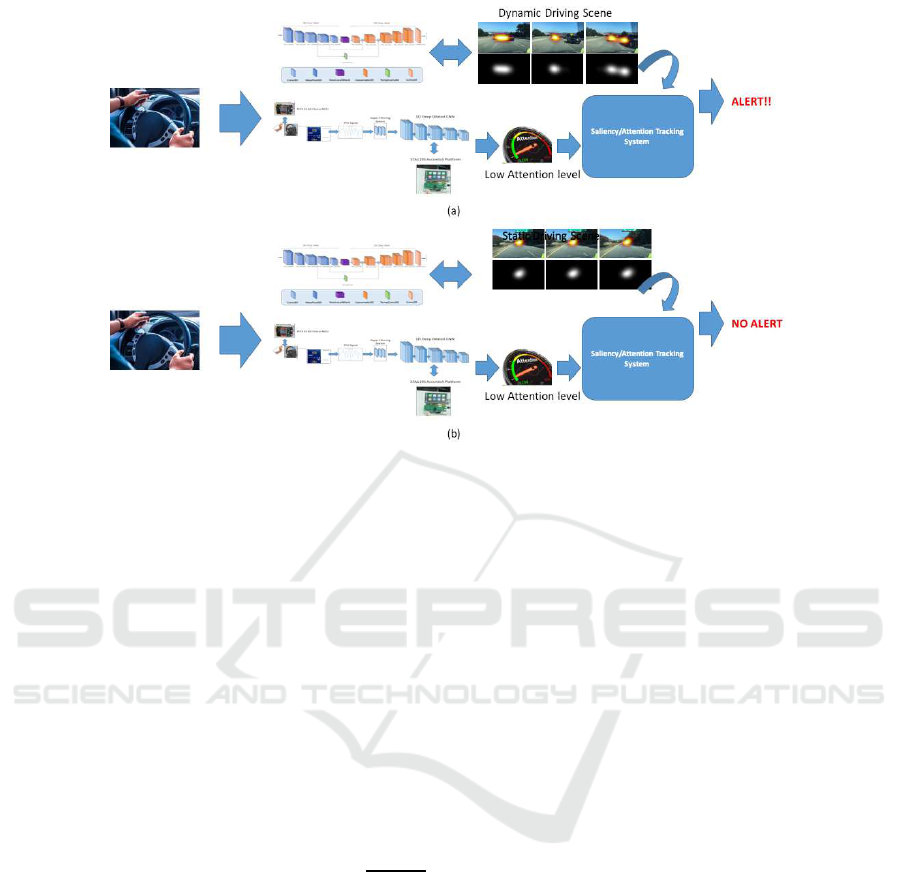
Figure 6: (a) Dynamic driving scenario (car overtaking) requiring high attention level. The Saliency/Attention Tracking
System detects an inadequate level of attention generating an acoustic signal alert. (b) Static driving scenario requiring low
attention level. The Saliency/Attention Tracking System confirms an adequate level of attention.
ing the NL-FCN pipeline. More specifically, the
Saliency/Attention Tracking System compares the
level of attention required by the driving scenario
with the Drowsiness Monitoring System results. An
acoustic signal alerts the driver if the level of atten-
tion determined is lower than that required by the
driving scenario. For this purpose, we have defined
a threshold of ϕ = 0.6 for the 1D-CNN embedded
in the Drowsiness Monitoring System. Specifically,
the 1D-CNN output ranges from 0 to 0.6 (thresh-
old) refers to a medium-low attention level, while
the range from 0.61 to 1 indicates a high attention
level. Consequently, we have defined the ad-hoc nor-
malized ϑ threshold as 0.45 to define a static scene-
based saliency map. Therefore, the values of
∂S
f
(x,y,t)
∂t
greater than the threshold 0.45, represents a high dy-
namic driving scene which require high level of the
car driver attention. Conversely, saliency maps with
low dynamics (under the threshold) will require a low
to medium level of attention from the driver.
5 CONCLUSION AND
DISCUSSION
This paper introduced an innovative approach that
combines visual and physiological data to evaluate the
driver’s drowsiness. The obtained results confirmed
the robustness of the proposed approach. The main
advantage of the method lies in the fact that it does
not require any data analysis in the frequency domain.
Furthermore, the proposed method does not require
either sampling of the ECG or EEG signals of the
driver difficult to be sampled inside the car. The pro-
posed method requires only the PPG signal to be sam-
pled using the described hardware system placed on
the steering wheel of the car. Moreover, we evaluated
the level of attention by ad-hoc fully convolutional
deep network. The proposed network is able to de-
termine a salience map to estimate the attention level
for safe driving. Therefore, the proposed pipeline is
able to verify whether the level of attention required
by the driving scenario is appropriate to the level of
attention retrieved by the analysis of the driver’s PPG
signal, alerting the driver if a risk mismatch occurs.
The proposed pipeline is currently being ported to an
embedded system based on the SoC STA1295 AC-
CORDO 5 MCU platform produced by STMicroelec-
tronics (software environment with embedded Linux)
(STMicroelectronics, 2019). To sum up, the results
have reported promising results in defining an effi-
cient attention monitoring system. Finally, there are
a few directions for further studies. Specifically, we
aim to include more robust domain adaptation meth-
ods based on the usage of combined supervised and
unsupervised approaches successfully used in differ-
ent applications (Rundo et al., 2019c; Rundo et al.,
2019d; Rundo et al., 2018a; Banna et al., 2018).
IMPROVE 2021 - International Conference on Image Processing and Vision Engineering
88

ACKNOWLEDGEMENTS
The authors thank the physiologists belonging to the
Department of Biomedical and Biotechnological Sci-
ences (BIOMETEC) of the University of Catania,
who collaborated in this work in the context of the
clinical study Ethical Committee CT1 authorization
n.113 / 2018 / PO. This research was funded by
the National Funded Program 2014-2020 under grant
agreement n. 1733, (ADAS + Project). The reported
information is covered by the following registered
patents: IT Patent Nr. 102017000120714, 24 Octo-
ber 2017. IT Patent Nr. 102019000005868, 16 April
2018; IT Patent Nr. 102019000000133, 07 January
2019.
REFERENCES
Abi-Saleh, B. and Omar, B. (2019). Einthoven’s triangle
transparency: a practical method to explain limb lead
configuration following single lead misplacements.
Reviews in cardiovascular medicine, 11(1):33–38.
Alshaqaqi, B., Baquhaizel, A. S., Ouis, M. E. A., Boume-
hed, M., Ouamri, A., and Keche, M. (2013). Driver
drowsiness detection system. In 2013 8th Interna-
tional Workshop on Systems, Signal Processing and
their Applications (WoSSPA), pages 151–155. IEEE.
Altun, M. and Celenk, M. (2017). Road scene content
analysis for driver assistance and autonomous driv-
ing. IEEE transactions on intelligent transportation
systems, 18(12):3398–3407.
Banna, G. L., Camerini, A., Bronte, G., Anile, G., Ad-
deo, A., Rundo, F., Zanghi, G., Lal, R., and Li-
bra, M. (2018). Oral metronomic vinorelbine in
advanced non-small cell lung cancer patients unfit
for chemotherapy. Anticancer research, 38(6):3689–
3697.
Cai, Y., Liu, Z., Wang, H., and Sun, X. (2017). Saliency-
based pedestrian detection in far infrared images.
IEEE Access, 5:5013–5019.
Cheon, S.-P. and Kang, S.-J. (2017). Sensor-based driver
condition recognition using support vector machine
for the detection of driver drowsiness. In 2017 IEEE
Intelligent Vehicles Symposium (IV), pages 1517–
1522. IEEE.
Choi, H.-T., Back, M.-K., and Lee, K.-C. (2018). Driver
drowsiness detection based on multimodal using fu-
sion of visual-feature and bio-signal. In 2018 Inter-
national Conference on Information and Communi-
cation Technology Convergence (ICTC), pages 1249–
1251. IEEE.
Deng, T., Yang, K., Li, Y., and Yan, H. (2016). Where does
the driver look? top-down-based saliency detection in
a traffic driving environment. IEEE Transactions on
Intelligent Transportation Systems, 17(7):2051–2062.
Fujiwara, K., Abe, E., Kamata, K., Nakayama, C., Suzuki,
Y., Yamakawa, T., Hiraoka, T., Kano, M., Sumi, Y.,
Masuda, F., et al. (2018). Heart rate variability-based
driver drowsiness detection and its validation with
eeg. IEEE Transactions on Biomedical Engineering,
66(6):1769–1778.
Hong, T. and Qin, H. (2007). Drivers drowsiness de-
tection in embedded system. In 2007 IEEE Inter-
national Conference on Vehicular Electronics and
Safety, pages 1–5. IEEE.
Igasaki, T., Nagasawa, K., Murayama, N., and Hu, Z.
(2015). Drowsiness estimation under driving en-
vironment by heart rate variability and/or breathing
rate variability with logistic regression analysis. In
2015 8th International Conference on Biomedical En-
gineering and Informatics (BMEI), pages 189–193.
IEEE.
Kurian, D., PL, J. J., Radhakrishnan, K., and Balakrish-
nan, A. A. (2014). Drowsiness detection using photo-
plethysmography signal. In 2014 Fourth international
conference on advances in computing and communi-
cations, pages 73–76. IEEE.
Mazzillo, M., Maddiona, L., Rundo, F., Sciuto, A., Lib-
ertino, S., Lombardo, S., and Fallica, G. (2018). Char-
acterization of sipms with nir long-pass interferential
and plastic filters. IEEE Photonics Journal, 10(3):1–
12.
Min, K. and Corso, J. J. (2019). Tased-net: Temporally-
aggregating spatial encoder-decoder network for
video saliency detection. In Proceedings of the IEEE
International Conference on Computer Vision, pages
2394–2403.
Rundo, F., Conoci, S., Banna, G. L., Ortis, A., Stanco, F.,
and Battiato, S. (2018a). Evaluation of levenberg–
marquardt neural networks and stacked autoencoders
clustering for skin lesion analysis, screening and
follow-up. IET Computer Vision, 12(7):957–962.
Rundo, F., Conoci, S., Ortis, A., and Battiato, S.
(2018b). An advanced bio-inspired photoplethysmog-
raphy (ppg) and ecg pattern recognition system for
medical assessment. Sensors, 18(2):405.
Rundo, F., Petralia, S., Fallica, G., and Conoci, S. (2018c).
A nonlinear pattern recognition pipeline for ppg/ecg
medical assessments. In Convegno Nazionale Sensori,
pages 473–480. Springer.
Rundo, F., Rinella, S., Massimino, S., Coco, M., Fallica, G.,
Parenti, R., Conoci, S., and Perciavalle, V. (2019a).
An innovative deep learning algorithm for drowsiness
detection from eeg signal. Computation, 7(1):13.
Rundo, F., Spampinato, C., and Conoci, S. (2019b). Ad-hoc
shallow neural network to learn hyper filtered photo-
plethysmographic (ppg) signal for efficient car-driver
drowsiness monitoring. Electronics, 8(8):890.
Rundo, F., Trenta, F., Di Stallo, A. L., and Battiato, S.
(2019c). Advanced markov-based machine learning
framework for making adaptive trading system. Com-
putation, 7(1):4.
Rundo, F., Trenta, F., di Stallo, A. L., and Battiato, S.
(2019d). Grid trading system robot (gtsbot): A novel
mathematical algorithm for trading fx market. Applied
Sciences, 9(9):1796.
Advanced Car Driving Assistant System: A Deep Non-local Pipeline Combined with 1D Dilated CNN for Safety Driving
89

Ryu, G.-S., You, J., Kostianovskii, V., Lee, E.-B., Kim, Y.,
Park, C., and Noh, Y.-Y. (2018). Flexible and printed
ppg sensors for estimation of drowsiness. IEEE Trans-
actions on Electron Devices, 65(7):2997–3004.
Sari, N. N. and Huang, Y.-P. (2016). A two-stage intelligent
model to extract features from ppg for drowsiness de-
tection. In 2016 International Conference on System
Science and Engineering (ICSSE), pages 1–2. IEEE.
STMicroelectronics (2019). STMicroelectronics AC-
CORDO 5 Automotive Microcontroller. https://www.
st.com/en/automotive-infotainment-and-telematics/
automotive-infotainment-socs.html?icmp=
tt4379
gl pron nov2016. (accessed on 02 July
2019).
Szypulska, M. and Piotrowski, Z. (2012). Prediction of
fatigue and sleep onset using hrv analysis. In Pro-
ceedings of the 19th International Conference Mixed
Design of Integrated Circuits and Systems-MIXDES
2012, pages 543–546. IEEE.
Vicente, J., Laguna, P., Bartra, A., and Bail´on, R. (2011).
Detection of driver’s drowsiness by means of hrv anal-
ysis. In 2011 Computing in Cardiology, pages 89–92.
IEEE.
Vinciguerra, V., Ambra, E., Maddiona, L., Romeo, M.,
Mazzillo, M., Rundo, F., Fallica, G., di Pompeo,
F., Chiarelli, A. M., Zappasodi, F., et al. (2018).
Ppg/ecg multisite combo system based on sipm tech-
nology. In Convegno Nazionale Sensori, pages 353–
360. Springer.
Wang, X., Girshick, R., Gupta, A., and He, K. (2018). Non-
local neural networks. In Proceedings of the IEEE
conference on computer vision and pattern recogni-
tion, pages 7794–7803.
Winterlich, A., Zlokolica, V., Denny, P., Kilmartin, L.,
Glavin, M., and Jones, E. (2013). A saliency weighted
no-reference perceptual blur metric for the automo-
tive environment. In 2013 Fifth International Work-
shop on Quality of Multimedia Experience (QoMEX),
pages 206–211. IEEE.
Xu, Y. J., Ding, F., Wu, Z., Wang, J., Ma, Q., Chon, K.,
Clancy, E., Qin, M., Mendelson, Y., Fu, N., et al.
(2012). Drowsiness control center by photoplythes-
mogram. In 2012 38th Annual Northeast Bioengineer-
ing Conference (NEBEC), pages 430–431. IEEE.
IMPROVE 2021 - International Conference on Image Processing and Vision Engineering
90
