
Development of a Method for Identifying the Functional State of a
Person When Solving Cognitive Tasks According to the Data of the
Brain Microwave Radiation
Anton Yu. Dolganov
a
, Mikhail V. Babich
b
, Timur S. Petrenko
c
and Vladimir S. Kublanov
d
Ural Federal University, Yekaterinburg, Russian Federation
Keywords: Microwave Radiation, Radio Brightness Temperature, Machine Learning, Cognitive Load.
Abstract: The article described a technique for conducting experimental studies using passive non-invasive
thermography in radio bands to study the effect of changes in the psychophysiological state on a person's
radio-brightness temperature. The registration of the radio-brightness temperature signals was carried by
contact microwave radiometer, which ensures the reception of brain microwave radiation in the frequency
range (3.4-4.2) GHz. A data processing algorithm for detecting stable characteristics of patterns in changes in
brightness temperature fluctuations, based on continuous wavelet transform, was proposed. A total of 18
parameters were used to estimate the brightness temperature fluctuations. In this study, two machine learning
methods were tested that allow the selection of the most significant features: logistic regression using L1-
regularization and the decision tree method. The accuracy of determining the functional state on the training
data reached 90%. It was shown that the parameter of microwave radiation fluctuations – the median value of
the amplitude of fluctuations with fluctuation periods from 40 to 80 s, makes it possible to divide the initial
data sample into two subgroups in which the response to cognitive load is significantly different.
1 INTRODUCTION
At each moment of time, a person is in a specific
psychophysiological state. This can be a state of sleep
or wakefulness, sensory deprivation or information
overload, tension or monotony, adaptation or stress.
Each of these psychophysiological states is
characterized by a specific form of the background
activity of the nerve centers, and, accordingly, a
special systemic response of the body to external
stimuli in the form of changes in basic physiological
vital parameters such as heart rate, respiratory rate,
temperature and blood pressure. The time for the
formation of these responses and, accordingly,
changes in the psychophysiological state can be from
several seconds to tens of minutes.
The urgency of the problem of analyzing and
assessing the psychophysiological state of a person,
as a factor determining his behavior and capabilities,
a
https://orcid.org/0000-0003-2318-9144
b
https://orcid.org/0000-0001-7077-6611
c
https://orcid.org/0000-0001-7328-9894
d
https://orcid.org/0000-0001-6584-4544
is determined by the rapid spread of cognitive
disorders among the working-age population of
developed countries (Tol et al., 2014). Existing
methods for assessing the psychophysiological state
are formed on the basis of clinical observations and
are, in fact, subjective, since they use rather
subjective questionnaires for patients, for example,
the depression anxiety stress scale (DASS), as well as
clinical interviews, for example, the Hamilton
psychometric scale (HDRS-21) for assessing the level
of depression. Known instrumental methods in this
task analyze changes in the physical characteristics of
video images or biomedical signals formed on human
skin (Ahn et al., 2019). To study deep processes in
human organs and tissues, measurements of own
physical fields are used, including microwave
radiometers and passive acoustic thermometers.
The aim of this study is to develop a method for
identifying the functional state of a person in solving
Dolganov, A., Babich, M., Petrenko, T. and Kublanov, V.
Development of a Method for Identifying the Functional State of a Person When Solving Cognitive Tasks According to the Data of the Brain Microwave Radiation.
DOI: 10.5220/0010380502330238
In Proceedings of the 14th International Joint Conference on Biomedical Engineer ing Systems and Technologies (BIOSTEC 2021) - Volume 1: BIODEVICES, pages 233-238
ISBN: 978-989-758-490-9
Copyright
c
2021 by SCITEPRESS – Science and Technology Publications, Lda. All rights reserved
233
cognitive tasks based on the data of the brain's own
electromagnetic radiation.
2 MATERIALS AND METHODS
2.1 Research Methodology
Original researches on registration of radio brightness
temperature (RBT) on the basis of the Ural Federal
University were carried out. The study involved a
group of 40 relatively healthy subjects.
The cyclogram of registration of RBT consisted
of the following cycles:
5 minutes – rest state;
5 minutes - cognitive load (verbal counting);
5 minutes - aftereffect.
Registration of RBT signals was carried out using
a model of a contact microwave radiometer, which
ensures the reception of the brain microwave
radiation in the frequency range (3.4-4.2) GHz
(Vesnin et al., 2019). The working frequency range
was chosen in order to be able to receive information
about RBT in the piazza and arachnoid meninges (V.
S. Kublanov et al., 2020). During the research, the
antenna unit of the radiometer was connected to the
radiometric receiver using a flexible coaxial cable 20
cm long and was located in the center of the forehead.
The radiometric receiver of the radiometer, which
provides reception of the brain microwave radiation,
had good thermal insulation from the subject's head.
To provide protection against interference, the
antenna unit was shielded with a metallized fabric.
The experiments were carried out with the lights off.
There were no mobile phones in the experiment room.
2.2 Data Processing Methods
A python program was written to process signals.
Continuous wavelet analysis was chosen as the main
processing method. (Mallat, 2009). The main libraries
used were the NumPy library for general math
transforms, the PyWT library for numerically
computing the continuous wavelet transform (Lee et
al., 2019), and scikit-learn library for applying
machine learning (ML) models(Pedregosa et al.,
2011).
The Gaussian wavelet of the eighth order was
used as the basic wavelet. For each signal, the spectral
components of the RBT signals with fluctuation
periods from 20 to 40 s, from 40 to 80 s, and from 80
to 140 s were calculated.
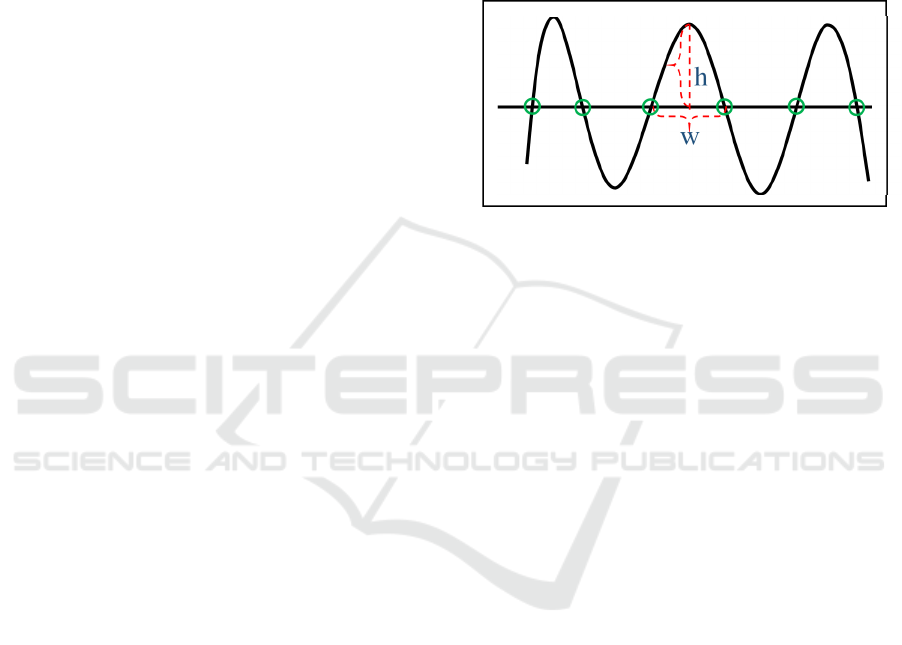
To evaluate the obtained spectral components of
the signals, the following approach was used,
separately for each study cycle and for each spectral
component:
Finding all zero crossing points (green points
on Figure 1);
Estimation for each consecutive pair of points
half-period w and amplitude h;
Estimation of the median value M, standard
deviation STD and coefficient of variation CV
for the set of values of w and h in the study
cycle;
Figure 1: To the method for evaluating signal components.
Thus, for each time stage and for each frequency
domain of interest, 6 estimates were obtained: M w,
STD w, CV w, M h, STD h, CV h. A total of 18
parameters were used to estimate RBT fluctuations.
2.3 Visualization of the
Multidimensional Parameter Space
A popular method for studying the multidimensional
data is a method of t-SNE (Maaten & Hinton, 2008).
This method has become widespread in the field of
machine learning, because it allows one to generate
seemingly convincing two-dimensional "maps" from
data with hundreds or even thousands of parameters.
The idea behind this method is to take a set of
points in a high-dimensional space and find an exact
representation of those points in a lower-dimensional
space, usually in a 2D plane. The algorithm is non-
linear and adapts to the underlying data by
performing different transformations in different
regions.
A special feature of t-SNE is the configurable
“perplexity” parameter. In fact, this parameter
reflects how the new lower-dimensional
representation balances the local and global features
of the original data. The parameter is, in a sense, an
assumption about the number of nearest neighbors of
each point. Thus, the perplexity value has a complex
effect on the resulting images. For small values of this
parameter (1-10), the t-SNE method gives preference
to the local features of the initial data, at large values
(30-50) - the global features of the initial data.
NDNSNT 2021 - Special Session on Non-invasive Diagnosis and Neuro-stimulation in Neurorehabilitation Tasks
234

It is worth remembering the stochastic nature of
this method: the t-SNE algorithm does not always
give the same result with successive runs. Therefore,
it is recommended to repeat the run of the t-SNE
algorithm several times at certain perplexity values in
order to judge general patterns.
2.4 Machine Learning Methods
To solve the problem, an approach based on machine
learning was used, which made it possible to form
combinations of significant parameters of radio
brightness temperature fluctuations to predict the
functional state of subjects from the control group.
Machine learning is considered in a simple concept
y = f (x) , (1)
where x is the original data; f is the function obtained
using ML methods; y is the expected response. In this
study, two ML methods were chosen: logistic
regression (LogR) using L1-regularization and
decision trees (DT), which allow the selection of the
most significant features (V. Kublanov & Dolganov,
2019).
The LogR method (Meier et al., 2008) forms a
probability model using a logistic function. L1
regularization or Lasso regularization is a linear
model that estimates sparse coefficients. This
approach is useful in some problems because of its
tendency to give preference to solutions with fewer
non-zero coefficients, effectively reducing the
number of parameters on which a given solution
depends. Mathematically, this model is based on
adding a regularization term to the standard LogR
approach - the modulus of the sum of the weight
coefficients.
The DT method is also an approach that
incorporates the search for the most significant
parameters (Lior, 2014). At each DT node, there is a
search among all available parameters for the one that
most optimally divides the sample into classes. The
selection takes place sequentially until all data is
divided or further separation is less optimal than what
was obtained in the previous step.
The cycle of studies is considered as y. The
analyzed signal is expected to be related to brain
activity and should look different for different study
cycles. As the initial data x, 18 parameters of RBT
fluctuations were considered.
The following were used as the metrics for
evaluating the models of ML:
accuracy - the proportion of responses
correctly predicted by the ML model;
precision - the proportion of responses
predicted by the ML model are positive and, at
the same time, are really positive;
recall - the proportion of objects predicted by
the ML model as a positive class out of all
objects of a positive class;
F1-score - harmonic mean of precision and
recall.
To reduce the effect of overfitting, a 5-fold cross-
validation approach was used (Refaeilzadeh et al.,
2009). At each stage of the cross validation, each
metric was evaluated. The final metrics were assessed
as the average of the metrics across 5 rounds of cross
validation (cv5). Additionally, the overall
classification accuracy and the F-1 measure were
evaluated for the general model (on the training
data).
3 RESULTS
3.1 Data Visualization with t-SNE
Figure 2 shows the results of visualizing the
application of the t-SNE algorithm for three
perplexity values- 2, 10, 30. For each perplexity
value, the t-SNE algorithm was implemented several
times. Below are the 4 most typical implementations
for each perplexity value.
As can be seen from Figure 2, at different
perplexity values, green dots, which correspond to
cognitive load, quite often turn out to be isolated from
red and blue. In this case, the red and blue dots, as a
rule, are close to each other. In some cases, green dots
are divided into subgroups, due to the nature of the t-
SNE algorithm. However, even in this cases these
groups are separated from the red and blue dots.
Thus, the parameters of RBT fluctuations at the
stages of rest state and aftereffect are quite similar,
while the parameters at the stage of cognitive load
tend to differ from both of these stages. From this, we
can conclude that it would be more reasonable to
solve the binary classification problem: the rest state
recording and aftereffect stage was selected as the
first class, and the cognitive load stage as the second
class.
3.2 Results of Applying Machine
Learning Methods
Table 1 shows the results of evaluating the MO
models. For LogR, two models are considered - linear
combinations of parameters and combinations of
second degree polynomials. Increasing the degree of
the polynomial to 3 does not increase the performance
Development of a Method for Identifying the Functional State of a Person When Solving Cognitive Tasks According to the Data of the Brain
Microwave Radiation
235
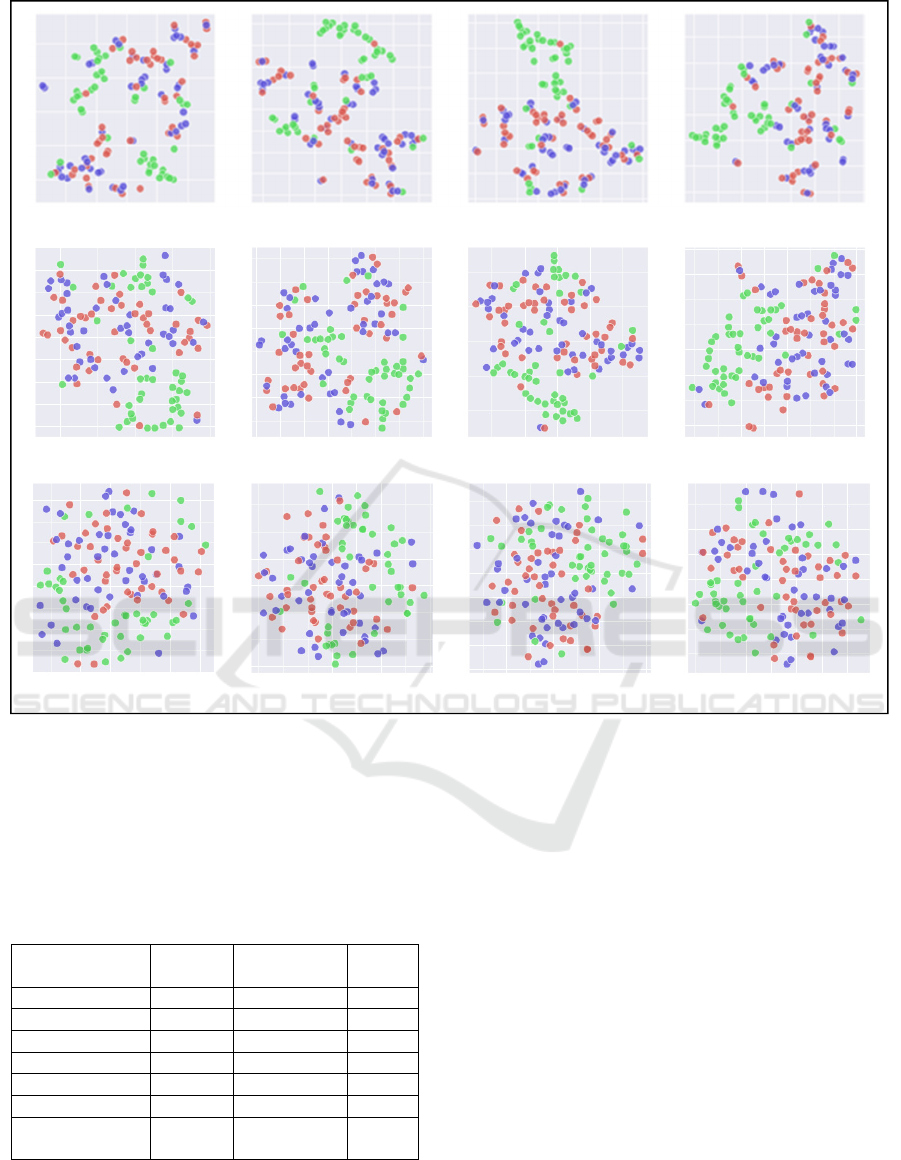
Figure 2: Visualization of RBT parameters by the t-SNE method: a) perplexity = 2; b) perplexity = 10; c) perplexity = 30.
Red dots – rest state recording, green - cognitive load, blue - aftereffect.
metrics of the MO model. For DT, the parameter
maximum depth is set equal to 5. At this value of the
parameter, the highest values of the MO metrics are
achieved.
Table 1: Perfomance metrics for classification models.
Metric
LogR
(linear)
LogR
(Quadratic)
DT
Accuracy_cv5
0.650
0.625 0.591
Precision_cv5
0.798
0.727 0.705
Recall_cv5 0.662
0.725
0.700
F1-score_cv5
0.719
0.716 0.693
Accuracy_Train 0.675 0.800
0.900
F1-score_Train 0.738 0.850
0.923
Number of
parameters
3
13 10
As can be seen from the results shown in Table 1,
the highest accuracy for training data is achieved
using the DT method. Moreover, for this method, the
MO metrics on cross validation are lower than for
LogR.
Analyzing the list of parameters for different ML
models, it is worth highlighting the parameter
M H 40-80 (median value of the
RBT
amplitude with
a fluctuation period from 40 to 80 s). This parameter
was present in all ML models. If one analyzes this
parameter separately, it can be seen that the
distribution of this parameter for the functional state
of the cognitive load looks biased in relation to the
states of rest state and aftereffect.
Let's divide the initial sample into two: parameter
M H 40-80 in the state of cognitive load ≥678 (the
first group); parameter M H 40-80 in a state of
cognitive load <678 (the second group).
Visualization of the distribution of the parameter
M H 40-80 for different functional states for these
two groups is shown in Figure 3. It can be seen that
the first group is characterized by an increase in this
a)
b)
c)
NDNSNT 2021 - Special Session on Non-invasive Diagnosis and Neuro-stimulation in Neurorehabilitation Tasks
236
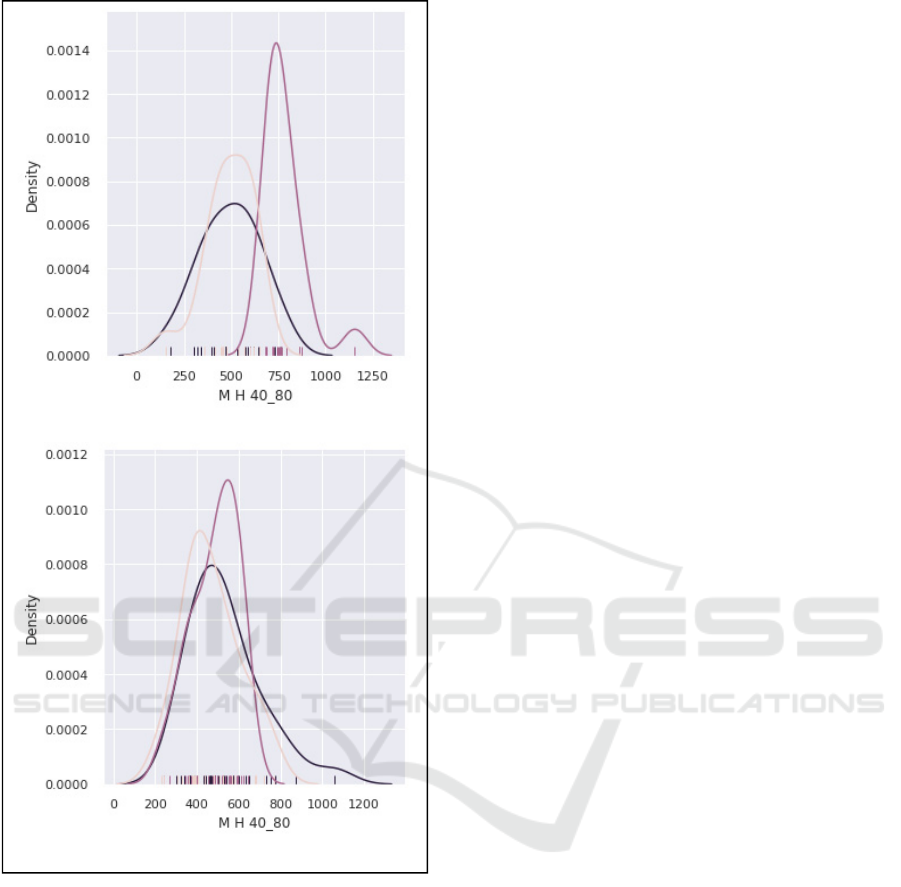
Figure 3: Distribution of the parameter M H 40-80:
a) the first group; b) the second group. In light highlighted
the distribution for the rest state stage, in pink - for the
cognitive load stage, in dark - for the after-effect stage.
parameter in a state of cognitive load. For the second
group, the distributions of this parameter are similar.
Estimates of the Student's t-test for the first group
showed that the difference in means is statistically
significant:
in comparison with the rest-state stage, record
t-test = 3.87, p-value = 0.0002;
in comparison with the after-effect stage t-test
= 2.62, p-value = 0.0103.
For the second group, the Student's t-test did not
show the statistical significance of the difference in
means. This result may indicate that the original
sample can be divided into two subgroups in which
the response to cognitive load is different. These two
subgroups require a more detailed comparison, taking
into account the psychophysiological and
motivational characteristics of the subjects.
4 CONCLUSIONS
The article describes a technique for conducting
experimental studies using passive non-invasive
thermography methods in radio bands to study the
effect of changes in the psychophysiological state on
a person's radio brightness temperature. The study
consists of three stages - background recording,
cognitive load (verbal counting) and aftereffect. To
register the brightness temperature fluctuations, a
model of a contact microwave radiometer was used,
which ensures the reception of brain microwave in the
frequency range (3.4-4.2) GHz.
Correction of data processing algorithms is
proposed to detect stable characteristics of patterns in
changes in radio brightness temperature fluctuations,
which are determined by changes in the
psychophysiological state of a person. For each
signal, a wavelet analysis was performed to calculate
the spectral components of the brightness temperature
signals with fluctuation periods from 20 to 40 s, from
40 to 80 s, and from 80 to 140 s. For each stage of the
study, 18 parameters were assessed: mean value M,
standard deviation STD and coefficient of variation
CV for the set of values of the width and amplitude of
the oscillation for each of the three spectral
components.
An assessment of the performance of algorithms
based on machine learning methods for the formation
of an objective assessment of the
psychophysiological state of a person by recording
the brain microwave radiation, has been carried out.
The results presented made it possible to single
out a special parameter of brightness temperature
fluctuations - the average value of the amplitude of
fluctuations with fluctuation periods from 40 to 80 s.
This parameter makes it possible to divide the initial
data sample into two subgroups in which the response
to cognitive load is significantly different.
ACKNOWLEDGEMENTS
The reported study was funded by RFBR according
to the research project № 18-29-02052.
a)
b
)
Development of a Method for Identifying the Functional State of a Person When Solving Cognitive Tasks According to the Data of the Brain
Microwave Radiation
237

REFERENCES
Ahn, J. W., Ku, Y., & Kim, H. C. (2019). A novel wearable
EEG and ECG recording system for stress assessment.
Sensors, 19(9), 1991.
Kublanov, V., & Dolganov, A. (2019). Development of a
decision support system for neuro-electrostimulation:
Diagnosing disorders of the cardiovascular system and
evaluation of the treatment efficiency. Applied Soft
Computing, 77, 329–343. https://doi.org/10.1016/
j.asoc.2019.01.032
Kublanov, V. S., Borisov, V. I., & Babich, M. V. (2020).
Simulation the distribution of thermodynamic
temperatures and microwave radiation of the human
head. Computer Methods and Programs in
Biomedicine, 190(105377), 7. https://doi.org/10.1016/
j.cmpb.2020.105377
Lee, G. R., Gommers, R., Waselewski, F., Wohlfahrt, K.,
& O’Leary, A. (2019). PyWavelets: A Python package
for wavelet analysis. Journal of Open Source Software,
4(36), 1237.
Lior, R. (2014). Data mining with decision trees: Theory
and applications (Vol. 81). World scientific.
Maaten, L. van der, & Hinton, G. (2008). Visualizing data
using t-SNE. Journal of Machine Learning Research,
9(Nov), 2579–2605.
Mallat, S. (2009). A Wavelet Tour of Signal Processing.
Scopus.
Meier, L., Van De Geer, S., & Bühlmann, P. (2008). The
group lasso for logistic regression. Journal of the Royal
Statistical Society: Series B (Statistical Methodology),
70(1), 53–71.
Pedregosa, F., Varoquaux, G., Gramfort, A., Michel, V.,
Thirion, B., Grisel, O., Blondel, M., Prettenhofer, P.,
Weiss, R., Dubourg, V., Vanderplas, J., Passos, A.,
Cournapeau, D., Brucher, M., Perrot, M., & Duchesnay,
É. (2011). Scikit-learn: Machine Learning in Python.
Journal of Machine Learning Research, 12,
2825−2830.
Refaeilzadeh, P., Tang, L., & Liu, H. (2009). Cross-
validation. In Encyclopedia of database systems (pp.
532–538). Springer.
Tol, W. A., Barbui, C., Bisson, J., Cohen, J., Hijazi, Z.,
Jones, L., De Jong, J. T., Magrini, N., Omigbodun, O.,
& Seedat, S. (2014). World Health Organization
guidelines for management of acute stress, PTSD, and
bereavement: Key challenges on the road ahead. PLoS
Medicine, 11(12), e1001769.
Vesnin, S., Sedankin, M., Ovchinnikov, L., Leushin, V.,
Skuratov, V., Nelin, I., & Konovalova, A. (2019).
Research of a microwave radiometer for monitoring of
internal temperature of biological tissues. Eastern-
European Journal of Enterprise Technologies, 4 (5), 6–
15.
NDNSNT 2021 - Special Session on Non-invasive Diagnosis and Neuro-stimulation in Neurorehabilitation Tasks
238
