
Performance of Monosyllabic vs Multisyllabic Diadochokinetic
Exercises in Evaluating Parkinson’s Disease Hypokinetic Dysarthria
from Fluency Distributions
Pedro Gómez-Vilda
1a
, Andrés Gómez-Rodellar
2b
, Daniel Palacios-Alonso
3c
and Athanasios Tsanas
2d
1
NeuSpeLab, Center for Biomedical Technology, Universidad Politécnica de Madrid,
Campus de Montegancedo, s/n, 28223, Pozuelo de Alarcón, Madrid, Spain
2
Usher Institute, Medical School, University of Edinburgh, Old Medical School, Teviot Place, Edinburgh, EH8 9AG, U.K.
3
Escuela Técnica Superior de Ingeniería Informática, Universidad Rey Juan Carlos,
Campus de Móstoles, Tulipán, s/n, 28933 Móstoles, Madrid, Spain
Keywords: Parkinson’s Disease, Speech Diadochokinetics, Hypokinetic Dysarthria.
Abstract: Hypokinetic Dysarthria (HD) is a major debilitating symptom in the vast majority of people diagnosed with
Parkinson's Disease (PD). It has been traditionally evaluated using diadochokinetic exercises to estimate its
degree of severity, among them, the fast repetition of monosyllables as [pa], [ta], and [ka] and multisyllable
sequences as [pataka], [pakata], [badaga] and others alike. However, the real efficiency of these exercises in
differentiating the participant behaviour as pathological or normative has not been investigated in depth. The
aim of the present work is to explore the timely responsive performance of two of these exercises (a
monosyllabic [ta] vs a multisyllabic [pataka]). A method to characterize statistically syllabic and inter-syllabic
interval durations in the execution of these diadochokinetic exercises, based on Kolmogorov-Smirnov
approximations and Jensen-Shannon Divergence has been used to assess the efficiency of both types of
exercises. The results from the evaluation of 24 gender-balanced participants (12 PD and 12 controls) show
that the monosyllabic exercise does not seem to differentiate well, whereas the multisyllabic exercise has a
better differentiation performance. These findings, although relatively preliminary due to the limited sample
size, underline the need to carefully consider the battery of tests towards assessing HD.
1 INTRODUCTION
Parkinson’s Disease (PD) is a neurodegenerative
disorder second in prevalence to Alzheimer’s Disease
(De Lau and Breteler, 2006). Its origin is mainly
caused by the lack of a specific neurotransmitter
known as dopamine in midbrain (Dauer and
Przedboski, 2003), resulting in relevant neuromotor
deterioration affecting body movement (Duffy,
2013). Since the early work of Dr. James Parkinson
(Parkinson, 1817) describing observable neuromotor
alterations in patients of shaking palsy, including
speech problems, most commonly known as
a
https://orcid.org/0000-0003-3283-378X
b
https://orcid.org/0000-0001-8643-9871
c
https://orcid.org/0000-0001-6063-4898
d
https://orcid.org/0000-0002-0994-8100
Hypokinetic Dysarthria (HD). It is a well-established
fact that PD causes considerable alterations in speech
and phonation (Ricciardi et al., 2016, Brabenec et al.,
2017). Roughly, speech alterations may be classified
as dysphonia (alterations to the production of voice),
dysarthria (alterations in the articulation of speech),
dysprosody (alterations in the definition of the
fundamental frequency) and dysfluency (alterations
in the rhythm and in speech blocking). Although these
terms refer to specific and different aspects of
anomalous speech production, as all these effects are
included in HD, this term will be used for the
remainder of this study. The extraction of acoustic
markers caused by HD in PD speech allows to
114
Gómez-Vilda, P., Gómez-Rodellar, A., Palacios-Alonso, D. and Tsanas, A.
Performance of Monosyllabic vs Multisyllabic Diadochokinetic Exercises in Evaluating Parkinson’s Disease Hypokinetic Dysarthria from Fluency Distributions.
DOI: 10.5220/0010380301140123
In Proceedings of the 14th International Joint Conference on Biomedical Engineering Systems and Technologies (BIOSTEC 2021) - Volume 4: BIOSIGNALS, pages 114-123
ISBN: 978-989-758-490-9
Copyright
c
2021 by SCITEPRESS – Science and Technology Publications, Lda. All rights reserved

conclude that speech analysis might become a non-
invasive and cost-effective tool to characterize and
monitor PD. There is “compelling evidence to suggest
that speech can help quantify not only motor
symptoms ... but generalized diverse symptoms in
PD” (Tsanas, 2012). There has been a substantial
body of work aimed to characterize PD induced HD,
focusing on diadochokinetic exercises to assess its
degree of severity. Indicative diadochokinetic
exercises include the repetition of monosyllables as
[pa], [ta], and [ka] and multisyllable sequences as
[pataka], [pakata], [badaga] and others of the same
nature and function. Exercises consist of repetitions
of the sequences as fast as possible, and this setup has
been commonly used in PD speech assessment
(Ziegler, 2002). The efficiency of these exercises as a
way of differentiating participant behaviour as
pathological or normative has not been fully
evaluated (for a comprehensive review see Karlsson,
et al., 2020). The aim of the present study is to explore
if the timely responsive evaluation of these exercises
may serve as a reliable biomarker or if different or
better organized protocols would have a better
performance. The main objective of the present study
is to compare the performance of two classical
diadochokinetic exercises as the repetition of a single
syllable […ta…] where an apical-alveolar pattern is
involved, versus the repetition of a multisyllabic
sequence as […pataka…] that presents bilabial and
dorsal-velar patterns. These two exercises may allow
to properly differentiate between PD participants and
Heal Control (HC) participants. The paper is
organized as follows: Section 2 is devoted to describe
the number of participants in the experimental
framework, the speech recording conditions used, the
biometrical characteristics of the participants, and the
statistical methods used in the study. Section 3
describes the results produced by the statistical
analysis of speech recordings. Section 4 focus on
analysing and discussing the results. Section 5
summarises the main conclusions derived from the
present work.
2 MATERIALS AND METHODS
2.1 Materials
Twelve gender-balanced PD participants were
selected from the patient associations of Alcorcón and
Leganés (APARKAM). The inclusion conditions for
HC participants were non-smoking for the last five
years, and not presenting any known laryngeal or
neurological diagnosis. The study was approved by
the Ethical Committee of Universidad Politécnica de
Madrid. Each participant signed a voluntary
participation informed consent. The study was fully
aligned with the Declaration of Helsinki. The
participants were asked to utter two different
exercises, the first one consisting in the repetition of
the syllable [ta] at the fastest speed possible and as
long as they could sustain it, as […tatata…]
(monosyllabic repetition). The second exercise
consisted of repeating the sequence [pataka] as fast
and as long as possible. These two sequences were
selected for being regular and monosyllabic (the
former one) and for involving three different
articulation points (bilabial, apical-alveolar and
dorsal-velar, the latter). These exercises are
especially well suited for the examination of the
speaker’s fluency, as they do not have any meaning
per se. The first one is regular and serves as a
reference both for HC and PD participants. The
second one invokes the three main articulation points
in Spanish (bilabial, dento-alveolar, velar), and it
forces the speaker to change facial, lingual, velar and
jaw positions, to extract meaningful features from the
distribution of time intervals (inter-syllabic and intra-
syllabic). The recordings were taken in the speech
therapist service room at two different locations of the
patient association, no soundproofing or any other
quality-preserving measures were undertaken, except
keeping a silent environment inside the room with
access limited to participants and assistants. The
speech recordings were originally sampled at 50 kHz
with 16 bits of resolution by a phantom-fed wireless
Audio Technica cardioid microphone, and digitized
on a Motu Traveller board. The data were
downsampled to 8 kHz (antialias filtering at 4 kHz
was previously used) to comply with standard
telephone channel conditions, making it compatible
with remote recordings obtained from a smart phone
using the protocol defined in MonParLoc (Palacios
et al., 2020). The participants were divided in four
data sets for the study: 6 male and 6 female HC
participants, and 6 male and 6 female PD participants
as shown in Table 1.
Performance of Monosyllabic vs Multisyllabic Diadochokinetic Exercises in Evaluating Parkinson’s Disease Hypokinetic Dysarthria from
Fluency Distributions
115

Table 1: Participants’ biometrical data. MC: male control
participants; MP: male PD participants; FC: female control
participants; FP: female PD participants; H&Y: Hoehn and
Yahr PD rating scale; State: medication state (on: under
medication; -: not applicable).
Dataset Code Gende
r
A
g
e H&Y State
MC
MC1 M 69 - -
MC2 M 70 - -
MC3 M 68 - -
MC4 M 67 - -
MC5 M 61 - -
MC6 M 68 - -
FC
FC1 F 66 - -
FC2 F 62 - -
FC3 F 65 - -
FC4 F 67 - -
FC5 F 65 - -
FC6 F 65 - -
MP
MP1 M 71 2 on
MP2 M 69 2 on
MP3 M 73 2 on
MP4 M 73 2 on
MP5 M 73 2 on
MP6 M 69 2 on
FP
FP1 F 73 2 on
FP2 F 73 2 on
FP3 F 66 2 on
FP4 F 71 2 on
FP5 F 78 2 on
FP6 F 70 2 on
2.2 Methods
An experimental framework has been devised to test
the relative effects of HD by means of the extraction
of syllabic and inter-syllabic interval durations
estimated from the speech signal produced by the
participants. The main features considered are mean,
standard deviation, skewness, and kurtosis of the
duration of the syllabic and inter-syllabic (silence)
interval distributions, and their normality. The
methodology used in the study is based on the
estimation of the following acoustic characteristics of
the speech recordings:
The energy profile estimated using the Teager-
Kaiser Energy Operator (TKEO, Dimitriadis,
Potamianos and Maragos, 2009).
The glottal residual using the Iterative Adaptive
Inverse Filtering (IAIF, Alku et al., 2019).
The Voiced-Unvoiced Intervals (VUI) using the
zero-crossings function of the Linear Prediction
(LP) residual.
All these characteristics can be considered correlates
showing relevant semantic clues present in speech,
that affect the quality of phonation, the prosody and
the fluency. The TKO, and the VUI, are defined as
𝐸
𝑛
𝑠
𝑛
𝑠
𝑛1
𝑠𝑛 1
𝐹
𝑛
dim𝑧
𝑛
;
(1)
where
𝑟
𝑛
1;𝑠
𝑛
0;
0;otherwise
𝑞
𝑛
𝑟
𝑛
𝑟𝑛1
𝑧
𝑛
𝑞
𝑛
;𝑞
𝑛
0
0;otherwise
(2)
The TKO and the VUI may be used to determine the
inferior and superior syllabic interval limits as
𝐺
𝑛
𝐸
𝑛
𝐹
𝑛
𝑛
𝑛
𝐺
𝑛1
𝜗
𝑎𝑛𝑑 𝐺
𝑛
𝜗
𝑛
𝑛
𝐺
𝑛1
𝜗
and 𝐺
𝑛
𝜗
(3)
to divide the speech signal produced by
diadochokinetic exercise into syllabic (Sy) and
silence (Si) intervals, containing the interval duration
of syllabic segments d
sy
(i) and silence segments d
si
(i)
𝑑
𝑖
n
𝑛
𝑑
𝑖
𝑛
𝑛
∀𝑑
𝑖
20𝑚𝑠
(4)
The normalized distributions of the syllable and
silence interval durations might be considered good
candidates to establish a differentiation protocol
between the behaviour of PD and HC participants in
mutual information terms(Cover and Thomas, 2006),
using the Jensen-Shannon Divergence (JSD). The
resulting sequences of syllable and silence interval
durations as d
sy
(i) and d
si
(i) are approximated as
Kolmogorov-Smirnov distribution densities p
sy
(i) and
p
si
(i) following Simard & L’Ecuyer, 2011. For each
probability density a distance to the average HC
subsets (p
msy
(i) and p
msi
(i) for males, and p
fsy
(i) and
p
fsi
(i) for females) was obtained using the JSD (see
Gómez et al., 2019 for a detailed description of the
JSD estimation).
3 RESULTS
The speech signal produced by each participant are
split into the corresponding diadochokinetic exercises
[…tatata…] and […pataka…]. Then they are
segmented into intervals with speech activity
(syllables) and with no speech activity (silences)
BIOSIGNALS 2021 - 14th International Conference on Bio-inspired Systems and Signal Processing
116
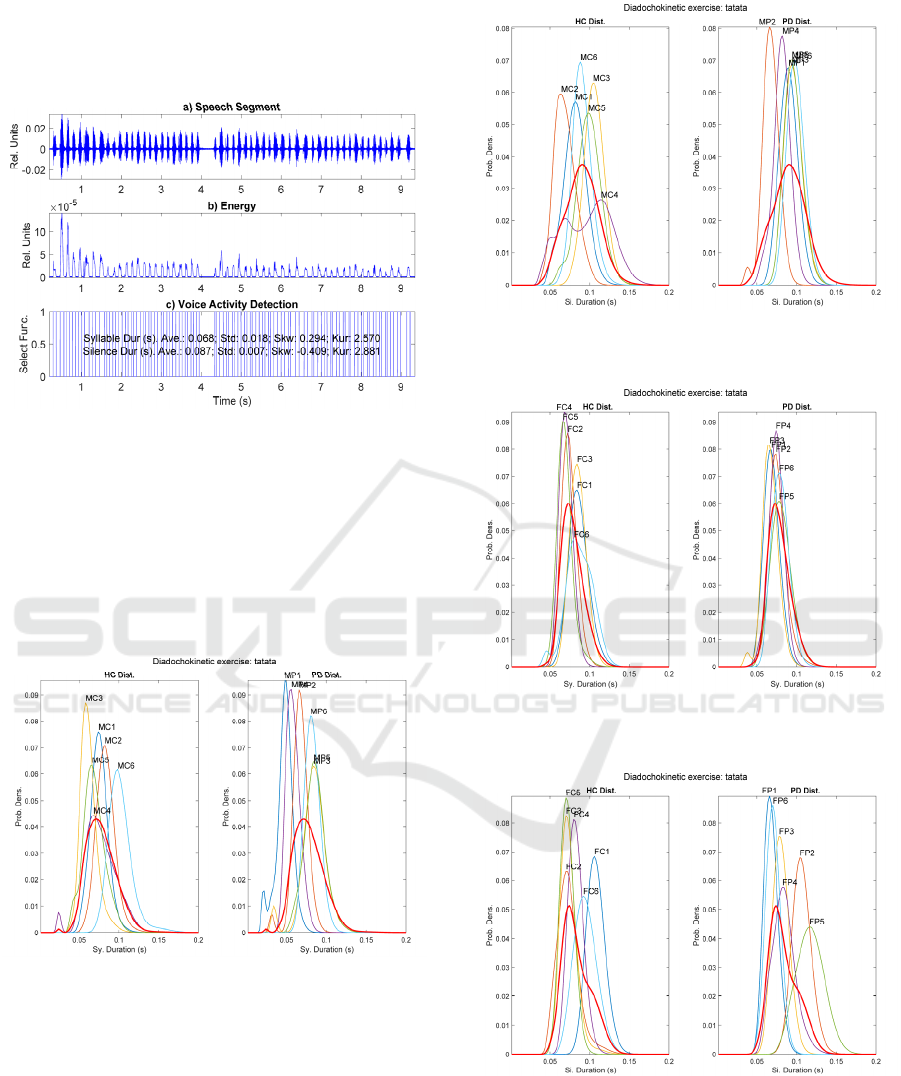
using the TKO and VUI indexes. One example of a
segmented speech sequence from a diadochokinetic
exercise can be seen in Figure 1.
Figure 1: Segmentation of the speech signal corresponding
to the diadochokinetic exercise […pataka…] from a male
HC participant (MC6): a) Speech segment under analysis;
b
) Results of TKO and VUI; c) Voice activity detection
(segmentation into syllable and silence durations).
The distributions from two diadochokinetic exercises
(…tatata… and …pataka…) uttered by the male and
female HC and PD participants are shown in Figure 2
to Figure 9.
Figure 2: Male Syllable sequence distributions fro
m
[…tatata…]. HC (left) and PD (right).
The distribution from the average HC densities is
shown in red in both plots for an easy comparison.
For the following figures the representation
conditions are the same as in figure 2.
Figure 3: Male Silence sequence distributions from
[…tatata…]. HC (left) and PD (right).
Figure 4: Female Syllable sequence distributions from
[…tatata…]. HC (left) and PD (right).
Figure 5: Female Silence sequence distributions fro
m
[…tatata…]. HC (left) and PD (right).
Performance of Monosyllabic vs Multisyllabic Diadochokinetic Exercises in Evaluating Parkinson’s Disease Hypokinetic Dysarthria from
Fluency Distributions
117
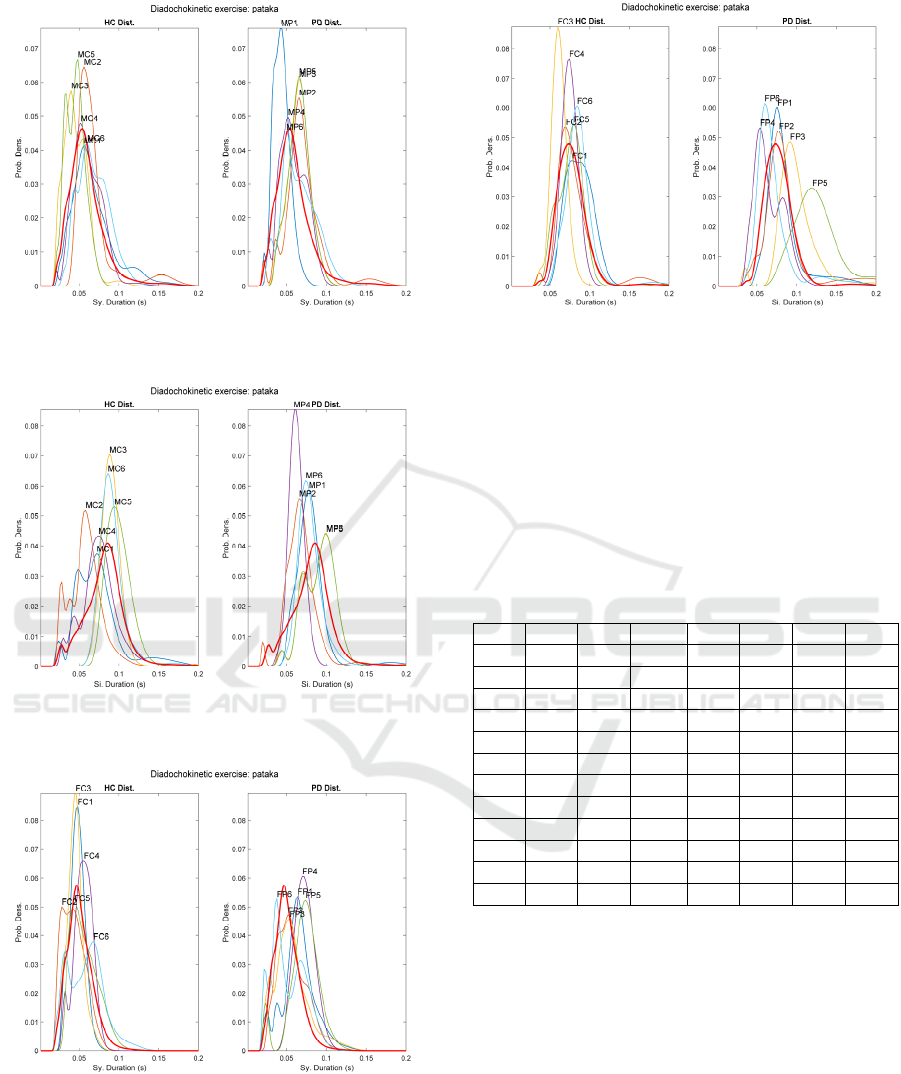
Figure 6: Male Syllable sequence distributions fro
m
[…pataka…]. HC (left) and PD (right).
Figure 7: Male Silence sequence distributions from
[…pataka…]. HC (left) and PD (right).
Figure 8: Female Syllable sequence distributions from
[…pataka…]. HC (left) and PD (right).
Figure 9: Female Silence sequence distributions fro
m
[…pataka…]. HC (left) and PD (right).
Complementary descriptions of the fluency sequence
of syllables and silences by the male and female
datasets (HC vs PD participants) are given in Table 2
to Table 9. The provided normality tests and the
Jensen-Shannon divergence are with respect to the
HC pool set. The subset gender, sequence and
exercise are highlighted in bold.
Table 2: Parametric description of the male Syllabic PD
and HC distributions, sequence […tatata…].
Code Ints Mean StdDev Skew Kurt
p
-vLil JSD
MP1 37 0.047 0.009 -1.018 4.430 0.029 0.597
MP2 38 0.067 0.008 -2.190 11.664 0.002 0.335
MP3 23 0.083 0.014 -1.571 7.584 0.103 0.277
MP4 26 0.058 0.006 0.405 2.183 0.244 0.462
MP5 22 0.085 0.011 -0.046 3.755 0.288 0.268
MP6 38 0.082 0.005 -0.039 2.404 0.500 0.326
MC1 42 0.075 0.008 0.115 4.243 0.276 0.242
MC2 38 0.083 0.009 0.343 4.953 0.427 0.277
MC3 54 0.062 0.009 1.142 5.317 0.079 0.406
MC4 43 0.076 0.018 -0.085 3.235 0.500 0.040
MC5 45 0.068 0.012 0.066 2.820 0.500 0.223
MC6 36 0.101 0.012 1.991 9.594 0.030 0.489
The first column from the left (code) gives each
participant’s code according to its gender (M: males,
F: females), health condition (C: HC, P: PD), and a
consecutive number from 1 to 6. The second column
(Ints) give the number of syllable or silence intervals
detected in each sample utterance. The third column
gives the value of the mean interval in seconds. The
fourth column gives its standard deviation in seconds.
The fifth column (Skew) gives the skewness
distribution, and the sixth (Kurt) one gives its
kurtosis. The seventh column (p-vLil) gives the p-
value of Lilliefors’ hypothesis test of the distribution
being normal (H0) on the confidence value of 0.05 (p-
BIOSIGNALS 2021 - 14th International Conference on Bio-inspired Systems and Signal Processing
118

value<0 means rejecting the normality hypothesis).
The eighth column (JDS) gives the Jensen-Shannon
distance of the sample distribution with respect to the
average pool of HC distributions. The data in bold
refer to the minimum and maximum of columns 2-4
and 8, and to the distributions rejecting H0 (5-7).
Table 3: Parametric description of the male Silence PD an
d
HC distributions, sequence […tatata…].
Code Ints Mean StdDev Skew Kurt p-vLil JSD
MP1 36 0.089 0.007 -0.463 2.543 0.147 0.267
MP2 37 0.067 0.008 -1.009 5.262 0.500 0.493
MP3 22 0.096 0.007 0.278 2.641 0.500 0.272
MP4 25 0.081 0.008 -1.430 5.102 0.104 0.331
MP5 21 0.095 0.007 0.342 2.937 0.500 0.278
MP6 37 0.099 0.006 -0.126 2.086 0.463 0.304
MC1 41 0.081 0.012 -0.376 3.006 0.352 0.241
MC2 37 0.069 0.012 0.253 2.516 0.500 0.432
MC3 53 0.105 0.007 -1.080 4.170 0.181 0.357
MC4 42 0.096 0.028 -0.246 1.932 0.168 0.247
MC5 44 0.098 0.012 -0.626 3.995 0.245 0.223
MC6 35 0.090 0.008 0.331 4.166 0.420 0.266
Table 4: Parametric description of the female Syllabic PD
and HC distributions, sequence […tatata…].
Code Ints Mean StdDev Skew Kurt p-vLil JSD
FP1 34 0.069 0.007 0.017 2.620 0.500 0.277
FP2 41 0.076 0.009 0.740 5.701 0.018 0.118
FP3 39 0.067 0.008 -0.598 5.224 0.221 0.325
FP4 28 0.074 0.006 -1.222 4.904 0.053 0.167
FP5 29 0.080 0.011 0.132 2.983 0.500 0.090
FP6 44 0.079 0.007 0.007 2.345 0.406 0.140
FC1 29 0.086 0.010 0.203 3.100 0.500 0.253
FC2 30 0.074 0.006 0.449 2.928 0.221 0.175
FC3 43 0.085 0.006 -0.265 2.399 0.500 0.267
FC4 37 0.070 0.005 0.002 2.302 0.500 0.275
FC5 45 0.069 0.007 1.352 6.635 0.002 0.316
FC6 30 0.086 0.015 -0.592 3.137 0.108 0.253
Table 5: Parametric description of the female Silence PD
and HC distributions, sequence […tatata…].
Code Ints Mean StdDev Skew Kurt p-vLil JSD
FP1 33 0.068 0.006 0.298 2.318 0.500 0.379
FP2 40 0.106 0.006 -0.242 6.016 0.473 0.515
FP3 38 0.080 0.007 -0.202 2.476 0.500 0.229
FP4 27 0.083 0.012 0.319 3.131 0.417 0.153
FP5 28 0.116 0.013 -0.343 2.339 0.364 0.525
FP6 43 0.070 0.006 -0.460 2.824 0.500 0.322
FC1 28 0.107 0.005 0.076 2.583 0.380 0.527
FC2 29 0.073 0.013 1.028 5.076 0.222 0.239
FC3 42 0.073 0.009 1.589 8.805 0.028 0.269
FC4 36 0.082 0.006 0.289 3.022 0.500 0.279
FC5 44 0.071 0.005 -0.196 2.552 0.269 0.310
FC6 29 0.094 0.011 -0.029 2.357 0.500 0.309
Table 6: Parametric description of the male Syllabic PD
and HC distributions, sequence […pataka…].
Code Ints Mean StdDev Skew Kurt p-vLil JSD
MP1 37 0.044 0.010 0.299 3.017 0.500 0.350
MP2 47 0.070 0.024 1.666 7.982 0.002 0.300
MP3 35 0.065 0.013 -0.270 2.748 0.277 0.286
MP4 52 0.058 0.015 0.014 2.034 0.275 0.117
MP5 35 0.065 0.012 -0.207 2.779 0.500 0.288
MP6 58 0.066 0.021 0.325 2.570 0.074 0.169
MC1 52 0.067 0.027 1.233 4.706 0.041 0.123
MC2 46 0.069 0.026 2.367 8.017 0.001 0.232
MC3 52 0.046 0.014 0.900 4.940 0.200 0.253
MC4 78 0.060 0.017 0.561 3.981 0.384 0.096
MC5 36 0.045 0.011 0.090 2.287 0.374 0.283
MC6 55 0.068 0.018 0.269 2.485 0.166 0.224
Table 7: Parametric description of the male Silence PD an
d
HC distributions, sequence […pataka…].
Code Ints Mean StdDev Skew Kurt p-vLil JSD
MP1 36 0.080 0.021 3.330 17.749 0.001 0.247
MP2 46 0.071 0.028 3.214 17.040 0.001 0.368
MP3 34 0.090 0.017 -0.705 2.644 0.001 0.233
MP4 51 0.062 0.007 -0.334 3.315 0.500 0.503
MP5 34 0.090 0.017 -0.703 2.645 0.001 0.235
MP6 57 0.083 0.028 4.117 23.219 0.001 0.259
MC1 51 0.073 0.029 1.388 5.587 0.007 0.278
MC2 43 0.058 0.018 0.184 3.022 0.233 0.440
MC3 51 0.091 0.018 5.351 35.660 0.001 0.280
MC4 76 0.074 0.021 0.133 3.488 0.114 0.177
MC5 35 0.098 0.011 0.423 2.487 0.420 0.335
MC6 54 0.096 0.043 5.962 40.379 0.001 0.223
Table 8: Parametric description of the female Syllabic PD
and HC distributions, sequence […pataka…].
Code Ints Mean StdDev Skew Kurt p-vLil JSD
FP1 45 0.065 0.020 0.134 3.594 0.266 0.371
FP2 68 0.056 0.017 0.454 2.661 0.277 0.129
FP3 37 0.056 0.021 0.912 3.981 0.278 0.138
FP4 33 0.072 0.011 -0.043 2.404 0.500 0.498
FP5 30 0.072 0.018 -0.919 4.466 0.247 0.489
FP6 61 0.053 0.020 0.228 1.881 0.004 0.245
FC1 38 0.047 0.008 -0.145 2.794 0.500 0.191
FC2 49 0.043 0.014 0.313 2.208 0.500 0.187
FC3 38 0.044 0.009 0.141 3.405 0.378 0.212
FC4 24 0.055 0.010 -0.622 2.704 0.342 0.231
FC5 52 0.057 0.016 0.569 2.527 0.088 0.132
FC6 35 0.058 0.022 0.357 2.846 0.500 0.263
An important estimate to be considered in analysing
the data presented in Table 2 to Table 9 is the average
of each sequence interval mean accordingly to
gender, condition, sequence, and exercise type, as
given in Table 10. The smaller and larger interval
duration averages in seconds are given in bold.
Performance of Monosyllabic vs Multisyllabic Diadochokinetic Exercises in Evaluating Parkinson’s Disease Hypokinetic Dysarthria from
Fluency Distributions
119

Table 9: Parametric description of the female Silence PD
and HC distributions, sequence […pataka…].
Code Ints Mean StdDev Skew Kurt p-vLil JSD
FP1 44 0.088 0.035 2.854 12.121 0.001 0.146
FP2 67 0.095 0.052 2.774 11.722 0.001 0.120
FP3 37 0.101 0.027 1.682 8.820 0.002 0.424
FP4 32 0.065 0.017 0.370 2.048 0.046 0.300
FP5 29 0.127 0.031 1.217 4.653 0.056 0.588
FP6 60 0.075 0.040 3.923 21.516 0.001 0.309
FC1 37 0.086 0.014 -0.060 1.823 0.151 0.231
FC2 47 0.081 0.026 2.125 7.966 0.001 0.094
FC3 37 0.061 0.008 -0.142 4.521 0.500 0.419
FC4 23 0.074 0.008 -0.536 3.211 0.500 0.204
FC5 51 0.077 0.022 3.490 21.763 0.001 0.116
FC6 34 0.087 0.020 3.084 15.917 0.001 0.235
Table 10: Interval averages in ms by category (out of 1964
syllabic and 1913 silence intervals).
#Col Gen. Cond. Seq. Exer. Averages (ms)
1 M HC Syl. tatata 0.077
2 M HC Syl.
p
ataka 0.059
3 M HC Sil. tatata 0.090
4 M HC Sil.
p
ataka 0.082
5 M PD S
y
l. tatata 0.070
6 M PD Syl.
p
ataka 0.061
7 M PD Sil. tatata 0.088
8 M PD Sil.
p
ataka 0.079
9 F HC S
y
l. tatata 0.078
10 F HC S
y
l.
p
ataka 0.051
11 F HC Sil. tatata 0.083
12 F HC Sil.
p
ataka 0.078
13 F PD Syl. tatata 0.074
14 F PD S
y
l.
p
ataka 0.062
15 F PD Sil. tatata 0.087
16 F PD Sil.
p
ataka 0.092
Table 11: Number of samples not rejecting Lilliefors'
normality hypothesis test (out of 48).
Category
Type #Samples Percent (%)
By Exercise tatata 42 87.5
pataka 28 58.3
By Sequence Sil. 31 64.6
Syl. 39 81.3
By Gender F 36 75.0
M 34 70.8
By Condition HC 37 77.1
PD 33 68.8
The number of sample utterances not rejecting H0
according to the categories of exercise, sequence,
gender, and condition is given in Table 11.
A summary of the regularity of each subset in
terms of number of distributions not rejecting the null
hypothesis, and their comparisons with respect to the
HC averages is given in Table 12.
Table 12: Results of comparing the JSD and StdDev wit
h
the HC subset averages. #Norm: number of samples no
t
rejecting the normality hypothesis. #>AvJSD: number o
f
samples over the average JSD of the HC subset. #>AvStd:
Idem over the average StdDev of the HC subset.
# Exer. Seq. Gen. Cond.#Norm #>AvJSD #>AvStd
1 tatata Sil. F PD 6 3 2
2 tatata Sil. F HC 5 1 3
3 tatata Syl. F PD 5 2 3
4 tatata Syl. F HC 5 3 2
5 tatata Sil. M PD 6 3 0
6 tatata Sil. M HC 6 2 1
7 tatata Syl. M PD 4 4 1
8 tatata Syl. M HC 5 2 3
9 pataka Sil. F PD 1 4 6
10 pataka Sil. F HC 3 3 3
11 pataka Syl. F PD 5 4 5
12 pataka Syl. F HC 6 3 3
13 pataka Sil. M PD 1 2 2
14 pataka Sil. M HC 3 2 2
15 pataka Syl. M PD 5 4 2
16 pataka Syl. M HC 4 4 2
4 DISCUSSION
The review by exercise, condition, gender and
sequence is explained in what follows. It may be seen
in Figure 2, corresponding to the monosyllabic
repetition […tatata…], that contrary to expectations,
the HC distributions are more spread and over their
average distribution (in red) than the PD counterparts,
which are slender (concentrated). This observation
may be related with the effects of repetitive regular
cue rates in stabilizing the movements in PD patients
(Harrison, Horin and Earhart, 2019). The sequence
distribution of silence intervals in Figure 3, shows a
similar behaviour, the HC distributions being more
widespread than that of PD participants. Interestingly,
the sequence distributions of syllable intervals in
Figure 4 by female participants shows little dispersion
and good alignment with the average of HC
distributions. The situation is completely different
regarding the sequence distributions of silence
intervals shown in Figure 5, which shows a much less
organized pattern of more widespread distributions.
When examining the results of the multisyllabic
exercise […pataka…] the distributions become more
widespread, and many of them exhibit multimodal
behaviour, something not observed in the
monosyllabic exercise. This behaviour may be seen
in Figure 6 and Figure 7, corresponding to syllable
and silence sequence distributions from the male HC
BIOSIGNALS 2021 - 14th International Conference on Bio-inspired Systems and Signal Processing
120

and PD datasets, although in this last figure the PD
distributions are more regularly aligned than the HC
counterpart. Figure 8 shows the syllable sequence
distributions from females, and in this case the HC
subset is more regular than the PD subset. This
behaviour is also evident in Figure 9, where the PD
subset is much less organized than the HC. This could
be a consequence of the less regularity observed in
the repetitive pattern when multisyllabic repetition is
required.
The visual information provided by figures is
complemented with the tabulated parameters from
each distribution given in Table 2 to Table 9.
Additional relevant information is provided, as the
number of intervals produced by each speaker, which
depends on different factors, respiratory capacity
among them. Table 2 shows that the smallest and
largest number of intervals, means and dispersion
correspond to different members of the PD and HC
subsets, respectively. The largest JSD corresponds to
a PD participant, and the smallest to an HC one. Two
distributions reject the null hypothesis in the PD
subset (MP1, which shows the smallest syllabic
interval mean, and the largest JSD to the HC average).
The examination of Table 3 shows that the smallest
and largest number of intervals and means correspond
to a member of the PD and the HC, respectively. The
largest JSD is from a PD participant, and the smallest
one from an HC participant. In this case, none of the
distributions reject the null hypothesis. Table 4 shows
a similar behaviour regarding the number of intervals
and their means, but the situation is quite different as
far as JSD is concerned. In this last case, the smallest
and largest distances are found in the PD dataset. The
number of distributions rejecting the null hypothesis
is two, one in the PD dataset and one in the HC
dataset. The situation reported in Table 5 shows that
the smallest number of intervals is produced by a
member of the PD subset, and the largest by an HC
member, but the smallest and largest interval means
correspond to members from the PD subset. Contrary
to what may have been expected, the largest JSD
corresponds to a member of the HC subset, and the
shortest JSD to a member of the PD subset (FC1). The
reason has to be found in the separation of the silence
sequence distribution of FC1 with respect to the HC
subset average. The number of distributions rejecting
H0 is two, one from the PD subset, and one from the
HC subset. The multisyllabic exercises reflect a more
irregular situation. Table 6 shows that the smallest
and largest number of intervals correspond to the PD
and HC subsets, respectively. The smallest and
largest means are both from the PD subset. The
smallest and largest standard deviations are from the
PD and HC subsets, respectively. The largest and
smallest JSDs are from the PD and HC subsets,
respectively. The number of distributions rejecting
the null hypothesis is three, one from the PD and two
from the HC subsets. But the situation becomes much
more irregular when examining the distributions of
the silence intervals given in Table 7. Whereas the
smallest and largest number of intervals correspond
to the PD and HC subsets, respectively, the smallest
and largest means are both from the HC subset. The
largest and smallest JSDs are from the PD and HC
subsets, as it could be expected, but the number of
distributions rejecting the null hypothesis is eight,
five from the PD subset and three from the HC subset.
Would this mean that males have more problems in
separating syllables in a regular way when facing a
multisyllabic exercise? Table 8 shows a less irregular
situation, although the largest and smallest number of
intervals are produced by members of the PD subset,
whereas the largest and smallest means correspond to
two members of the PD subset and a member of the
HC subset, respectively. The largest and smallest
JSDs are produced by two distributions of the PD
subset. Only one distribution from the PD dataset
rejects the null hypothesis. Finally, the situation
described in Figure 9 shows again an irregular
behaviour as far as the separation of syllables by
females facing multisyllabic repetitions is concerned.
Contrary to what could be expected, the largest and
smallest numbers of intervals were produced by a PD
subset member and by an HC one, respectively. The
largest and smallest silence interval mean duration
were produced by two members of the PD subset. The
largest and smallest JSDs corresponded to a PD
subset member and to an HC member, respectively.
But the most remarkable observation is that the
number of distributions rejecting the null hypothesis
is again eight, five from the PD subset, and three from
the HC subset, showing a striking resemblance with
the male cases described in Table 7.
The averages of all speakers’ mean interval
duration are summarized Table 10 by gender,
condition, duration sequence, and exercise. It may be
observed that in all cases but one, the average
duration of syllables and silences from the
monosyllabic exercise are longer than those from the
multisyllabic exercise, with the exception of the
silence sequences produced by female PD
participants (rows 15 vs 16). The duration of syllables
is shorter than the duration of silences comparing by
Performance of Monosyllabic vs Multisyllabic Diadochokinetic Exercises in Evaluating Parkinson’s Disease Hypokinetic Dysarthria from
Fluency Distributions
121

gender and condition. Compare for instance, row 1
against row 3 (0.077 ms vs 0.090 ms), and row 2
against row 4 (0.059 ms vs 0.082 ms). The results
given in 0 help in explaining the regular behaviour of
the data derived from the two diadochokinetic
exercises, in terms of the statistical characteristics of
their interval distributions. The largest number of
sequences with distributions not rejecting the
normality hypothesis is attributed to the sequence
[…tatata…], whereas […pataka…] produced less
distributions fulfilling the same condition. This fact
explains the difficulty of HC and PD participants in
producing regular intervals when facing a relatively
more complicate exercise. Interpreting the normality
behaviour of distributions as a hallmark of regularity,
the most regular subsets correspond to silence
intervals from the monosyllabic exercise. The
multisyllabic exercise produced more normal-like
distributions for syllable than for silence intervals.
Therefore normality tests to differentiate PD from HC
behaviour might work better with the multisyllabic
exercise than with the monosyllabic one. In this same
respect, assuming that the JSD would be used as a
feature, the most efficient exercises would correspond
to the ones marked in bold in column #>AvJSD
(number of PD participants producing a JSD larger
than the average of the HC subset, compared to HC
participants, as given by rows 7 vs 8, 9 vs 10 and 11
vs 12, where the number of participants from the PD
subset showing larger JSDs are well over the number
of HC participants in the same case. Proceeding
similarly with respect to standard deviations, as given
in column #>AvStd, the most differentiating
conditions are the ones given by row 9 vs 10 and 11
vs 12. Therefore, the best candidates to be checked in
a further study would be the syllabic interval
durations from the monosyllabic exercise in the case
of males, and the syllabic and silence interval
durations from the multisyllabic exercise in the case
of females.
It might be inferred from what has been exposed
that fast purely repetitive exercises provide a timely
cadence to PD participants which help them in
successful fast repetition. On the contrary, mixed-
syllable exercises require a conscious control of
syllable sequence repetition (sequence planning and
executing), presenting an added difficulty for HC and
PD participants, but HC participants seem to utter the
multisyllabic sequence faster. The added difficulty
found in the multisyllabic exercise may be related to
the extra difficulty found in executing the neuromotor
changes implied in the articulation from bilabial [pa]
(orofacial) to apical-alveolar [ta] (lingual) and dorsal-
velar [ka] (lingual-pharyngeal), involving quite
different muscular systems. These facts which would
explain the complete differential behaviour in
exercise planning and execution, from the purely
repetitive to the alternating planning, and the control
of complete different neuromotor pathways and units.
The main weakness of this study is its non-
conclusive character, as the data sample examined is
quite low, but it has an exploratory value to initiate a
larger scale study. The slightly difference in the age
range of HC and PD participants might introduce
some bias in the comparisons as well, this fact
needing a further study as highlighted by Gómez et
al., 2019.
5 CONCLUSIONS
The study of the potential capabilities of repetitive
spoken diadochokinetic exercises might derive
important benefits to plan speech databases and
machine learning methods to characterize PD. The
main findings in this study are the following:
Multisyllabic exercises appear to have more
discriminatory power compared to monosyllabic
exercises when it comes to assessing PD vs HC..
PD participants would produce good and regular
syllable and inter-syllable intervals, and at a faster
repetition rate when monosyllabic exercises are
concerned. This fact should be carefully
considered when analysing the differentiation
capability of monosyllabic exercises.
On the contrary, PD participants could face more
difficulties when multisyllabic exercises are used,
therefore these exercises should be prioritized
when used combined with other diadochokinetic
exercises in test design and analysis.
The statistical behaviour of syllabic and inter-
syllabic interval sequence durations of
multisyllabic exercises deviates from normality,
therefore the statistical evaluation of these tests
must stand on non-parametric methods.
JSDs seem to be sufficiently sensitive to be used
in establishing standard syllable and silence
interval durations from distance estimations
among duration distributions.
This last aspect was not included per se as an
objective of the study, however the methodology we
have used does not rely on expensive high quality
equipment that most studies in the field rely on. This
concept is very much aligned with the spirit of the
Parkinson’s Voice Initiative (PVI), see Arora, Bahai-
Ravary and Tsanas, 2019, and the exploration of work
BIOSIGNALS 2021 - 14th International Conference on Bio-inspired Systems and Signal Processing
122

trying to facilitate low-cost, robust assessment of PD
using readily available means. In this sense we are
working on extending these findings on the PVI
database.
ACKNOWLEDGEMENTS
This work is being funded by grants TEC2016-
77791-C4-4-R from the Government of Spain, and
CENIE_TECA-PARK_55_02 INTERREG V-A
Spain – Portugal (POCTEP).
REFERENCES
Alku, P., Murtola, T., Malinen, J., Kuortti, J., Story, B.,
Airaksinen, M., Salmi, M., Vilkman, E., Geneid, A.,
2019. OPENGLOT-An open environment for the
evaluation of glottal inverse filtering, Speech
Communication 107 38-47, doi:
10.1016/j.specom.2019.01.005
Arora, S., Baghai-Rivary, L., and Tsanas, A., 2019.
Developing a large scale population screening tool for
the assessment of Parkinson’s disease using telephone-
quality voice. Journal of the Acoustical Society of
America, Vol. 145, pp. 2871-2884.
Brabenec, L., Mekyska, J., Galaz, Z., and Rektorova, I.,
2017. Speech disorders in Parkinson's disease: early
diagnostics and effects of medication and brain
stimulation. J. Neural Transm., vol. 124:3, pp. 303–
334.
Cover, T. M. and Thomas, J. A., 2006. Elements of
information theory, Wiley, New York.
Dauer, W. and Przedborski S., 2003. Parkinson's disease:
Mechanisms and models. Neuron, vol. 39, pp. 889–909
Dimitriadis, D., Potamianos, A., and Maragos, P., 2009. A
comparison of the Squared Energy and Teager-Kaiser
Operators for Short-Term Energy Estimation in
Additive Noise. IEEE Trans. on Sig. Proc., vol. 57, No.
7, pp. 2569-2581.
De Lau, L. M. and Breteler, M. M., 2006. Epidemiology of
Parkinson’s disease. The Lancet Neurology 5, pp. 525–
535.
Duffy, J. R., 2013. Motor Speech Disorders, Elsevier, River
Lane, St. Louis, Missouri, US.
Gómez, A., Palacios, D., Ferrández, J. M., Mekyska, J.,
Álvarez, A., and Gómez, P., 2019. A Methodology to
Differentiate Parkinson’s Disease and Aging Speech
Based on Glottal Flow Acoustic Analysis. Int. Journal
of Neural Systems, Vol. 30, 205558.
Harrison, E. C., Horin, A. P., and Earhart, G. M., 2019.
Mental Singing Reduces Gait Variability More than
Music Listening for Healthy Older Adults and People
With Parkinson Disease. JNPT, Vol. 43, 2019, pp. 204-
211.
Karlsson, F., Schalling, E., Laakso, K., Johansson, K. and
Hartelius, L., Assessment of speech impairment in
patients with Parkinson’s disease from acoustic
quantifications of oral diadochokinetic sequences.
Journal of the Acoustical Society of America, vol. 147,
pp. 839-851.
Palacios, D., Meléndez, G., López, A., Lázaro, C., Gómez,
A., and Gómez, P., 2020. MonParLoc: A Speech-
Based System for Parkinson’s Disease Analysis and
Monitoring. IEEE Access, vol. 8, pp. 188243-188255
doi: 10.1109/ACCESS.2020.3031646.
Parkinson, J., 1817. An Essay on the Shaking Palsy. J.
Neuropsychiatry Clin. Neurosci, Vol. 14:2 pp. 223-236.
Ricciardi et al., 2016 (Re-edited in Neuropsychiatry
Classics from the 1817 monograph, by Sherwood,
Neely and Jones).
Ricciardi, L., Ebreo, M., Graziosi, A., Barbuto, M.,
Sorbera, C., Morgante, L., and Morgante, F., 2016.
Speech and gait in Parkinson’s disease: When rhythm
matters. Park. Relat. Disord., vol. 32, pp. 42–47.
Simard, R. and L’Ecuyer, P., 2011. Computing the Two-
Sided Kolmogorov-Smirnov Distribution. Journal of
Statistical Software, Vol. 39:11, pp.
Tsanas, A., 2012. Accurate telemonitoring of Parkinson’s
disease symptom severity using nonlinear speech signal
processing and statistical machine leaning. PhD.
Thesis, U. of Oxford, U.K., June 2012.
Ziegler, W., 2002. Task-Related Factors in Oral Motor
Control: Speech and Oral Diadochokinesis in
Dysarthria and Apraxia of Speech. Brain and Language,
vol. 80, pp. 556-575.
Performance of Monosyllabic vs Multisyllabic Diadochokinetic Exercises in Evaluating Parkinson’s Disease Hypokinetic Dysarthria from
Fluency Distributions
123
