
Convolutional Neural Network for Elderly Wandering Prediction in
Indoor Scenarios
Rafael F. C. Oliveira
a
, Fabio Barreto
b
and Raphael Abreu
c
Centro Universit
´
ario Unilasalle do Rio de Janeiro, Niter
´
oi, Brazil
Keywords:
Machine Learning, Data Generation, Wandering, Alzheimer, Internet of Things.
Abstract:
This work proposes a way to detect wandering activity of Alzheimer’s patients from path data collected from
non-intrusive indoor sensors around the house. Due to the lack of adequate data, we’ve manually generated a
dataset of 220 paths using our own developed application. Wandering patterns in the literature are normally
identified by visual features (such as loops or random movement), thus our dataset was transformed into
images and augmented. Convolutional layers were used on the neural network model since they tend to have
good results finding patterns specially on images. The Convolutional Neural Network model was trained with
the generated data and achieved an f1 score (relation between precision and recall) of 75%, recall of 60%, and
precision of 100% on our 10 sample validation slice.
1 INTRODUCTION
Alzheimer is a type of dementia, characterized as
a neurodegenerative disease that affects especially
memory and behaviour. Wandering is one of the
most common behavioural problems of Alzheimer’s
patients as seen in (Teri et al., 1988).
Alzheimer’s patients should be monitored at home
to prevent accidents and moderate changes in the pa-
tient’s behaviour, such as agitation, aggression and
wandering behaviour (Ballard et al., 2009). This task
is usually done by family members or contracted pro-
fessionals. In particular, the family caregiver is more
susceptible to several pathologies due to the impact
that this task has on the deprivation of time and its
activities (Radziszewski et al., 2017).
In the current context, the COVID-19 pandemic
has increased even more the necessity to moni-
tor Alzheimer patients, because they eventually suf-
fer from anxiety and even increased health risks
(Boutoleau-Bretonni
`
ere et al., 2020). Which in turn,
contributes to the caregiver burden.
Since wandering behaviour is most times coupled
with agitation in Alzheimer patients (Ballard et al.,
2009), a system that automatically and correctly de-
tects wandering behaviour in a smart-home can take
a
https://orcid.org/0000-0002-0346-3073
b
https://orcid.org/0000-0003-4842-5238
c
https://orcid.org/0000-0001-5917-6113
actions to alleviate the agitation of the elderly, or trig-
ger events to inform the caregiver that the elderly is
wandering. There are a variety of interventions to
reduce agitation in elderly people with Alzheimer.
Some of them can be automated inside a smart-home
scenario. Such as aroma, music and lights (O’Neil
et al., 2011). Thus, by utilizing a smart-home to per-
form such tasks, a system can alleviate some of the
caregiver burden.
Therefore a prerequisite to such a system is to cor-
rectly detect a wandering behaviour. This work pro-
poses a machine learning technique for identifying
wandering patterns. The focus of the paper being the
detection of wandering in an indoor scenario.
By observing the difficulties faced by caregivers in
monitoring Alzheimer patients, the necessity of con-
tinuous supervision was noticed and it highlights the
importance of this work. By using the Internet Of
Things (IoT) (Karimi and Atkinson, 2013), we could
obtain the movement data of the elderly in a non-
intrusive way, however, due to the massive quantity
of data, it’s hard to identify wandering patterns.
In Figure 1 we have 6 different patterns of move-
ments between point A and a point B. It was identified
that some of these patterns were more present in wan-
dering than normal activity (Martino-Saltzman et al.,
1991), (Delaunay and Gu
´
erin, 2017). In Figure 1 (a)
the first pattern is present in both wandering and non-
wandering movements, but mostly in non-wandering
movement. So it was not associated as a wandering
Oliveira, R., Barreto, F. and Abreu, R.
Convolutional Neural Network for Elderly Wandering Prediction in Indoor Scenarios.
DOI: 10.5220/0010379902530260
In Proceedings of the 14th International Joint Conference on Biomedical Engineering Systems and Technologies (BIOSTEC 2021) - Volume 5: HEALTHINF, pages 253-260
ISBN: 978-989-758-490-9
Copyright
c
2021 by SCITEPRESS – Science and Technology Publications, Lda. All rights reserved
253
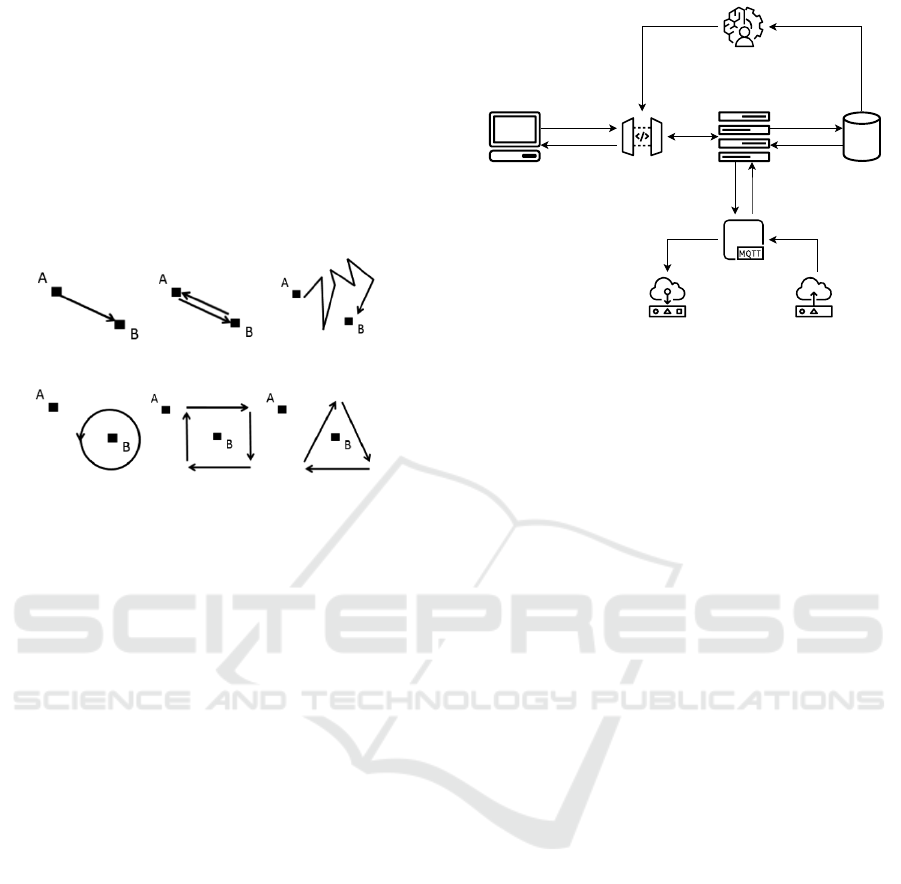
activity, differently from the other two patterns of this
figure, pacing, and random. Figure 1 (b) shows the
most likely patterns of wandering movements called
lapping, where the movement turns on a loop around
a point.
Due to the lack of data of normal and wander-
ing movement in the same scenario, we’ve reproduced
manually the likely wandering patterns represented in
Figure 1 to create the anomalous activity data and also
normal data mostly composed of direct movements.
(a) Direct, pacing and random.
(b) Lapping.
Figure 1: Wandering and non-wandering movement pat-
terns (Delaunay and Gu
´
erin, 2017).
Thus, in this work is proposed a method that can
based on the estimated recent position with IoT and a
neural network model for the deep learning approach,
infer the patient stress so that we can act in trying to
mitigate the negative effects of it. It is hoped that this
can be an important tool to help caregivers and rela-
tives of Alzheimer’s patients.
Even though this work reaches especially the ma-
chine learning part of the project, to understand it is
crucial to have an overview of the entire system’s ar-
chitecture. The system’s architecture represented in
Figure 2 is divided into seven components, each one is
part of the flow from the client to data capturing. The
Client is the interface of access and system’s config-
uration, REST API (Masse, 2011) is a double way to
communicate with other components. With that, the
client can request to the API, data from the machine
learning engine and NoSQL Database (Han et al.,
2011). Temporal data from the database is analyzed
and used to create a predictive model that can infer
stress activities in Machine Learning Engine, which
is the one that was approached in more depth by this
work. Treatment of the sensors data, data fusion be-
tween sensors, and intermediate system communica-
tions are the roles of the controller. The controller
treats the data, by analyzing the raw simple sensors
activations around the house and, with data aggre-
gation, generates the path of the elderly that will be
used to identify anomalies. Raw and treated data are
MQTT
Broker
Actuators Sensors
Control
DatabaseClient API Rest
Machine Learning Engine
Figure 2: Architecture of the system.
stored in the Database. The data is captured through
non-intrusive sensors such as distance, presence, pres-
sure sensors. It is the sensor part of the IoT module,
in which direct communication protocol between de-
vices is done with the Message Queuing Telemetry
Transport(MQTT) interface (Light, 2017). Also in
the IoT module, we have the actuators which are re-
sponsible to help to mitigate the elderly stress, being
able to produce aromas, and turn on and off the lights.
The work shown in this paper is based on this entire
architecture. With this, our work presents a method
to utilize machine learning to detect wandering using
data coming only from non-intrusive sensors.
This work is organized as follows, the related
work of IoT monitoring and the use of machine learn-
ing will be shown in Section 2. Section 3 overviews
the application developed for the data generation and
the composition of the data used in our learning struc-
ture. Section 4 approaches the data pre-processing
and the construction of our neural network model. In
Section 5 we discuss the performance of our model
and experiments. Finally, in Section 6 we show fu-
ture applications and conclude our work.
2 RELATED WORK
As stated in (Ord
´
o
˜
nez and Roggen, 2016), human ac-
tivity recognition (HAR) is based on the assumption
that specific body movements translate into charac-
teristic sensor signal patterns, which can be sensed
and classified using machine learning techniques. The
use of machine learning was already present in activ-
ity tracking, an example is (Akbar et al., 2019) that
uses data from wearable sensors such as a wristband
for heart rate monitoring and neural networks to learn
sleep patterns of the users, in order to turn off the
HEALTHINF 2021 - 14th International Conference on Health Informatics
254

lights after they fall asleep. And as well in (Oniga
and S
¨
ut
˝
o, 2014), IoT data is used to train an artificial
neural network model that, given the information of
the arm and body pose of the patient, it could track
activities such as the walking movement or even pre-
dict if the user was sitting down.
(Khan et al., 2018) surveys and compare the liter-
ature about agitation and aggression detection. The
tracking modalities presented was by using wear-
able devices, computer vision and multimodal, it also
presents a correlation between agitation and aggres-
sion in dementia patients and actigraphy. Relating this
overview of papers to our work, we focus on the well-
being of the patient by assuming that the ambient only
employs sensor-tracking. That the elderly do not need
to wear, neither feel the hostility of a camera watching
him.
In (Vogado et al., 2020) CNN (Convolutional
neural network) is used to help the diagnostic of
leukemia, using images of blood smears, comple-
mented with the application of transfer learning and
data augmentation techniques, reaching a result of
98.28% of accuracy. Compared to our work, we use
CNNs that can detect anomalies in images and also
the use of data augmentation to generate more data.
In (Amin et al., 2020a) and (Amin et al., 2020b),
machine learning is used to detect brain tumors.
(Amin et al., 2020a) uses CNNs and (Amin et al.,
2020b) autoencoders to approach the problem. They
were trained and evaluated using BRATS challenges
databases and had good results in comparison to the
literature. In relation to our work, we similarly have
an image classification problem. However, in the
work of (Amin et al., 2020a), the CNN has 14 lay-
ers whereas our networks have only 4 layers.
(Doughty et al., 1998) proposes a system to mon-
itor patients with dementia using non-intrusive sen-
sors to track their activities. The way used to detect
wandering was by counting event activations such as
sitting down, moving to the chair, opening and clos-
ing drawers, and then calculating a score based on re-
peated events 5 minutes. The advantage of the Ma-
chine Learning approach, proposed in our work, is the
easy adaptability to the patient. Our method is based
not only on repetitions but on any data pattern in the
movement. With the advantage of adapting to new
patterns if needed.
Contrasting to related work, our method focus on
predicting wandering using sensing information col-
lected in a non-intrusive way. Similar to (Doughty
et al., 1998), but coupled with a machine learning ap-
proach which makes possible the detection of known
patterns in the literature such as (Martino-Saltzman
et al., 1991). Also, being able to detect other patterns
by the data distribution with the machine learning en-
gine and having a lightweight architecture, capable of
running on an IoT device.
3 DATASET
Due to the lack of indoor datasets containing normal
and anomalous activity, the data generation strategy
was adopted similar to the one presented in (Arifoglu
and Bouchachia, 2017). Therefore, an application to
simulate these paths was developed. With our tool,
the user can manually insert, annotate and visualize
movement data point-by-point, without the need of a
real patient. With this tool, we generated movement
patterns of wandering and normal activity.
In order to make easier the work of data gener-
ation, we’ve created a web application, as shown in
Figure 3. In the application, we can upload a floor
plan image and set the points in the ground floor plan.
Every point represents a sensor reading indicating the
position of the patient. In this application we defined
the interval of analysis of every path created to be
hourly, since a path is a group of points with this de-
limiter, we can classify the entire hour path as wan-
dering or normal activity. Is important to note that
although the generated data of the datasets were syn-
thetic and don’t represent the real world, they were
generated to simulate the real-world scenario. Since
the architecture of the neural network is simple and
robust, it is expected that it generalizes in the real
world with real data in a similar manner as the work
of (Arifoglu and Bouchachia, 2017) does.
As seen in Figure 3, on the left we have the ground
floor plan and on the right the statistics created to help
to monitor the data balance, such as the number of
hours with wandering and normal activity. The visual
part of the application was developed using Vue.js,
Vue Material, and bootstrap libraries. The ground
floor plan and the points mechanism P5.js library was
used, which simplifies the JavaScript canvas. The ap-
plication is available at https://github.com/Unilasalle-
SmartCare/smartcare-frontend.
The created data using our application was ex-
ported in JavaScript Object Notation (JSON) (Sever-
ance, 2012) format. The file structure is based on an
array of objects, where each object represents a lo-
cation point in the environment, each point consists
of four attributes. ’x’ and ’y’ represents it’s respec-
tive coordinates in the ground floor plan image start-
ing from the upper left. The ’date’ attribute, which
date and hour the point belongs. Each point has the
attribute stress that indicates if the elderly is wander-
ing. Even though each point has the attribute stress,
Convolutional Neural Network for Elderly Wandering Prediction in Indoor Scenarios
255

Figure 3: Developed application for data generation. The user interacts with the floor-plant to place movement points, define
the hour of the movement and if it was wandering. On the right side of the page shows the statistics created to visualize the
generated data. In the upper right a menu that shows all the registered movement dates and hour.
the application considers a time interval to account for
a wandering activity. It is not able to have two points
in the same time interval with different stress values.
In order to know where the movement starts and ends,
the points of the same data and interval are inserted in
the order as the elderly movement.
With the application, we developed two datasets.
The first is a train/test dataset and the second is a val-
idation dataset. The generated train/test dataset con-
sists of a total of 200 hours, being 100 hours of nor-
mal activity and 100 hours of stress. As seen in table
1, they are sliced into training and test part being re-
spectively 75% and 25%. The validation dataset to be
used in the evaluation of our machine learning model
is consisted of 20 hours, being 50% anomalous activ-
ity and the other 50% normal activity. The composi-
tion can be seen in more depth in table 2.
For the purpose of generating consistent anoma-
lous data, patterns present in (Martino-Saltzman et al.,
1991), (Delaunay and Gu
´
erin, 2017) were reproduced
manually using our developed data generation ap-
plication. We assumed normal movement as being
not anomalous or random. The patterns classified as
anomalous are Lapping and Pacing, seen in (Martino-
Saltzman et al., 1991). Random patterns are described
by (Martino-Saltzman et al., 1991) as roundabout or
haphazard travel to many locations within an area
without repetition and is mostly composed of direct
movements.
Table 1: Distribution of the train/test dataset.
Movement Type # Samples
Lapping 59
Random 11
Pacing 30
Normal 100
Table 2: Distribution of the validation dataset.
Movement Type # Samples
Lapping 7
Random 2
Pacing 1
Normal 10
4 IMPLEMENTATION
Data Processing. With the generated dataset, it’s
still needed to do some processing in order to use our
artificial neural network model (ANN). First, all the
points were grouped by their date and hour. Then, the
points were converted to grayscale images. To create
such images, each point is converted and placed in the
corresponding location on the image and a straight
line is plotted between two adjacent points. As seen
in Figure 4, the resulting image shows a stroke where
the patient moved in each hour.
Each pixel of an image consists of a value between
0 and 255. To make the values smaller and faster for
our model, we normalized the pixels to be between
0 and 1, maintaining the distribution and ratio of the
data. Since the images have the resolution of the
ground floor plan, it would be a waste of resources
to give to the model big images with very small
features and it would impair the generalization of
the model. To account for the aforementioned prob-
lems, the images were rescaled to 128x128 resolution.
Data Augmentation. Even with the generated dataset
we do not have much data. In order to prevent overfit-
ting and help the model generalization, we used data
augmentation techniques. As seen in Figure 5, each
train image generates more training images.
HEALTHINF 2021 - 14th International Conference on Health Informatics
256
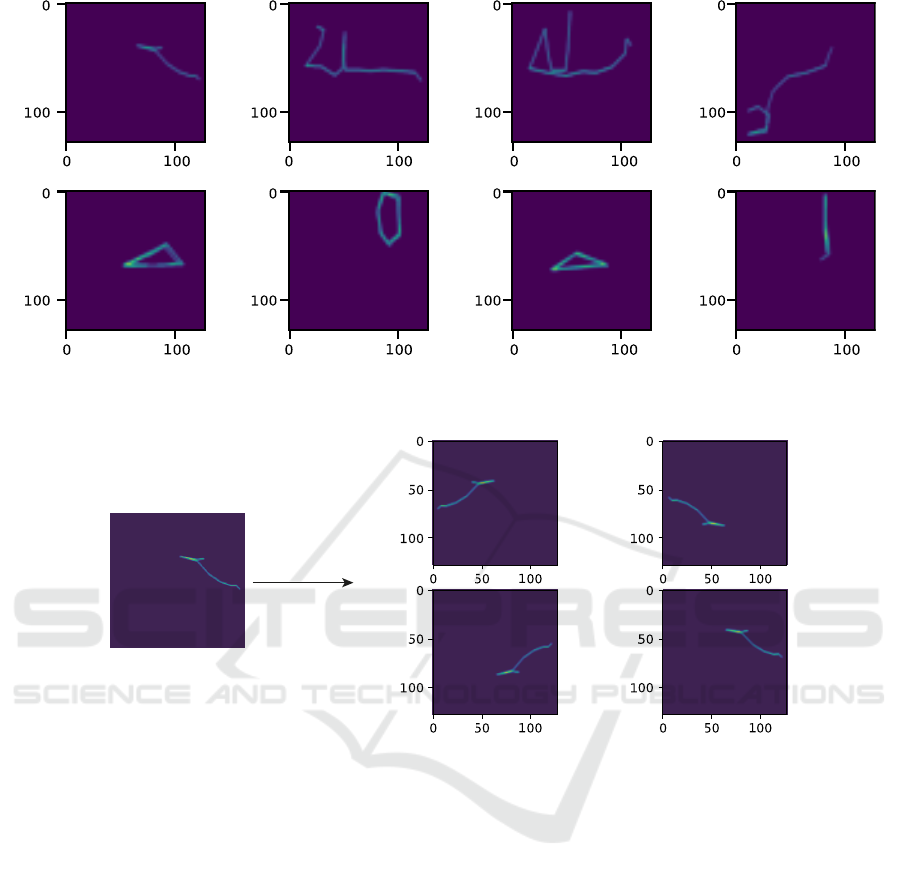
Figure 4: Samples of the path data plotted as images after rescaling.
Original Image
Augmentated Images
Figure 5: Data augmentation technique applied in movement path.
Differently from (Vogado et al., 2020) where
zoom and shearing were applied to the new images,
we only rotated each image to a maximum interval of
3 degrees and randomly flipped vertically and hori-
zontally.
Artificial Neural Network Model. By using path
images, it was seen that the Convolutional Neural
Network (CNN) approach could be an interesting
idea. Since it could identify the anomalous movement
activities by learning the shapes and pixel distribution
of the paths. The CNN architecture is presented in
Figure 6. In the Figure, the processed image is given
as input and goes into a convolutional layer (conv
1
)
with a filter size of 32, filtering is used to highlight
features of the input. Max pooling is applied to re-
duce the dimensionality and make the neural network
training faster, and then the output is flattened into an
array. After that, we have three fully connected lay-
ers (FC
1
,FC
2
, and FC
3
). Being the last one the out-
put of our network between 0 and 1, which represents
whether the input path is predicted as wandering or
not. To avoid overfitting, we randomly dropped 25%
of the hidden units between the fully connected layers
(FC
1
and FC
2
) (Srivastava et al., 2014).
For the prediction, it is used the backpropagation
algorithm that on training, a process where the net-
work is fed with training data to learn. The algo-
rithm constantly passes on each layer and by calcu-
lating predictions and measuring errors, it adjusts the
the weights of the neurons to reduce errors (Gron,
2017). From the convolutional to the fully connected
layers, we opted to use Rectifier activation function
(ReLU) in all of them since it reduces the probabil-
ity of vanishing gradient problem (Talathi and Vartak,
2015). The loss function was binary cross-entropy
that is good with binary classification problems.
The architecture was implemented using Keras
(Chollet et al., 2018) with TensorFlow (Abadi et al.,
2015) as backend. To train the network, we used
150 epochs and trained in mini batches of 64 samples
Convolutional Neural Network for Elderly Wandering Prediction in Indoor Scenarios
257
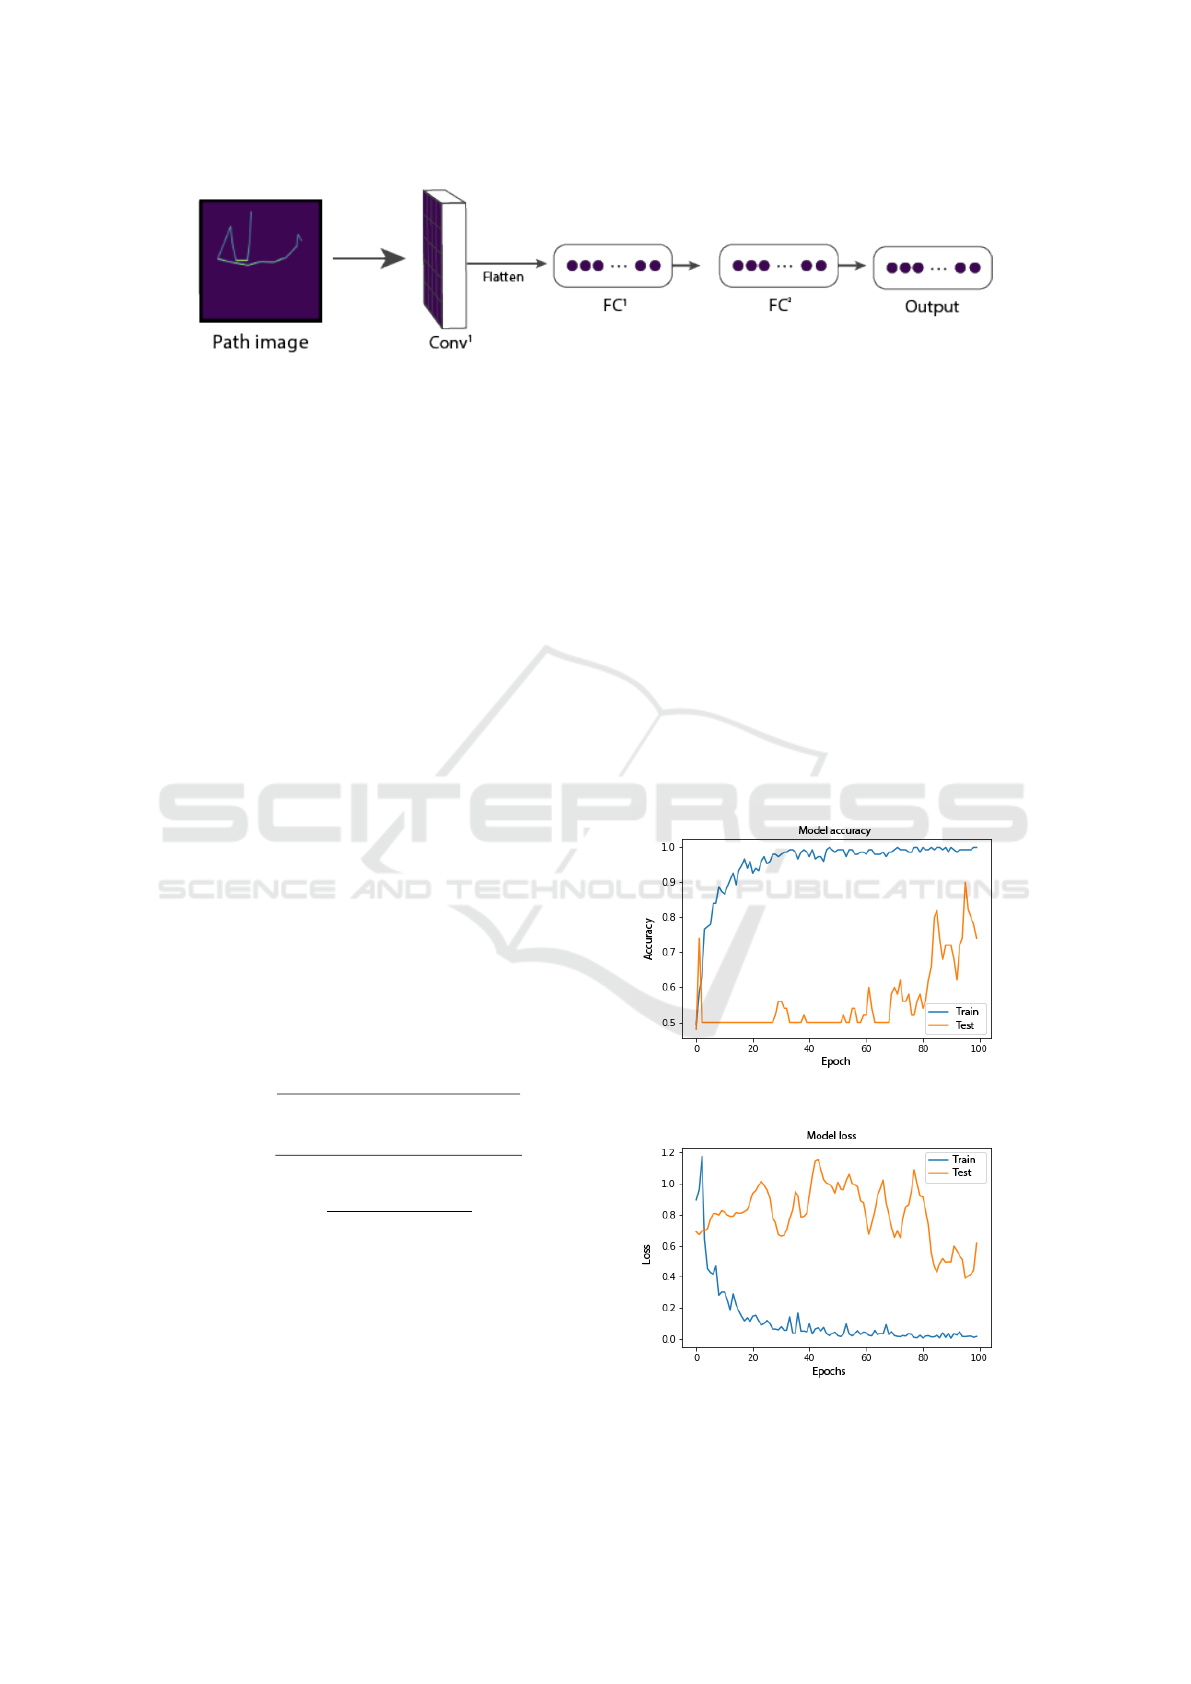
Figure 6: Architecture of our neural network model.
with a learning rate of 0.001. The model and dataset
will be available at https://github.com/Unilasalle-
SmartCare/smartcare-machinelearning.
5 RESULTS
The accuracy of the model, which represents the
model performance on the train/test data, is presented
Figure 7. The loss, that is the distance between the
true target and the prediction, is presented in Fig-
ure 8. The model was trained for 100 epochs with
the train/test dataset. The optimizer algorithm used
was the Adaptive Moment Estimation (adam).
The tuning of the model hyperparameters based
on the train/test set and evaluating on the same set
would leak information of the validation set on the
model that may influence the results (Chollet, 2017).
Based on that, besides the test set used in the training
to calculate the model accuracy and loss seen in Fig-
ures 7 and 8, we’ve generated separately a validation
dataset, consisted of 10 hours of stress and 10 hours
of normal activity, an equivalent of 10% the size of
the data used for training with the objective to evalu-
ate our model and avoid information leaks.
To measure accuracy of the models, we utilized
the following evaluation metrics: precision, recall and
f1 score. In Equations 1,2 and 3 we present each one.
Precision =
truepositives
truepositives + f alsepositives
(1)
Recall =
truepositives
truepositives + f alsenegatives
(2)
F1 = 2 ×
precision × recall
precision + recall
(3)
With the validation dataset, we could evaluate our
final model and had a precision of 100% followed by
a recall of 60% and the f1 score of 75%. The hyperpa-
rameters were chosen empirically by adjusting based
on the two curves.
The trained model was able to identify all the
movement patterns presented in Table 2. Figure 9
shows a sample of random path generated from the
validation dataset that was identified by our model
correctly as wandering.
The model obtained a satisfactory result consider-
ing the small amount of data. Besides that, the pro-
posed architecture is lightweight and can be embed-
ded into small scale devices. Therefore it is expected
that the machine learning approach proposed in this
work can predict not only patterns as the ones present
in the literature (Martino-Saltzman et al., 1991), (De-
launay and Gu
´
erin, 2017), (Lin et al., 2012) but also
non-perceived ones. As raised by (Lin et al., 2014) it
is important to perform a personalized user wander-
ing recognition model, since those wandering activi-
ties might have different characteristics depending on
the person and even environmental conditions. Our
method paves the way for a reinforcement learning
approach that can be used for the network to adapt
itself to the specific elderly movement in that house.
Figure 7: Accuracy per epoch of the model.
Figure 8: Learning curve representation of the model.
HEALTHINF 2021 - 14th International Conference on Health Informatics
258

Figure 9: Sample of a random path generated with wander-
ing activity.
6 CONCLUSIONS
In this paper, data preparation and lightweight CNN
architecture were proposed to detect the wandering
of Alzheimer’s patients using data from non-intrusive
sensors. By transforming all the data paths into im-
ages, we could use techniques such as data augmen-
tation to expand the simulated dataset and reach bet-
ter results with a convolutional neural network. Con-
ventional tracking such as wearables and cameras en-
ters into a deep discussion about the privacy of the
users. Therefore, one of the challenges of this work
was to propose a predictive method that could fit the
environment with non-intrusive sensors. Another big
challenge was the lack of data to develop the machine
learning model, so we’ve generated using known pat-
terns to simulate the real world, although the data be-
ing synthetic, it is expected that the machine learning
architecture also works with real-world data.
For future work, collecting real patient’s data is
vital to validate our model in the real world and also
learn even more wandering patterns. The conversion
from the path to images as done in this work, can be
expanded to other disease movement anomalies and
also outside the health field. For example, the same
method can be used from classifying potential cus-
tomers of a store based on the movement. This comes
with as much needed privacy concern, as the only
input our method needs is a path of movement in-
side an indoor scenario. In the future, this idea can
also be applied to identify wandering in an outdoor
scenario. The use of reinforcement learning is a fu-
ture challenge to bring interesting comparative results
with this work. Since reinforcement learning tends to
choose actions to maximize a reward based on the en-
vironment information (Chollet, 2017), these actions
could be something to mitigate the patient stress such
as aromatherapy or music.
ACKNOWLEDGEMENTS
The authors would like to thank Unilasalle-RJ for en-
couraging and financially supporting this work.
REFERENCES
Abadi, M., Agarwal, A., Barham, P., Brevdo, E., Chen, Z.,
Citro, C., Corrado, G. S., Davis, A., Dean, J., Devin,
M., Ghemawat, S., Goodfellow, I., Harp, A., Irving,
G., Isard, M., Jia, Y., Jozefowicz, R., Kaiser, L., Kud-
lur, M., Levenberg, J., Man
´
e, D., Monga, R., Moore,
S., Murray, D., Olah, C., Schuster, M., Shlens, J.,
Steiner, B., Sutskever, I., Talwar, K., Tucker, P., Van-
houcke, V., Vasudevan, V., Vi
´
egas, F., Vinyals, O.,
Warden, P., Wattenberg, M., Wicke, M., Yu, Y., and
Zheng, X. (2015). TensorFlow: Large-scale machine
learning on heterogeneous systems. Software avail-
able from tensorflow.org.
Akbar, M. F., Putrada, A. G., and Abdurohman, M. (2019).
Smart light recommending system using artificial neu-
ral network algorithm. In 2019 7th International Con-
ference on Information and Communication Technol-
ogy (ICoICT), pages 1–5. IEEE.
Amin, J., Sharif, M., Anjum, M. A., Raza, M., and Bukhari,
S. A. C. (2020a). Convolutional neural network
with batch normalization for glioma and stroke le-
sion detection using mri. Cognitive Systems Research,
59:304–311.
Amin, J., Sharif, M., Gul, N., Raza, M., Anjum, M. A.,
Nisar, M. W., and Bukhari, S. A. C. (2020b). Brain
tumor detection by using stacked autoencoders in deep
learning. Journal of Medical Systems, 44(2):32.
Arifoglu, D. and Bouchachia, A. (2017). Activity recog-
nition and abnormal behaviour detection with recur-
rent neural networks. Procedia Computer Science,
110:86–93.
Ballard, C. G., Gauthier, S., Cummings, J. L., Brodaty,
H., Grossberg, G. T., Robert, P., and Lyketsos, C. G.
(2009). Management of agitation and aggression as-
sociated with alzheimer disease. Nature Reviews Neu-
rology, 5(5):245.
Boutoleau-Bretonni
`
ere, C., Pouclet-Courtemanche, H.,
Gillet, A., Bernard, A., Deruet, A.-L., Gouraud, I.,
Lamy, E., Mazou
´
e, A., Rocher, L., Bretonni
`
ere, C.,
et al. (2020). Impact of confinement on the burden
of caregivers of patients with the behavioral variant of
frontotemporal dementia and alzheimer disease dur-
ing the covid-19 crisis in france. Dementia and Geri-
atric Cognitive Disorders Extra, 10(3):127–134.
Chollet, F. (2017). Deep Learning with Python. Manning
Publications Co., USA, 1st edition.
Chollet, F. et al. (2018). Keras: The python deep learning
library.
Delaunay, A. and Gu
´
erin, J. (2017). Wandering detection
within an embedded system for alzheimer suffering
patients. In 2017 AAAI Spring Symposium Series.
Convolutional Neural Network for Elderly Wandering Prediction in Indoor Scenarios
259

Doughty, K., Williams, G., King, P., and Woods, R. (1998).
Diana-a telecare system for supporting dementia suf-
ferers in the community. In Proceedings of the
20th Annual International Conference of the IEEE
Engineering in Medicine and Biology Society. Vol.
20 Biomedical Engineering Towards the Year 2000
and Beyond (Cat. No. 98CH36286), volume 4, pages
1980–1983. IEEE.
Gron, A. (2017). Hands-On Machine Learning with Scikit-
Learn and TensorFlow: Concepts, Tools, and Tech-
niques to Build Intelligent Systems. O’Reilly Media,
Inc., 1st edition.
Han, J., Haihong, E., Le, G., and Du, J. (2011). Survey on
nosql database. In 2011 6th international conference
on pervasive computing and applications, pages 363–
366. IEEE.
Karimi, K. and Atkinson, G. (2013). What the internet of
things (iot) needs to become a reality. White Paper,
FreeScale and ARM, pages 1–16.
Khan, S. S., Ye, B., Taati, B., and Mihailidis, A.
(2018). Detecting agitation and aggression in peo-
ple with dementia using sensors—a systematic review.
Alzheimer’s & Dementia, 14(6):824–832.
Light, R. A. (2017). Mosquitto: server and client implemen-
tation of the mqtt protocol. Journal of Open Source
Software, 2(13):265.
Lin, Q., Zhang, D., Chen, L., Ni, H., and Zhou, X. (2014).
Managing elders’ wandering behavior using sensors-
based solutions: a survey. International Journal of
Gerontology, 8(2):49–55.
Lin, Q., Zhang, D., Huang, X., Ni, H., and Zhou, X. (2012).
Detecting wandering behavior based on gps traces for
elders with dementia. In 2012 12th International
Conference on Control Automation Robotics & Vision
(ICARCV), pages 672–677. IEEE.
Martino-Saltzman, D., Blasch, B. B., Morris, R. D., and
McNeal, L. W. (1991). Travel behavior of nursing
home residents perceived as wanderers and nonwan-
derers. The Gerontologist, 31(5):666–672.
Masse, M. (2011). REST API Design Rulebook: Design-
ing Consistent RESTful Web Service Interfaces. ”
O’Reilly Media, Inc.”.
O’Neil, M. E., Freeman, M., Christensen, V., Telerant, R.,
Addleman, A., Kansagara, D., et al. (2011). A sys-
tematic evidence review of non-pharmacological in-
terventions for behavioral symptoms of dementia. De-
partment of Veterans Affairs Washington, DC.
Oniga, S. and S
¨
ut
˝
o, J. (2014). Human activity recogni-
tion using neural networks. In Proceedings of the
2014 15th International Carpathian Control Confer-
ence (ICCC), pages 403–406. IEEE.
Ord
´
o
˜
nez, F. J. and Roggen, D. (2016). Deep convolutional
and lstm recurrent neural networks for multimodal
wearable activity recognition. Sensors, 16(1):115.
Radziszewski, R., Ngankam, H. K., Gr
´
egoire, V., Lorrain,
D., Pigot, H., and Giroux, S. (2017). Designing
calm and non-intrusive ambient assisted living sys-
tem for monitoring nighttime wanderings. Interna-
tional Journal of Pervasive Computing and Commu-
nications, 13(2):114–129.
Severance, C. (2012). Discovering javascript object nota-
tion. Computer, 45(4):6–8.
Srivastava, N., Hinton, G., Krizhevsky, A., Sutskever, I.,
and Salakhutdinov, R. (2014). Dropout: a simple way
to prevent neural networks from overfitting. The jour-
nal of machine learning research, 15(1):1929–1958.
Talathi, S. S. and Vartak, A. (2015). Improving perfor-
mance of recurrent neural network with relu nonlin-
earity. arXiv preprint arXiv:1511.03771.
Teri, L., Larson, E. B., and Reifler, B. V. (1988). Behavioral
disturbance in dementia of the alzheimer’s type. Jour-
nal of the American Geriatrics Society, 36(1):1–6.
Vogado, L. H., Veras, R. M., and Aires, K. R. (2020). ”
leuknet”-a model of convolutional neural network for
the diagnosis of leukemia. In Anais Estendidos do
XXXIII Conference on Graphics, Patterns and Images,
pages 119–125. SBC.
HEALTHINF 2021 - 14th International Conference on Health Informatics
260
