
Using SAR Satellite Imagery for Potential Green Roof Retrofitting
for Flood Mitigation in Urban Environment
Mirka Mobilia
a
and Antonia Longobardi
b
Department of Civil Engineering, University of Salerno, Via Giovanni Paolo II, 132, Fisciano (SA), Italy
Keywords: Green Roof, SAR Images, SWMM, Sarno River Basin.
Abstract: Green roofs (GRs) represent a valid tool to mitigate the negative effects of urban floods. The aim of the present
work is to test the hydrological behaviour of GRs at basin scale using Storm Water Management Model
(SWMM), with an application to Preturo municipality located within the Sarno river basin (southern Italy)
which during the last two decades was interested by the occurrence of many hazardous flash floods. The
analysis of two sets of satellite images acquired between 1995 and 2016 by SAR sensors, showed a correlation
between the increase of soil sealing and the occurrences of urban flooding during the same period. This finding
suggests that the GR extensive adoption could contribute to a successful stormwater management. The
suitability for GR retrofit depends on a number of criteria. In Preturo municipality, the fulfilment of these
criteria was investigated using satellite images from Google Earth. The GRs retrofit potential of the studied
area amounts to 7% of the total surface. The hydrological behaviour of the GR retrofit scenario was compared
to the reference one which considers the actual land cover. The GR scenario better performs than the
traditional one with a reduction of the runoff volume and peak flow of respectively 3.5% and 18.9% and an
increase of the delay time of 8.2%.
1 INTRODUCTION
The most direct impact of the rapid population growth
is the demand for new buildings, which causes the
increase of urban areas all over the world. The
uncontrolled soil sealing leads to increasingly severe
and frequent urban flooding events (Mobilia et al.,
2015, Longobardi et al., 2016, Khramtsova et al.
2020). The low impact development (LID) strategies
consist of a number of practices, which mimic the
site’s predevelopment hydrologic functions so as to
mitigate the hazardous hydrological events (Chui et
al., 2016). Among these, the green roofs (GR) are
better able to minimize, detain and retain the extra-
runoff (Sartor et al., 2018, Longobardi et al., 2019,
Mobilia et al., 2017). Over the years, modelling
results have confirmed the role of GRs in restoring
the natural water regime by reducing the runoff
production. Some of the approaches used in previous
studies to reproduce the GRs hydrological behavior,
involved the use of water balance model (Starry et al.,
2016, Mobilia and Longobardi, 2020a, Mobilia and
Longobardi, 2017), NASH cascade model
a
https://orcid.org/0000-0001-7018-3592
b
https://orcid.org/0000-0002-1575-0782
(Krasnogorskaya et al., 2019), Hydrus model
(Mobilia and Longobardi, 2020b) and the rainfall-
runoff simulation model by Environmental Protection
Agency (EPA), SWMM (Storm Water Management
Model) (Haowen et al. 2020). In particular, the last
one has proved to be very accurate and user-friendly
(Wanniarachchi, 2012). Several studies concerning
GR hydrological modelling at basin scale have
demonstrated that, if widely implemented, these tools
allow to significantly reduce the negative impact of
urban flooding by decreasing the runoff volume even
up to 25% and the peak discharge to 36% (Versini at
al., 2015). Unfortunately, the extensive adoption of
vegetated cover in an urban basin is prevented by
some barriers, indeed, several criteria should be
considered when determining whether a roof is
suitable for retrofitting including the roof slope,
number of stories, orientation of the roof, number of
site boundaries (Wilkinson and Reed, 2009). In this
context, satellite imagery could be used to identify the
buildings with the potential for GR retrofit. The
present research aims at investigating the ability of
GRs, at large scale, to reduce the hydraulic load on
Mobilia, M. and Longobardi, A.
Using SAR Satellite Imagery for Potential Green Roof Retrofitting for Flood Mitigation in Urban Environment.
DOI: 10.5220/0010378700590066
In Proceedings of the 7th International Conference on Geographical Information Systems Theory, Applications and Management (GISTAM 2021), pages 59-66
ISBN: 978-989-758-503-6
Copyright
c
2021 by SCITEPRESS – Science and Technology Publications, Lda. All rights reserved
59
urban drainage system in order to mitigate urban
flooding events. Two scenarios have been simulated,
using SWMM and compared in terms of runoff
volume, peak flow and delay time during the same
rainfall event. The first scenario considers the
existing land cover while the second one concerns a
conversion of the traditional roofs to GRs in respect
of the building attributes for GR retrofit. The use of
high-resolution satellite imagery from Google Earth
has allowed to identify the buildings suitable to host
a retrofitted GR. The case study is Preturo
municipality in Southern Italy. The city has been
selected as located within Sarno river basin which is
frequently affected by urban flooding and the massive
increase in the occurrence of flash floods mainly took
place between 1995 and 2016. It has been shown that,
such an increase cannot be directly linked to climate
change (Califano et al., 2015) but it could be related
to the uncontrolled expansion of soil sealing in the
same period. In the last case, the GR retrofit of
existing roofs within the considered area could lead
to a successful stormwater management. The analysis
of the variation of impervious area has been performed
using two set of SAR (Synthetic Aperture Radar)
images: 1995s images provided by ERS-1 sensor and
2016s images supplied by COSMO-SkyMed sensor.
The obtained temporal coherence maps have been
treated with the color thresholding method for image
segmentation so as to isolate urban pixels and detect
the change in time of the paved surfaces.
2 MATERIAL AND METHODS
SWMM model has been used to predict the
hydrological response of the drainage network
resulting from two GR conversion scenarios within
Preturo municipality. The first scenario is the actual
one while the second scenario refers to the greening
conversion of buildings which meet predefined
criteria. The adoption of GRs for the retrofitting of
existing roofs in order to mitigate urban flooding
events, confirms to be an appropriate solution mainly
if within the considered area, a rapid and uncontrolled
urbanization has occurred during the studied period.
The analysis of land cover change during the last two
decades (from 1995 to 2016), has been performed by
means of the elaboration of SAR images.
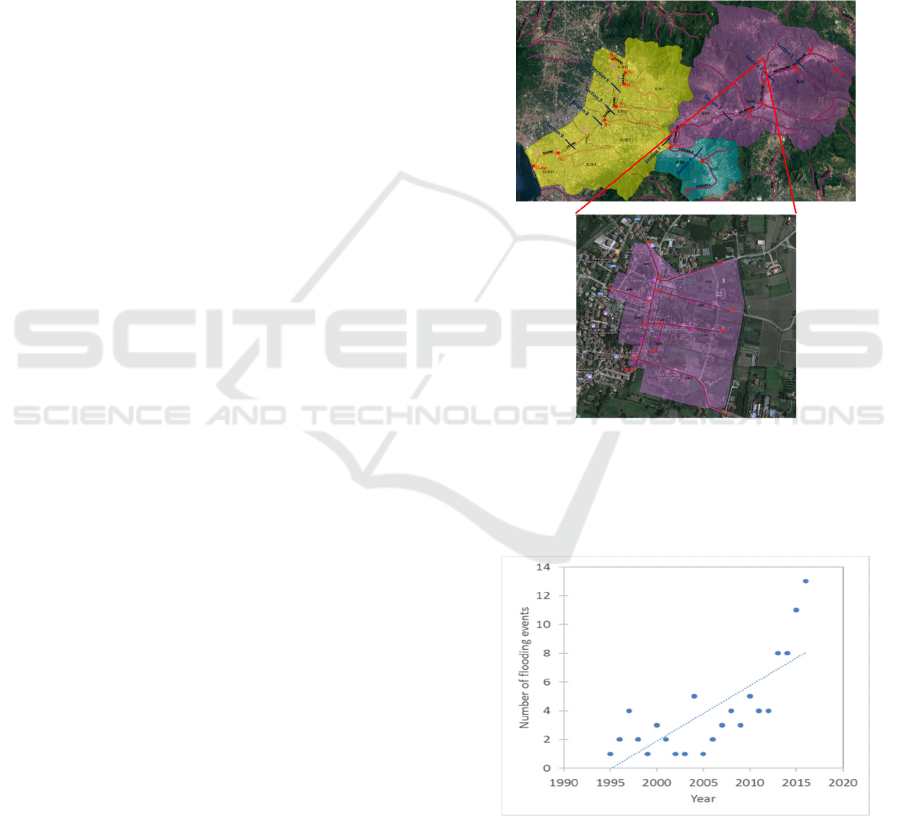
2.1 Case Study
The case study is Preturo municipality in Campania
region (Southern Italy). It is a poorly populated and
urbanized area with 1768 inhabitants for a surface of
about 28 hectares. The altitude of the municipality is
about 190 m above sea level. According to Koppen
classification, the site is characterized by
Mediterranean climate (Csa) with hot, dry summers
and cool, wet winters with the highest percentage of
rain in the year. The temperature here averages 15.2°
C while the rainfall in a year, is about 845 mm. The
city has been selected as all the details concerning its
urban drainage system are available and furthermore,
it is located within Sarno river basin (Figure 1) which
is a risk-prone area where a large number of flooding
events occurred during the last decades.
Figure 1: Preturo municipality as part of Sarno basin.
Indeed, during the last two decades, the Sarno river
basin has experienced a massive increase in the
occurrence of flash floods (Figure 2)
Figure 2: Floods occurred between 1995 and 2016 in Sarno
river basin.
It has been argued that, the increase in the
frequency of flooding events between 1995 and 2016
in Sarno basin, is not linked to climate change
GISTAM 2021 - 7th International Conference on Geographical Information Systems Theory, Applications and Management
60
(Califano et al. 2015) but it could be related to the
rapid urbanization of the area during the same period.
If so, the GR retrofit of existing roofs would result
the most appropriate choice for urban stormwater
management.
2.2 SAR Images Elaboration
Remote sensing imagery has been used to detect the
land use/cover change transitions between 1995 and
2016 in the Sarno river basin, in order to identify a
correlation between the increase of paved surfaces
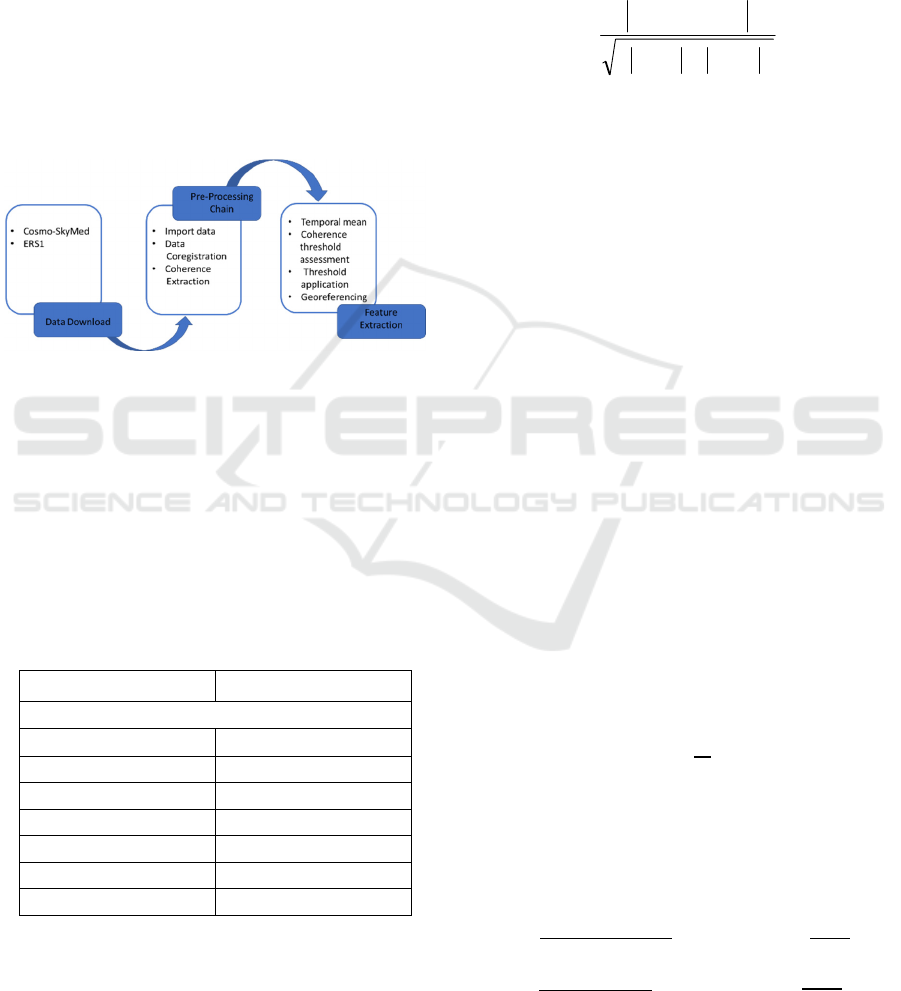
and of the hydrological damaging events. The process
here proposed for the elaboration of SAR images, can
be organized in three major blocks (Figure 3).
Figure 3: Processing algorithm.
The first step was the data download. Two sets of
archive satellite images have been used (Table 1). The
first set of images consists of 6 images acquired
between March and December 1995 by the ERS-1
satellite and distributed by the European Space
Agency (ESA), the second dataset has been acquired
by the COSMO-SkyMed sensor between May and
December 2016, and consists of 7 images distributed
by the Italian Space Agency (ASI).
Table 1: Acquisition date of SAR images.
ERS1 COSMO-SkyMed
Acquisition date
24th March 1995 3rd May 2016
8th July 1995 20th June 2016
12th August 1995 6th July 2016
21st October 1995 8th September 2016
25th November 1995 24th September 2016
30th December 1995 27th November 2016
- 13th December 2016
The pre-processing block includes data
coregistration and the estimation of the
interferometric coherence. Coregistration is the
process of alignment of the images with the reference
one, which is usually the first acquired. In the present
study, the reference images for the ERS1 and
COSMO-SkyMed time series have been acquired,
respectively, on March 1995 and May 2016.
The pre-processing block also includes the
interferometric coherence estimation. It is a measure
of the stability of a target with respect to the phase of
the complex signal. Considering two co-registered
images, it is computed through the following relation:
() ()
2
2
2
1
*
21
)()( xSxS
xSxS
⋅Σ
⋅Σ
=
γ
(1)
Where S
1
and S
2
are respectively the complex image
values for the first and the second image while *
represents the complex conjugation operation. The
reference image used in this step is the reference
image of the coregistration phase. The coherence
ranges between 0 and 1 respectively referring to the
natural land cover and the built-up area.
The feature extraction block includes the temporal
mean of the coherence consisting of averaging per
year the multi-temporal SAR images of coherence in
order to reduce the speckle but not the spatial
resolution. The second activity of the block is the
coherence threshold assessment carried out using
Otsu’s method allowing to convert a grey level image
to monochrome (or binary) image where the white
pixels represent the impervious surfaces while the
black one the previous ones according to the
following equation:
𝜎
𝑡
=𝑊
𝑡
⋅𝜎
𝑡
+𝑊
𝑡
⋅𝜎
𝑡
(2)
The best threshold value t* corresponds to the
minimum within class variance σ
w
. W
b
and W
f
are the
weights of the foreground and background classes of
pixels given as:
𝑊
𝑡
=
∑
𝑃
𝑖
;𝑊
𝑡
=
∑
𝑃
𝑖
(3)
Where:
𝑃
𝑖
=
𝑛
𝑛
(4)
The symbol i represents the gray-level and n
i
the
quantity of the pixels with the specified gray-level, n
is the general number of pixels in the image, I is the
maximum pixel value. σ
2
f
and σ
2
b
are the variances of
the
two classes:
𝜎
=
∑
with 𝜇
=
∑
∙
(5)
𝜎
=
∑
with 𝜇
=
∑
∙
(6)
Where μ
f
and μ
b
are the mean of the two classes.
Using SAR Satellite Imagery for Potential Green Roof Retrofitting for Flood Mitigation in Urban Environment
61

Finally, the processing of the two sets of satellite
images from ERS-1 and COSMO-SkyMed sensors has
allowed to detect the variation in the sealing surfaces
during the considered period and to find a possible
correlation between it and the increasing occurrence of
hazardous events within the studied area. If a link
exists the implementation of green infrastructures, with
the aim of reducing the risk associated to severe events
in urban area, can be investigated. The implementation
of these infrastructures is closely related to the
potential for retrofitting of existing roofs investigated
as explained in the following chapters.
2.3 Building Attributes for Green
Roofs
The hydrologic effect of two GR conversion
scenarios, at the city scale, has been tested using
SWMM. The first scenario considers the existing land
cover where no GRs are installed while the second
one benefits from the greening conversion of some
traditional roofs of the city. Sustainability for GR
retrofit has been detected using Google Earth and it
mainly depends on four criteria (Wilkinson and Reed,
2009) that are:
Roof slope;
The greening should be applied to roof with a
minimum slope of 2% and a maximum slope of 45%.
Roofs with a slope less than 2% require additional
drainage measures in order to avoid waterlogging in
the vegetation support course. On the other hand, a
sloped roof retains less water and structural and
vegetation problems could occur like the slip of the
plant layer.
Number of stories;
Taller buildings could partially or totally
overshadow the adjacent smaller ones and the shadow
could affects negatively the grow of the plants and
reduces evapotranspiration fluxes. Because the height
of each building is unknown, the number of stories
has allowed to discern the taller and the smaller
buildings.
Orientation of the roof;
In general, the sunlight contributes to the welfare
of the vegetation and in the northern hemisphere, the
exposure to direct sun is higher for south-facing
buildings.
Number of site boundaries;
If a building is attached to others on four sides,
during the construction of GR, the access for
machinery and delivery or storage of materials
tend to be difficult just like the subsequent access
for maintenance. In view of this, the buildings
bounded on four sides should be discarded.
2.4 Model Overview, Setup and
Implementation
The EPA Storm Water Management Model (SWMM)
has been selected as the approach for studying the
runoff production in both the considered scenarios.
SWMM is a dynamic hydrology-hydraulic simulation
model originally developed for urban areas. SWMM
consists of several blocks for analysis of different
processes: the Runoff block which performs
hydrologic simulation of runoff production, the
Transport and Extended Transport block for the
routing of this runoff, the Storage/Treatment block
which characterizes the effects of control devices
upon flow and quality and elementary cost
computations and the receive block which considers
the mix of the produced runoff in a receiving water
body. SWMM is equipped with a LID module used to
model various stormwater management devices
including GRs. SWMM solves the complete form of
Saint-Venant equations over the drainage network.
The Saint-Venant equations for conservation of mass
and momentum can be respectively express as
follows:
𝛿𝑄/𝛿𝑡 + 𝛿𝐴/𝛿𝑥 = 0
(7)
+
⁄
+𝑔𝐴
+𝑔𝐴𝑆
+𝑔𝐴ℎ
=0
(8)
where A is the cross-sectional area, t is the time, Q is
flow rate, x is distance, H is hydraulic head of water
in the conduit, g is the gravity, h
L
represents the local
energy loss per unit length of conduit; and Sf is the
friction slope. SWMM solves the Saint-Venant
equations using an explicit finite difference method
and successive approximation. The continuity
equation (Eq. 7) states that in any control volume of
water, the net change of mass caused by the inflow
and outflow equals the net rate of change of mass in
the same control volume. The momentum equation
(Eq. 8) asserts that the rate of change of momentum
in the control volume of water equals all the external
forces acting on the same control volume. Preturo’s
sewer network including the junction nodes, the
twelve sub-catchments (from SUB1 to SUB12), the
conduits can be sketched in SWMM as in Figure 4a.
The model has run with a rainfall input referring to
the event occurred on 13/09/2012 and recorded by the
local rain gauge. The rainfall event has been selected
as it caused severe flash flood in the considered area.
It lasted about 17 hours with a cumulative rainfall of
56.4 mm and a return period of 8 years. The temporal
distribution of the event is shown in Figure 4b.
GISTAM 2021 - 7th International Conference on Geographical Information Systems Theory, Applications and Management
62
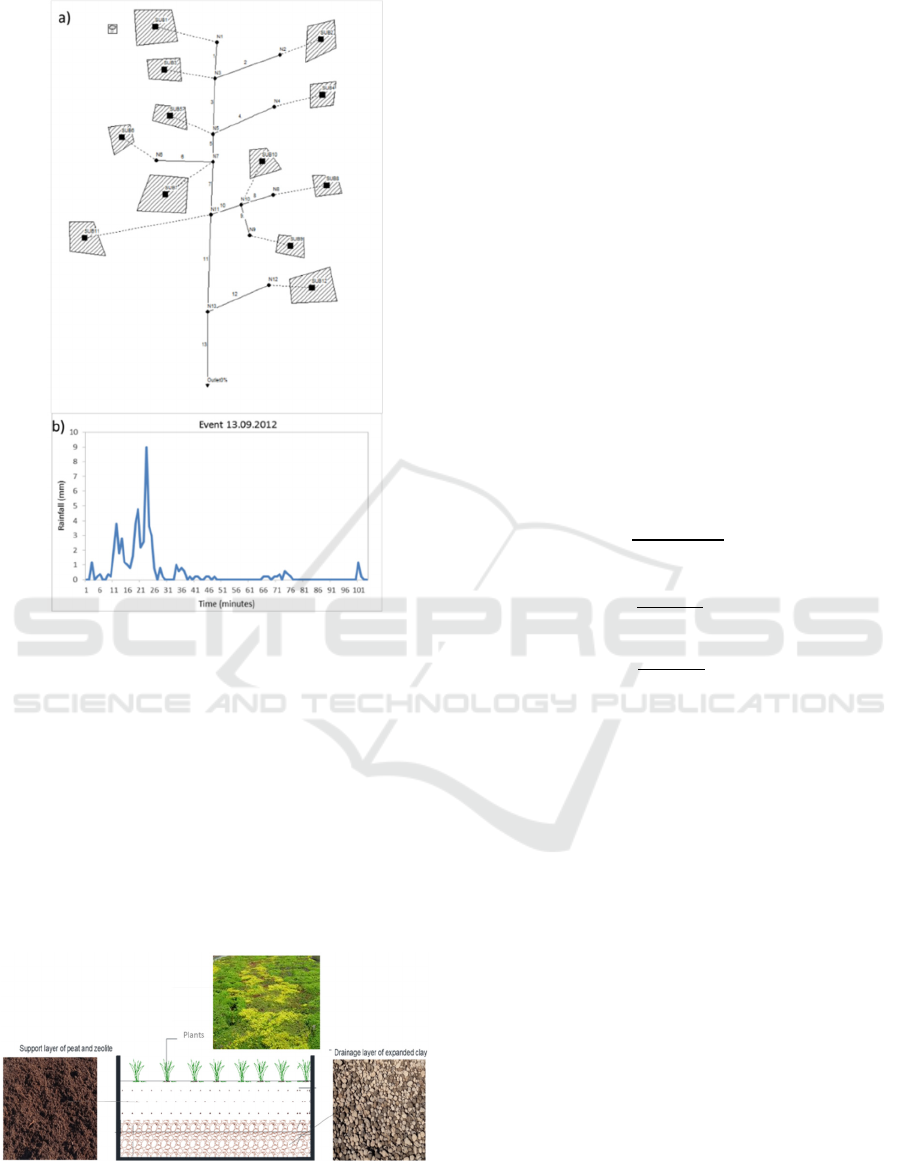
Figure 4: a) Urban drainage system of Preturo in SWMM,
b) Rainfall input.
The GR used for the simulation is an experimental
roof located in the campus of university of Salerno. It
is of extensive type and it is made up of three layers
for a total thickness of 15 cm: the vegetation layer
where the plants grow, 10 cm deep support substrate
which ensures a suitable growing environment for the
vegetation, and a water storage layer of 5 cm where
the water can be retained.
The support layer is mainly composed of peat
while the storage layer is made up of expanded clay
(Figure 5).
Figure 5: GR structure.
More details about the characteristics of the
considered GR and the input parameter set of the GR
module used for running the model are available in
(Mobilia, 2018).
Due to the lack of flow measurements within the
basin, the calibration procedure of the model has not
been performed, anyway, since several rainfall/runoff
events have been recorded at the experimental roof,
the calibration of the LID module has been carried out
instead. For more details about the observed events,
the calibration procedure and parameters please
consult Mobilia and Longobardi (2020c) and Mobilia
et al. (2020).
2.5 The Performance Analysis
The event-based performance is assessed through
three indices: the percentage of reduction in runoff
volume (ΔRV), in peak flow (ΔPF) and increase in
the delay time (ΔDT). The indices have been
estimated as follows:
𝛥𝑅
=
𝑅
,
𝑅
,
𝑅
,
⋅ 100
(9)
𝛥𝑃
=
,
,
,
⋅ 100
(10)
𝛥𝐷
=
,
,
,
⋅ 100
(11)
Where R
V,0
, P
F,0
, D
T,0
are respectively the runoff
volume (m
3
), the peak flow (m) and the delay time
(min) referred to the baseline scenario, while R
V,1
,
P
F,1
, D
T,1
are the same parameters but referred to the
greening scenario. The indices have been calculated
with respect to the outlet sections of each sub-
catchment and of the whole basin.
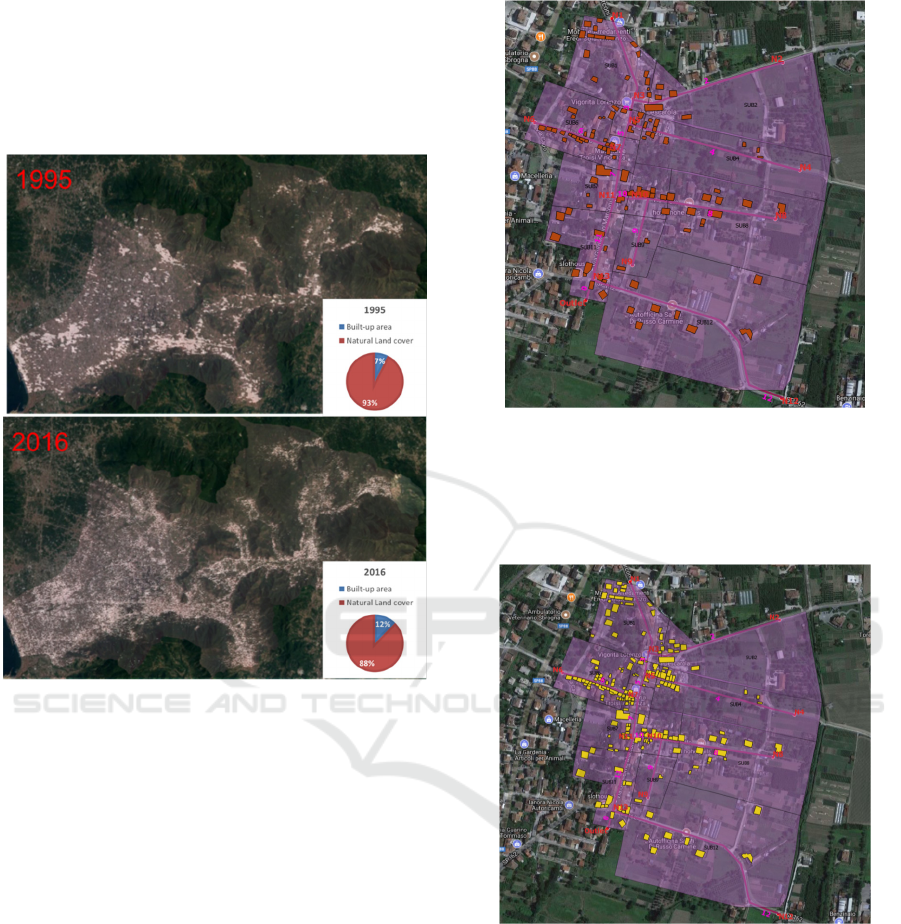
3 RESULTS
Remote sensing imagery has been used to detect the
land use/cover change transitions between 1995 and
2016 in the Sarno river basin. The results of SAR
images elaboration show that the build-up area moved
from about 7% to about 12% between 1995 and 2016,
so Sarno watershed has experienced a rapid
urbanization during the last two decades (Figure 6).
This finding suggests that the increase in the
occurrence of flooding events within Sarno basin
could be attributable to the overbuilding of the
surface, therefore, the retrofitting of buildings with
Using SAR Satellite Imagery for Potential Green Roof Retrofitting for Flood Mitigation in Urban Environment
63
GRs may represent a valid solution to mitigate the
negative effects of hydrological damaging events.
The hypothesis that GRs, applied at large scale,
could be effective in managing the urban stormwater
management in an overbuilding area, is hereinafter
tested with the use of SWMM.
Figure 6: The change in built-up area between 1995 and
2016.
The hydrological behavior of the drainage
network in two scenarios has been analyzed. The first
scenario is the baseline one while the second scenario
involves the widespread GR implementation within
the area according to four factors affecting the
potential to retrofit existing roofs which are: roof
slope, number of stories, orientation of the roof,
number of site boundaries. The identification of the
suitable buildings has been visually performed by
means of the images provided by Google Earth. With
respect of the roof slope, all the existing buildings
meet the requirement. As regards the criteria of
number of stories, the buildings with such a height as
not to be overshadowed by the nearby ones represents
the 7.1% of the total area of the basin (Figure 7). In
particular, the average number of stories is two.
Overall, 24 buildings are one story, 80 are two stories
and 72 are three stories. Only 1% of the total
buildings are four stories buildings.
Figure 7: Buildings selected according to the number of
stories.
The examination of site orientation revealed that
the south-facing buildings are about 10% of the total
basin area (Figure 8).
Figure 8: Buildings selected according to the orientation of
the existing roofs.
With references to criteria of number of site
boundaries (Figure 9) which aims at discarding the
buildings bounded on four sides, it can be said that
most of houses have not neighboring buildings (29%
of the total houses) so are free-standing while the 23%
of the buildings are bounded on two sides and the
21% on three sides. Only 15% of the total buildings
are bounded on one side. In conclusion, the buildings
which comply with this criteria represent the 9% of
the total basin area. Finally, the buildings which meet
all the attributes required for GR adaptation occupied
GISTAM 2021 - 7th International Conference on Geographical Information Systems Theory, Applications and Management
64
on average about the 7% of the area of the whole
basin. This percentage has been used to reproduce, in
SWMM, the hydrological behavior of a hypothetical
greening scenario which has been subsequently
compared to the baseline scenario where the existing
land cover of the basin is considered.
Figure 9: Buildings selected according to the number of site
boundaries.
The comparison has been performed in terms of
produced runoff volume, peak flow and delay time.
At a first visual inspection of the runoff hydrographs
observed at the outlet section of the whole basin
(Figure 10), it is possible to observe how, the runoff
volume and the peak flow are visibly lower in the case
of the GR retrofit scenario than for the baseline one.
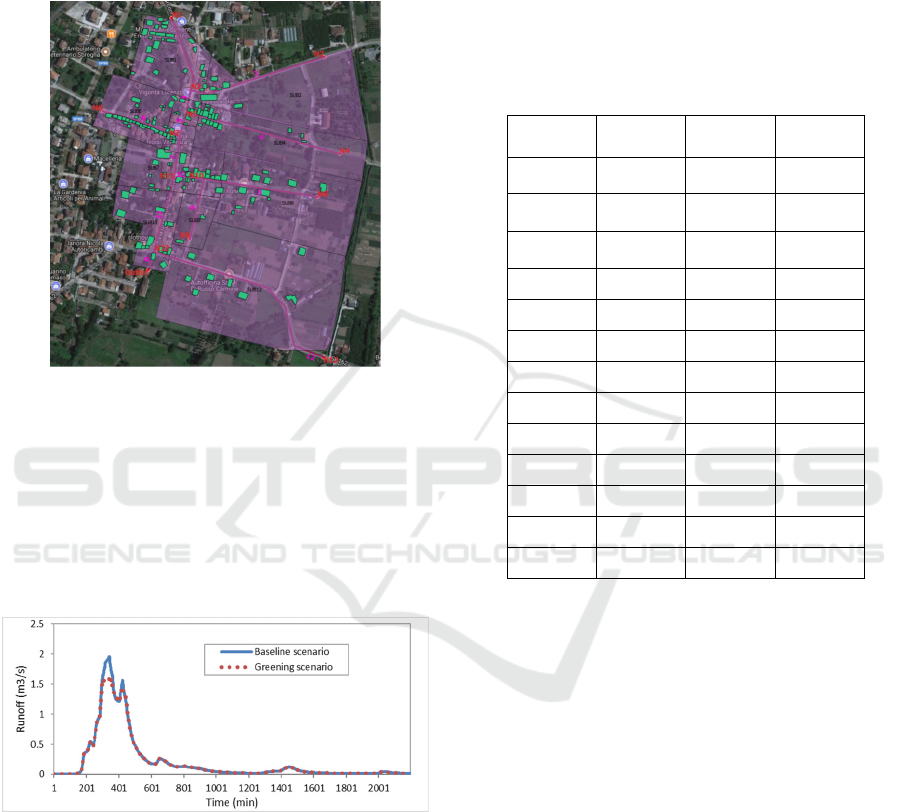
Figure 10: Comparison of existing land use condition
hydrograph with the greening conversion hydrograph at the
catchment outlet.
For a comparison in quantitative terms, the
assessment of three indices whose values are shown
in Table 2, has been performed. A reduction of the
runoff volume and of the peak flow of respectively
3.8% and 18.9% has been detected for the whole
basin after the GR conversion of the existing
buildings while an increase of the delay time of 8.2%
can be observed. At the single sub-catchment scale,
after the GR retrofit, the runoff reduction ranges from
the minimum value of 0.8% to the maximum value of
9.4%. The GR performances in terms of peak flow
reduction and delay time increase are lower if
compared to the ones obtained for the whole basin
indeed, they reach respectively at most the 3.6% and
0.8%. The worst performances are found in the
eastern part of the basin (SUBs 2, 4, 8, 9, 12) where
the retrofitting potential is lower.
Table 2: Values of the indices.
Sub ΔRv (%) ΔPf (%) ΔDt (%)
1 5.1 2.6 0
2 1.1 0.0 0
3 8.4 1.6 0.8
4 0.9 0.0 0
5 5.6 1.0 0
6 5.3 1.2 0
7 6.2 1.8 0
8 1.9 0.0 0
9 1.2 0.0 0
10 9.4 3.2 0
11 7.2 3.6 0
12 0.8 0.0 0
Whole 3.8 18.9 8.2
4 CONCLUSIONS
The GR technology is a valid solution to mitigate the
risk of flooding in urban areas especially in the
territory interested by a rapid and uncontrolled soil
sealing. This is the case of the Sarno river basin that
between 1995 and 2016, has experienced a doubling
of the build-up area. The aim of this research is to
investigate and compare the hydrological
performance of two scenarios respectively with and
without the adoption of GRs for the retrofitting of
existing roofs in Preturo municipality which is part of
Sarno river basin. The factors impacting the potential
for the retrofit of an existing roof are the number of
stories, the orientation of the roof, the number of site
boundaries and the roof slope which have been
verified with Google Earth. The percentage of GR
retrofit potential in the basin is 7% of the total area.
The analysis has been performed using SWMM and
showed that the widespread GR implementation at the
Using SAR Satellite Imagery for Potential Green Roof Retrofitting for Flood Mitigation in Urban Environment
65

whole basin scale reduces the peak runoff rates and
the runoff volumes respectively by up to 4% and 19
% while it increases the delay time of about 8%. In
conclusion, in poorly urbanized area, the application
of GRs at large scale, returns a good attenuation of
flooding events but the technology could be better
performing in densely populated areas. For higher
attenuation of the urban floods, the GR infrastructures
could be used in combination with different types of
LID practices. Future research directions of the
present work are twofold. From one side, the building
selection can be improved by using geospatial data
such as Lidar and photogrammetry mapping
technologies. From the other side, the identification
of the pervious/impervious surfaces can be optimized
by combining SAR and optical images. The joint use
of the both types of images allows to overcome the
limitations of the two approaches. Indeed, the optical
images have a high spatial resolution but suffer from
the problem of the cloud cover and vice versa for SAR
images.
REFERENCES
Califano, F., Mobilia, M., Longobardi, A., 2015. Heavy
Rainfall Temporal Characterization in the Peri-Urban
Solofrana River Basin, Southern Italy. Procedia
Engineering, 119, 1129-1138.
Chui, T. F. M., Liu, X., Zhan, W., 2016. Assessing cost-
effectiveness of specific LID practice designs in
response to large storm events, Journal of Hydrology,
533, 353-364.
Haowen, X., Yawen, W., Luping, W., Weilin, L., Wenqi,
Z., Hong, Z., Yan Yichen, Jun, L., 2020. Comparing
simulations of green roof hydrological processes by
SWMM and HYDRUS-1D, Water Supply, 20(1), 130-
139.
Khramtsova, L., Leonteva, M., Mobilia, M., Longobardi A.,
Nasyrova, E., Aksenov, S., 2020. Characterization of
rainfall events corresponding to forecasted conditions
of potential hydrogeological risk, Journal of Physics:
Conference Series, 1614(1),012077.
Krasnogorskaya, N., Longobardi, A., Mobilia, M.,
Khasanova, L. F., Shchelchkova, A. I., 2019.
Hydrological modeling of green roofs runoff by Nash
cascade model, The Open Civil Engineering Journal,
13(1), 163-171
Longobardi, A., D’Ambrosio, R., Mobilia, M., 2019.
Predicting stormwater retention capacity of green roofs:
An experimental study of the roles of climate, substrate
soil moisture, and drainage layer properties,
Sustainability, 11(24), 6956.
Longobardi, A., Diodato, N., Mobilia, M., 2016. Historical
storminess and hydro-geological hazard temporal
evolution in the solofrana river basin—Southern Italy,
Water, 8(9), 398.
Mobilia, M., 2018. Sustainable managment of stormwater
in a changing environment under Mediterranean
climate conditions, PH.D. dissertation.
Mobilia, M., Califano, F., Longobardi, A., 2015. Analysis
of rainfall events driving MDHEs occurred in the
Solofrana River Basin, Southern Italy, Procedia
Engineering, 119, 1139-1146.
Mobilia, M., D’Ambrosio, R., Longobardi, A., 2020.
Climate, soil moisture and drainage layer properties
impact on green roofs in a Mediterranean environment.
In Frontiers in Water-Energy-Nexus—Nature-Based
Solutions, Advanced Technologies and Best Practices
for Environmental Sustainability. Springer, Cham.
Mobilia, M., Longobardi, A., 2017. Smart stormwater
management in urban areas by roofs greening. In
ICCSA2019, International Conference on
Computational Science and Its Applications. Springer,
Cham.
Mobilia, M., Longobardi, A., 2020a. Model Details,
Parametrization, and Accuracy in Daily Scale Green
Roof Hydrological Conceptual Simulation.
Atmosphere, 11(6), 575.
Mobilia, M., Longobardi, A., 2020b. Impact of rainfall
properties on the performance of hydrological models
for green roofs simulation. Water Science and
Technology, 81(7), 1375-1387.
Mobilia, M., Longobardi, A. 2020c. Event scale modeling
of experimental green roofs runoff in a mediterranean
environment. In Frontiers in Water-Energy-Nexus—
Nature-Based Solutions, Advanced Technologies and
Best Practices for Environmental Sustainability.
Springer, Cham.
Mobilia, M., Longobardi, A., Sartor, J. F., 2017. Including
a-priori assessment of actual evapotranspiration for
green roof daily scale hydrological modelling. Water,
9(2), 72.
Sartor, J., Mobilia, M., Longobardi, A., 2018. Results and
findings from 15 years of sustainable urban storm water
management. International Journal of Safety and
Security Engineering, 8(4), 505-514.
Starry, O., Lea-Cox, J., Ristvey, A., Cohan, S., 2016.
Parameterizing a water-balance model for predicting
stormwater runoff from green roofs, Journal of
Hydrologic Engineering, 21(12), 04016046.
Versini, P. A., Ramier, D., Berthier, E., De Gouvello, B.,
2015. Assessment of the hydrological impacts of green
roof: From building scale to basin scale. Journal of
Hydrology, 524, 562-575.
Wanniarachchi, S. S., Wijesekera, N. T. S., 2012. Using
SWMM as a tool for floodplain management in
ungauged urban watershed, Engineer: Journal of the
Institution of Engineers, Sri Lanka, 45(1). 1-8
Wilkinson, S.J., Reed, R., 2009. Green roof retrofit
potential in the central business district. Property
Management, 27(5), 284-301.
GISTAM 2021 - 7th International Conference on Geographical Information Systems Theory, Applications and Management
66
