
On the Limits to Multi-modal Popularity Prediction on Instagram:
A New Robust, Efficient and Explainable Baseline
Christoffer Riis
1,∗ a
, Damian Konrad Kowalczyk
1,2,∗ b
and Lars Kai Hansen
1 c
1
Technical University of Denmark, DTU Compute, Matematiktorvet 303B, Denmark
2
Microsoft Corporation, Business Applications Group, Kanalvej 7, 2800 Kongens Lyngby, Denmark
Keywords:
Visual, Popularity, Explainable, Instagram, Social.
Abstract:
Our global population contributes visual content on platforms like Instagram, attempting to express themselves
and engage their audiences, at an unprecedented and increasing rate. In this paper, we revisit the popularity
prediction on Instagram. We present a robust, efficient, and explainable baseline for population-based pop-
ularity prediction, achieving strong ranking performance. We employ the latest methods in computer vision
to maximise the information extracted from the visual modality. We use transfer learning to extract visual
semantics such as concepts, scenes, and objects, allowing a new level of scrutiny in an extensive, explainable
ablation study. We inform feature selection towards a robust and scalable model, but also illustrate feature
interactions, offering new directions for further inquiry in computational social science. Our strongest models
inform a lower limit to population-based predictability of popularity on Instagram. The models are immedi-
ately applicable to social media monitoring and influencer identification.
1 INTRODUCTION
Social media platforms are full of societal metrics.
The reach of social media postings and the mech-
anisms determining popularity are of increasing in-
terest for scholars of diverse disciplines. In sociol-
ogy, it can be used to understand the connection be-
tween popularity and self-esteem (Wang et al., 2017);
in marketing and branding, it can clarify how to best
engage and communicate with customers (Overgoor
et al., 2017); in journalism, it can be used to de-
cide which posts to share on social media (Chopra
et al., 2019); and in political science, it can be used
to understand how personalised content affect popu-
larity (Larsson, 2019). From a data science point of
view, giving a lower bound on the limits to the pre-
dictability of human behaviour is a challenging task.
In Song et al.’s seminal work on limits to mobility
prediction, they argue that there is a huge gap be-
tween population and individual prediction: while in-
dividual predictability is high, population-based pre-
dictability is much lower (Song et al., 2010). Well-
aligned with Song et al. (2010), very high popular-
a
https://orcid.org/0000-0002-4540-6691
b
https://orcid.org/0000-0002-5612-0859
c
https://orcid.org/0000-0003-0442-5877
∗
These authors contributed equally
ity predictability of individuals’ postings on Insta-
gram are found by combining individualised models
(Gayberi and Oguducu, 2019). Oppositely, this pa-
per focuses on Instagram popularity prediction as the
hard problem of predicting popularity using popula-
tion models. Following the generality track in the
population models, we will not restrict the analysis
to any specific segment. Instead we will use a gen-
eral segment, which is in sharp contrast to previous
studies on Instagram predicting popularity (Mazloom
et al., 2016, 2018; Overgoor et al., 2017). To the best
of our knowledge, we are the first to use population
models to predict popularity on Instagram as a regres-
sion and ranking problem with a general segment. In
this paper, we further investigate and explain the vi-
sual modality and its potential for popularity ranking.
Our contributions can be summarized as follows:
1. we advance user-generated visual modality repre-
sentation with a novel and rich set of features, and
provide detailed explanations of their impact,
2. we provide two new popularity models for Insta-
gram, which achieve strong ranking performance
in a robust and explainable way, and finally
3. we offer a new lower bound to predictability of
Instagram popularity with the above general pop-
ulation models.
1200
Riis, C., Kowalczyk, D. and Hansen, L.
On the Limits to Multi-modal Popularity Prediction on Instagram: A New Robust, Efficient and Explainable Baseline.
DOI: 10.5220/0010377112001209
In Proceedings of the 13th International Conference on Agents and Artificial Intelligence (ICAART 2021) - Volume 2, pages 1200-1209
ISBN: 978-989-758-484-8
Copyright
c
2021 by SCITEPRESS – Science and Technology Publications, Lda. All rights reserved

Additionally, our modelling contributions are bridg-
ing previous studies of the visual modality on In-
stagram (Mazloom et al., 2016, 2018; Gayberi and
Oguducu, 2019; Overgoor et al., 2017; Rietveld et al.,
2020) through a clarification of the influence of dif-
ferent visual aspects on popularity alongside an in-
vestigation of the role of four different feature sets in
a comprehensive ablation study.
2 RELATED WORK
With the ever increasing volume of multi-modal up-
loads to the social media platforms, the challenge
of predicting the popularity of user-generated con-
tent inspires multi-modal approaches including con-
tent (metadata), author, textual, and visual informa-
tion. Content and user information are used with a
Gradient Boosting Machine (GBM) to achieve excel-
lent results (Kang et al., 2019). In multiple ablation
studies, it is reported that the content and user infor-
mation indeed are the strongest predictors among the
four modalities (Ding et al., 2019b; He et al., 2019;
Wang et al., 2018). These studies also show how the
modelling of textual content improve the performance
but show mixed performance for the visual content,
suggesting that care has to be exercised when com-
bining the modalities. In the following, we pay extra
attention to the visual modality and how it is modelled
in earlier work.
Khosla et al. (2014) find performance gains from
combining low-level features and semantic features
such as objects. Moreover, they conclude that scenes,
objects and faces are good as predictors for image
popularity. Similarly, other studies consider both
colour features, analysis of the scenery, and the num-
ber of faces in the images (McParlane et al., 2014),
and visual information extracted form a pre-trained
neural network (Cappallo et al., 2015). Both studies
show promising results for the visual modality as a
descriptor for popularity prediction.
Extant recent work considers high level visual in-
formation such as concepts, scenes, and objects de-
rived by transfer learning in the form of neural net-
works trained for classification or object detection
tasks (Gayberi and Oguducu, 2019; Gelli et al., 2015;
Mazloom et al., 2018; Ortis et al., 2019). An overview
is shown in Table 1. Gayberi and Oguducu (2019)
suggest that objects and categories are important fea-
tures in order to utilise the visual modality in the
best way possible and therefore propose to use the
MS COCO Model (Caesar et al., 2018) for object
detection. Gelli et al. (2015) use a pre-trained net-
work for object detection to extract high-level features
and objects. Their quantitative analysis shows how
the visual features complement the strong informa-
tion from the content and author features. Mazloom
et al. (2018) focus on popularity prediction within
different categories such as action, animal, people,
and scene. They show how human faces and animals
are important for popularity prediction. Ortis et al.
(2019) hypothesise that semantic features of the im-
ages such as objects and scenes have an impact on
the performance and therefore, they extract predic-
tions from two different neural networks. Another ap-
proach is to use an image-captioning model to extract
the high level information (Hsu et al., 2019; Zhang
et al., 2018). Visual features include brightness, style,
Table 1: Summary of the use of concepts, scenes, and ob-
jects extracted from the visual modality.
Concepts Scenes Objects
Gayberi and Oguducu (2019) X X
Gelli et al. (2015) X
Khosla et al. (2014) X
Mazloom et al. (2018) X
Mazloom et al. (2016) X X
McParlane et al. (2014) X X
Ortis et al. (2019) X X
Overgoor et al. (2017) X
Rietveld et al. (2020) X
This study X X X
and colour. Quantifying the aesthetics of images in
popularity prediction is seen in several papers (Chen
et al., 2019b; Ding et al., 2019b; Hidayati et al., 2017;
Mazloom et al., 2016). Chen et al. (2019b) propose to
use moments to quantify the style and colour. Ding
et al. (2019b) use a network directly pre-trained to
access the image aesthetics. Hidayati et al. (2017)
hypothesise that visual aesthetics are important infor-
mation and therefore, they extract several high-level
semantic features such as brightness, clarity, colour,
and background simplicity. Mazloom et al. (2016) di-
rectly extract image aesthetics as a 42-dimensional bi-
nary vector given by the content information from In-
stagram in the form of the feature filter. Another high-
level feature is visual sentiment, which can be directly
assessed with neural networks (Gelli et al., 2015; Ma-
zloom et al., 2016). However, we hypothesise that
these features are captured in the high-level features
from a deep neural network and consequently, we do
not apply this approach.
In multiple works, visual features are extracted
implicitly by neural network embeddings pre-trained
for general object recognition tasks. Many use a
deep neural network pre-trained on ImageNet (Rus-
sakovsky et al., 2015) for classification (e.g. (Ma-
zloom et al., 2018; Ortis et al., 2019; Wang et al.,
On the Limits to Multi-modal Popularity Prediction on Instagram: A New Robust, Efficient and Explainable Baseline
1201
2018)). It is most common to use the embeddings
from the last pooling layer with either 1024 or 2048
individual real-valued features, depending on the net-
work structure (Ding et al., 2019b; Mazloom et al.,
2018, 2016; Overgoor et al., 2017). Ortis et al. (2019)
extract high-level features from three different net-
works by considering the last two activation layers.
The three networks are pre-trained predicting classes,
adjective-noun pairs, and object and scenes. Wang
et al. (2018) use features from a network pre-trained
on ImageNet and afterwards fine-tune the network for
popularity prediction.
While several papers deploy transfer learning to
access semantic and high-level features, recent work
applies end-to-end models on the visual modality
(Ding et al., 2019a; Zhang and Jatowt, 2019). Zhang
and Jatowt (2019) investigate the effectiveness of us-
ing neural networks in the modelling of image pop-
ularity. They hypothesise that the text features have
a stronger predictive power than the visual features.
With a six-layer end-to-end network, they outperform
their baseline comprised of a pre-trained deep neu-
ral network together with Support Vector Regression
and show how their network is comparable with the
text-based embeddings methods. Ding et al. (2019a)
investigate the contribution of the visual content in
popularity prediction by training a deep neural net-
work to predict the intrinsic image popularity. By
dividing posts into different pairs giving user statis-
tics, upload time, and captions, they train the net-
work with a Siamese architecture. Through a qualita-
tive analysis and a psycho-physical experiment, they
show how their intrinsic image popularity assessment
model (IIPA) achieves human-level performance.
Our Design Space. We aim to construct a new im-
age feature extractor building upon recent work util-
ising deep learning (e.g (Ding et al., 2019b; He et al.,
2019; Ortis et al., 2019)). In recent years, the applica-
tion of deep learning and neural networks have grown
intensively as the field of computer vision has ad-
vantaged within classification (Tan and Le, 2019) and
object detection (Redmon and Farhadi, 2018) among
others. Accordingly, we propose to use transfer learn-
ing with the most recent networks of computer vision
to represent visual information and measure its impor-
tance in predicting popularity on social media. In re-
lation to previous use of transfer learning and embed-
dings (e.g. (Ding et al., 2019a; Mazloom et al., 2016;
Ortis et al., 2019)), we improve the explainability of
the embeddings by constructing them as the input to
the classifier softmax, i.e. the last layer prior to the
softmax, so each feature has a class label associated.
Networks pre-trained for different tasks have dif-
ferent internal representations, which means that the
high-level features will be complementary in describ-
ing images (Zhou et al., 2014). Therefore, we will
use the deep neural network EfficientNet-B6 (Tan
and Le, 2019) pre-trained for classification, Places365
ResNet-18 (Zhou et al., 2018) pre-trained for scene
classification, and YOLOv3 (Redmon and Farhadi,
2018) pre-trained for object detection. We adopt the
model IIPA (Ding et al., 2019a) to assess the intrin-
sic image popularity directly. Besides introducing the
state-of-the-art networks EfficientNet, Places365, and
YOLOv3 in popularity prediction, these pre-trained
models give a novel combination (also shown in Ta-
ble 1) of the visual semantics concepts, scenes, and
objects. The combination of the four complementary
models leads to a rich image representation, instru-
mental for advancing the popularity prediction on In-
stagram. We maximise the semantic diversity of the
representation to boost the final model’s ranking per-
formance and engagement explainability simultane-
ously. To test the final model, we gathered one million
posts from Instagram (more details in the sections on
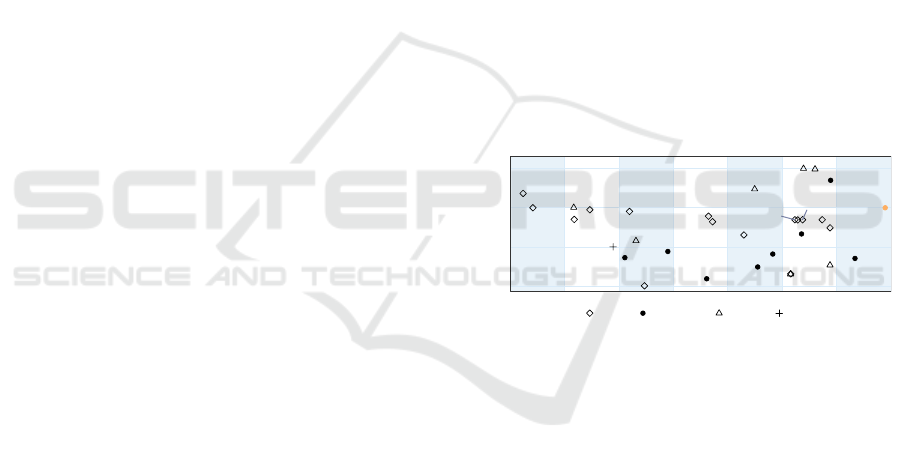
methods). Figure 1 shows that the size of our data set
is among the largest data sets on both Instagram and
other social media platforms.
This study
McParlane et al.
Wu et al.
Ortis et al.
Meghawat et al.
He et al.
Chen et al.
Hsu et al.
Ding et al.
Hu et al.
Khosla et al.
Kang et al.
Hidayati et al.
Gelli et al.
Cappallo et al.
Cappallo et al.
Zhang et al.
Almgren et al.
Ding et al.
Gayberi and Oguducu
Overgoor et al.
Rietveld et al.
Mazloom et al.
Mazloom et al.
Deza and Parikh
Chen et al.
Kowalczyk and Larsen
Wang et al.
Zhang and Jatowt
Kowalczyk and Hansen
Wu et al.
Mishra et al.
10
4
10
5
10
6
10
7
2014 2015 2016 2017 2018 2019 2020
Data volume
Flickr Instagram Twitter Reddit
Figure 1: Different sizes of data sets have been used on the
different platforms. This study (orange point) with 1 million
samples is among the largest popularity prediction studies
on both Instagram and social media in general. Points are
shifted left or right for visual clarity.
Finally, we define our scope of popularity prediction
and measurement. There exist multiple ways to ad-
dress popularity prediction on social media. Previous
work predict the number of mentions for a specific
event (Chen et al., 2019a); look at the popularity over
time or as a cascade (Almgren et al., 2016; Mishra
et al., 2016; Ortis et al., 2019; Wu et al., 2016, 2017);
define it as a binary classification problem (Deza and
Parikh, 2015; McParlane et al., 2014; Zhang et al.,
2018); but the main focus in popularity prediction on
social media is to predict the number of likes, shares,
views, etc., as a regression and ranking problem (e.g.
(Chen et al., 2019b; He et al., 2019; Kowalczyk and
Larsen, 2019)). In this paper, we address popular-
ity prediction as a regression and ranking problem.
As popularity measurement, we follow the majority
ICAART 2021 - 13th International Conference on Agents and Artificial Intelligence
1202

of the literature and use the number of likes as our
response variable (e.g (Ding et al., 2019a; Rietveld
et al., 2020; Zhang et al., 2018)).
3 METHODS
In this section, we first describe the 1M size data set
and how it was gathered. Next, we outline the fea-
ture extraction by going through the social features
and the enhanced visual feature extractor. Then, we
describe the gradient boosting machine used for pre-
diction. Lastly, we briefly introduce our use of the
explainability tool SHAP (Lundberg and Lee, 2017).
As mentioned by several studies, there does not
exist a publicly available data set for Instagram (e.g.
(Gayberi and Oguducu, 2019; Overgoor et al., 2017;
Zhang et al., 2018)). Similar to previous studies (e.g.
(Gayberi and Oguducu, 2019; Mazloom et al., 2018;
Rietveld et al., 2020)), we scraped Instagram and cre-
ated a multi-modal data set for this study specifically.
The data set consists of one million image posts gath-
ered from 2018-10-31 to 2018-12-11. The data set is
neither categorical nor user-specific and can thus be
seen as a general subset of all image posts on Insta-
gram. However, we are aware of the inevitable bias
that lies in the discard of non-public posts. The im-
age, engagement signal, and social information were
picked up 48 hours after upload time.
Previous studies show that the performance of
popularity prediction benefits from a multi-modal ap-
proach (Ding et al., 2019b; Hsu et al., 2019; Wang
et al., 2018). Therefore, we extract features from sev-
eral information sources. Overall, the features col-
lected from each post can be divided into social fea-
tures and visual features. The social features are
branched into author, content, and temporal features.
Among the author features, we extract how many fol-
lowers the user has, how many other users the user
follows, and the number of posts the user has made. In
order to stabilise the variance, we log-normalise these
three variables (e.g. (Ding et al., 2019b; Gayberi and
Oguducu, 2019; Kowalczyk and Hansen, 2020)). The
transformation of a variable x is given as follows by
first log transforming the variable x
log
= log(x + 1)
and then subtracting the mean
x
trans f ormed
= x
log
− mean(x
log
). (1)
Furthermore, we augment the features by computing
the ratios follower per post and follower per follow-
ing (Kowalczyk and Larsen, 2019). Regarding the
content features, we extract image filter, number of
users tagged, whether the user liked the post, if ge-
olocation is available, language, the number of tags,
and the length of the caption measured in words and
characters. From the language features, we augment
the data with is English. Regarding the temporal fea-
tures, we extract the feature consisting of the date and
time for posting and split it into posted date, posted
week day, and posted hour (Kowalczyk and Hansen,
2020). User ID and activity ID are discarded as irrel-
evant for the population-based approach, effectively
anonymizing the training. In creating a comprehen-
sive visual feature extractor, we use transfer learning
and deploy four pre-trained neural networks in order
to describe concepts, scenes, objects, and intrinsic im-
age popularity.
Concept Features: To extract concept features, we
use the state-of-the-art model EfficientNet-B6 (Tan
and Le, 2019) pre-trained on ImageNet (Russakovsky
et al., 2015). We use the values in the last layer prior
to the softmax normalization layer. This provides a
1000-dimensional vector each entry corresponding to
a high level object class label.
Scene Features: We extract a diverse set of scene
features by using Places365 ResNet-18 (Zhou et al.,
2018). We use the values of the last layer prior
to softmax normalization. This provides a 365-
dimensional interpretable vector of scene concepts,
a 102-dimensional feature vector of SUN scene at-
tributes (Patterson and Hays, 2012), and a single entry
indicating if the scene is indoors or outdoors.
Object Features: YOLOv3 (Redmon and Farhadi,
2018) pre-trained on COCO (Lin et al., 2014) is used
to detect multiple occurrences of 80 different ob-
jects. For each object, we count the number of in-
stances providing a 80-dimensional ‘bag-of-objects’
histogram of object occurrences.
Intrinsic Image Popularity: Here, we adopt the
model IIPA (Ding et al., 2019a) to directly assess the
intrinsic image popularity in a single variable.
In total, we have 1548 features representing con-
cepts, scenes, objects, and the intrinsic image pop-
ularity resulting in an expressive and comprehensive
visual feature representation. A feature extraction is
illustrated in Figure 2.
Gradient boosting algorithms are used in social
media popularity prediction due to speed, perfor-
mance and explainability (e.g. (Chen et al., 2019b;
Gayberi and Oguducu, 2019; Kang et al., 2019)). We
use the framework LightGBM (Ke et al., 2017) in line
with other recent studies (He et al., 2019; Hsu et al.,
2019; Kowalczyk and Hansen, 2020; Kowalczyk and
Larsen, 2019). LightGBM is a leaf-wise growth al-
gorithm and uses a histogram-based algorithm to ap-
proximately find the best split. The algorithm handles
integer-encoded categorical features and uses Exclu-
sive Feature Bundling (EFB). By combining gradient-
On the Limits to Multi-modal Popularity Prediction on Instagram: A New Robust, Efficient and Explainable Baseline
1203
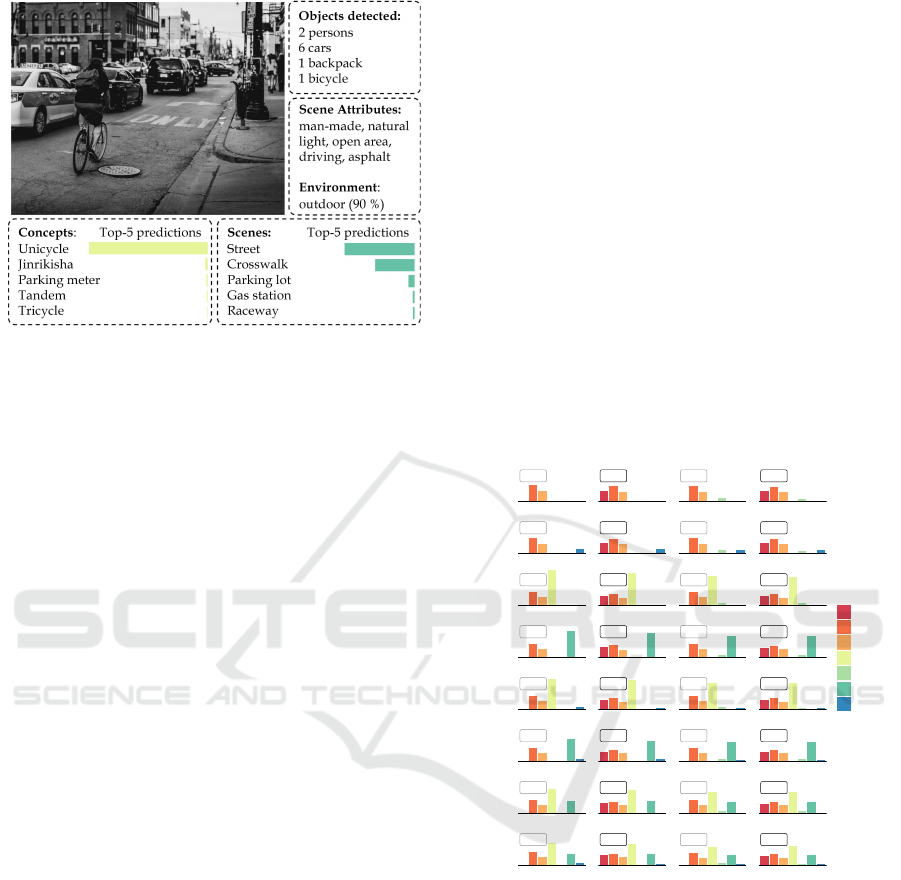
Figure 2: Example of the features extracted from an im-
age. The associated concepts are extracted with Efficient-
Net, objects are detected using YOLOv3, and the associ-
ated scenes and scene attributes as well as the environment
(indoor/outdoor) are extracted with Places365. Addition-
ally, the image scores a neutral IIPA value at 1.96 on a nor-
malised scale from -4 to 8, with a mean of 2.
based one-side sampling and EFB, Ke et al. (2017)
show how this algorithm can accelerate the training of
previous GBMs by 20 times or more while achieving
at par accuracy across multiple public data sets. Sim-
ilar to (e.g. (Ding et al., 2019a; Mazloom et al., 2018;
Gayberi and Oguducu, 2019)), we choose to predict
the log-normalised number of likes.
Explainable ML. We use the SHAP (Lundberg and
Lee, 2017) library to compute feature level explana-
tions. Single Shapley value quantifies the effect on a
prediction, which is attributed to a feature. Two prop-
erties of these values make them ideal for explaining
our ablation study:
Consistency and Local Accuracy: If we change
the model such that a feature has a greater impact,
the attribution assigned to that feature will never de-
crease. Features missing in the original input (i.e. re-
moved in ablation) are attributed no importance. The
values can be used to explain single predictions and
to summarise the model.
Additivity of Explanations: Summing the effects
of all feature attributions approximates the output of
the original model. Additivity, therefore, enables ag-
gregating explanations, e.g., on a group level, towards
an accurate and consistent attribution for each of the
modalities in the study.
Model Training. We train 111 models for the
ablation study (37 combinations in 3-fold cross-
validation) in a distributed environment of Apache
Spark. The cluster consists of 3 nodes, each pow-
ered by a 6-core Intel Xeon CPU and an NVidia Tesla
V100 GPU. We perform a basic hyper-parameter tun-
ing of LightGBM on the full combination of feature
groups (denoted as YIEPACT) and fix these param-
eters across ablation experiments to ensure fair com-
parison. We cap the number of leaves at 256, set the
feature sampling at every iteration to 0.5 (expecting
many noisy features to slow down the training oth-
erwise), limit the number of bins when building the
histograms to 255 and set the learning rate to 0.05.
4 RESULTS & MAIN FINDINGS
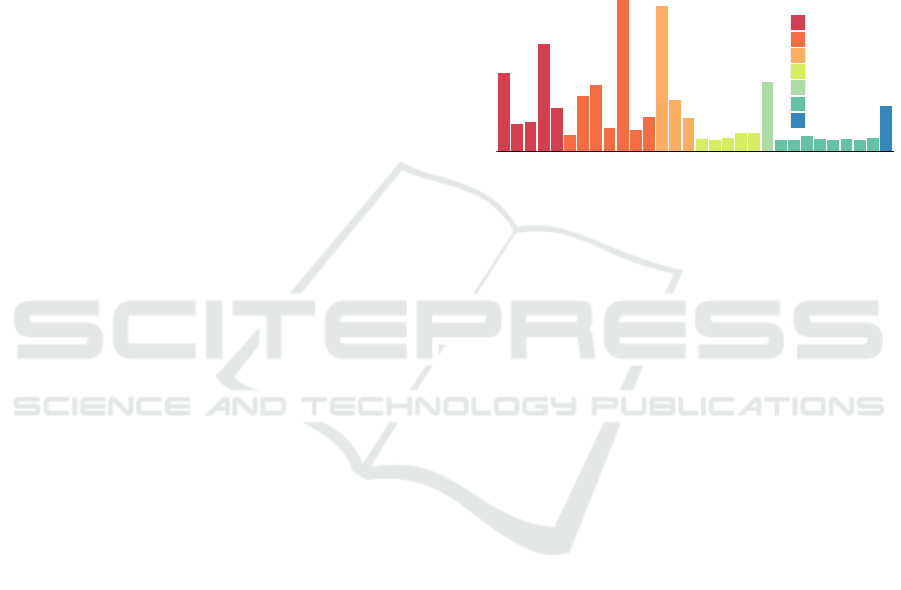
In Figure 3, the average absolute SHAP value for
each feature aggregated within each group of features
are displayed for each model together with the corre-
sponding SRC. The base model CT with content fea-
CT +A +I +IA
0.417
CT
0.501
ACT
0.435
ICT
0.508
IACT
+Y
0.433
YCT
0.508
YACT
0.444
YICT
0.510
YIACT
+E
0.455
ECT
0.505
EACT
0.458
IECT
0.507
IEACT
+P
0.452
PCT
0.504
PACT
0.456
IPCT
0.505
IPACT
+YE
0.457
YECT
0.506
YEACT
0.461
YIECT
0.509
YIEACT
+YP
0.456
YPCT
0.506
YPACT
0.459
YIPCT
0.508
YIPACT
+EP
0.460
EPCT
0.508
EPACT
0.462
IEPCT
0.510
IEPACT
+YEP
0.461
YEPCT
0.509
YEPACT
0.463
YIEPCT
0.510
YIEPACT
Feature
group
Author
Content
Temporal
EfficientNet
IIPA
Places365
YOLO
Figure 3: Average absolute SHAP value for each feature ag-
gregated within each feature group displayed for the mod-
els. The upper left plot shows the base model with Content
(C) and Temporal (T) features. In the columns, Author (A)
and IIPA (I) features are added, and in the rows Efficient-
Net (E), Places365 (P), and YOLOv3 (Y) - corresponding to
concepts, scenes, and objects respectively - are added. The
Spearman’s rank correlation is shown for each model.
tures (C) and temporal features (T) achieving an SRC
of 0.417 is shown in the upper left corner. C affects
the prediction more than T, since the content bar is
higher than the temporal bar.
Author Features Are Essential. In the columns,
we add author features (A), IIPA (I), and the com-
ICAART 2021 - 13th International Conference on Agents and Artificial Intelligence
1204
bination of the two (IA). In the first row with the base
model CT, we observe that adding I to the base model
increases the performance to 0.435 SRC, whereas
adding A gives a very high increase in the perfor-
mance reaching an SRC at 0.501. In fact, all the rows
in the second and fourth column show that these mod-
els with the author features do indeed score an SRC
above 0.5. Thus, the author features appear essential
for reaching strong performance.
EfficientNet Has the Largest Effect on the Predic-
tions. In the rows below the base model CT in Fig-
ure 3, the different semantic concepts (E: Efficient-
Net), scenes (P: Places365), and objects (Y: YOLOv3)
are added to the model. A comparison of the three
models YCT, ECT, and PCT show that E on aver-
age, has the largest effect on the predictions. In the
lower half of the column, we have the models com-
bining these features, and again it appears that E has
the largest effect. This observation can be validated
across the other columns.
Visual Semantics Are Correlated. Adding combi-
nations of the semantic groups gives a decrease in the
contribution for a single group, e.g. in YEPCT the ef-
fect of both E, P, and Y are lower than for the other
models in this column. At the same time, the SRC
is increased every time new features are added to the
model, indicating that the different features are com-
plementary. However, the decrease in the different
bars together with the increase in the SRC also indi-
cate that the groups are slightly correlated and that the
model might learn a better representation such that
some of the features within the different groups are
disregarded. In other words, this illustrates the syn-
ergy between the groups and how some features are
substituted by including other features. These obser-
vations can be validated across the other columns.
Object Detection Works Better with Author Fea-
tures. In the second column in Figure 3, we add A
to the base model CT and observe a sudden increase
in the performance reaching an SRC at 0.501. In the
first column without A, the increase in performance
is higher when adding E or P instead of Y, e.g. the
model EPCT achieve a higher SRC than both YECT
and YPCT. The same patterns are seen in the third col-
umn. However, in the first column with A, the pattern
is more cluttered, since YACT achieves a higher SRC
than both EACT and PACT. Moreover, adding either
E or P to YACT results in a performance decrease,
but adding all of them in YEPACT gives the highest
performance in this column. Withal, the combination
of EP in EPACT achieves the same performance as
YACT. Lastly, even though both YEACT and YPACT
have lower performance than YACT, adding all three
visual semantics in YEPACT gives a small increase
in performance. These hypotheses are validated by
the fourth column. However, no performance gain
is obtained by combing YIACT and IEPACT into
YIEPACT. The three models achieve the highest ob-
served SRC at 0.51. In sum, we see how objects to-
gether with authors features are very powerful, but
also how the combination of concepts and scenes is
indeed powerful with and without author features.
Followers
Following
Posts
Followers per posts
Followers per following
Filter
Users tagged
Has geolocation
Language
Hashtag count
Word count
Body length
Posted day
Posted week day
Posted hour
Jinrikisha
Lakeside
Monastery
Packet
Website
IIPA
Amusement arcade
Balcony interior
Brigde
Childs room
Indoor/outdoor
Matte
Patio
Plastic
Person
Average absolute SHAP value
Feature group
Author
Content
Temporal
EfficientNet
IIPA
Places365
YOLO
Figure 4: Average absolute SHAP value for top 30 features.
The features are chosen by highest average absolute SHAP
values across all models.
In the following, we will investigate the features af-
fecting the prediction the most by finding the top-30
most prominent features based on the average abso-
lute SHAP value across all models. More precisely,
we aggregate the average absolute SHAP value for
each feature across all models, and then divide by the
number of times that feature is present in the models.
In Figure 4, the top-30 features are coloured after each
feature group. The features hashtag count and posted
day have the largest average absolute SHAP value and
thereby affect a prediction the most. The author fea-
tures followers and followers per post come right af-
ter but more interestingly, note how the two computed
ratios followers per post and followers per following
both are high and are actually affecting the prediction
more than the two features following and posts. The
three temporal features all have a high effect on the
prediction which both shows that the day of the week
and the time of the day is important information for
predicting the popularity. Among the visual features,
IIPA and Person have the largest effect and are both
comparable to the social features. Yet, in general, all
the visual features have a smaller effect than the so-
cial features.
The social features are explained using the SHAP
values individually. We summarise the SHAP values
in two numbers computed as the mean of all positive
and all negative SHAP values separately. In this way,
On the Limits to Multi-modal Popularity Prediction on Instagram: A New Robust, Efficient and Explainable Baseline
1205
0.417
CT
0.501
ACT
0.435
ICT
0.508
IACT
0.433
YCT
0.508
YACT
0.444
YICT
0.510
YIACT
0.455
ECT
0.505
EACT
0.458
IECT
0.507
IEACT
0.452
PCT
0.504
PACT
0.456
IPCT
0.505
IPACT
0.457
YECT
0.506
YEACT
0.461
YIECT
0.509
YIEACT
0.456
YPCT
0.506
YPACT
0.459
YIPCT
0.508
YIPACT
0.460
EPCT
0.508
EPACT
0.462
IEPCT
0.510
IEPACT
0.461
YEPCT
0.509
YEPACT
0.463
YIEPCT
0.510
YIEPACT
Author
Followers
Following
Posts
Followers per posts
Followers per following
Content
Filter
Users tagged
Has geolocation
Language
Hashtag count
Word count
Body length
Temporal
Posted day
Posted week day
Posted hour
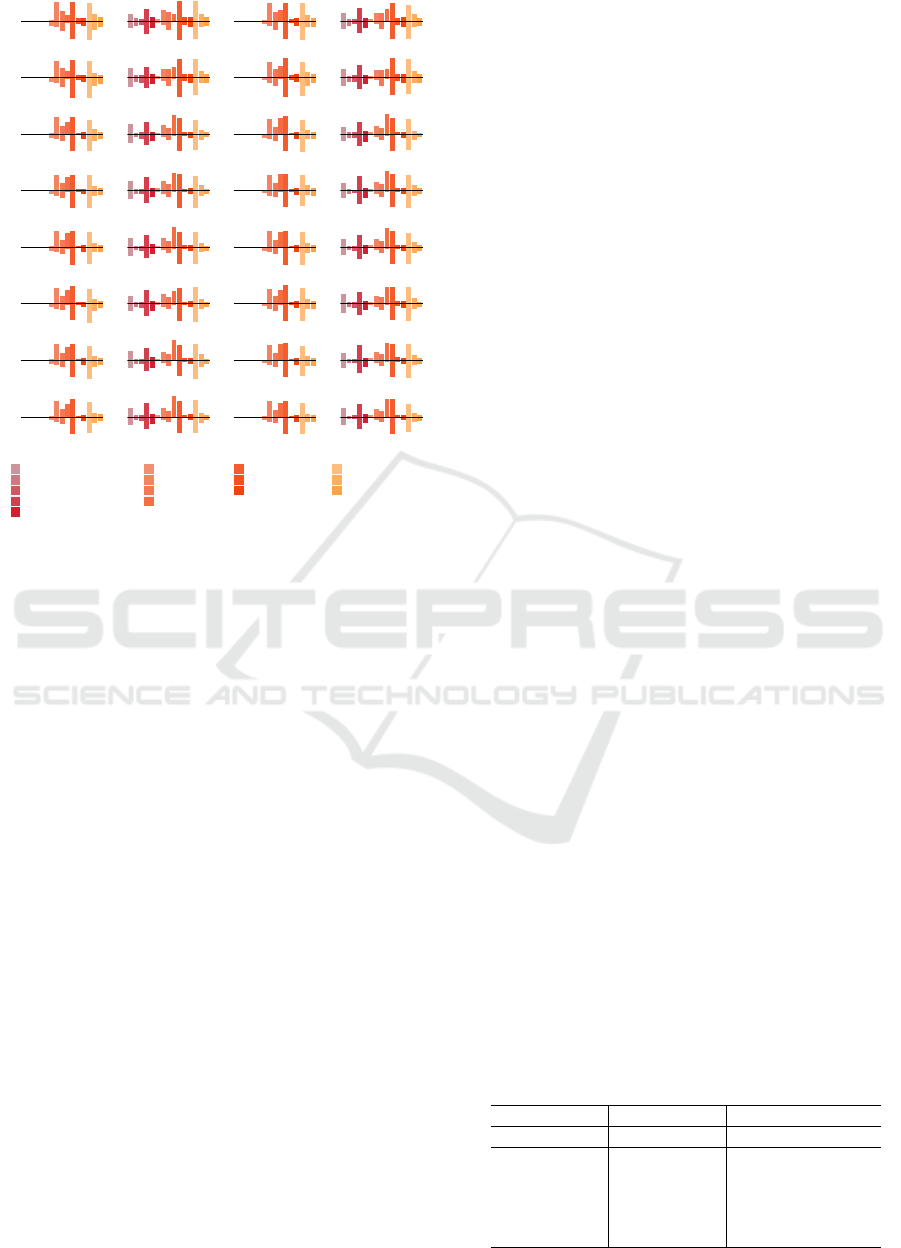
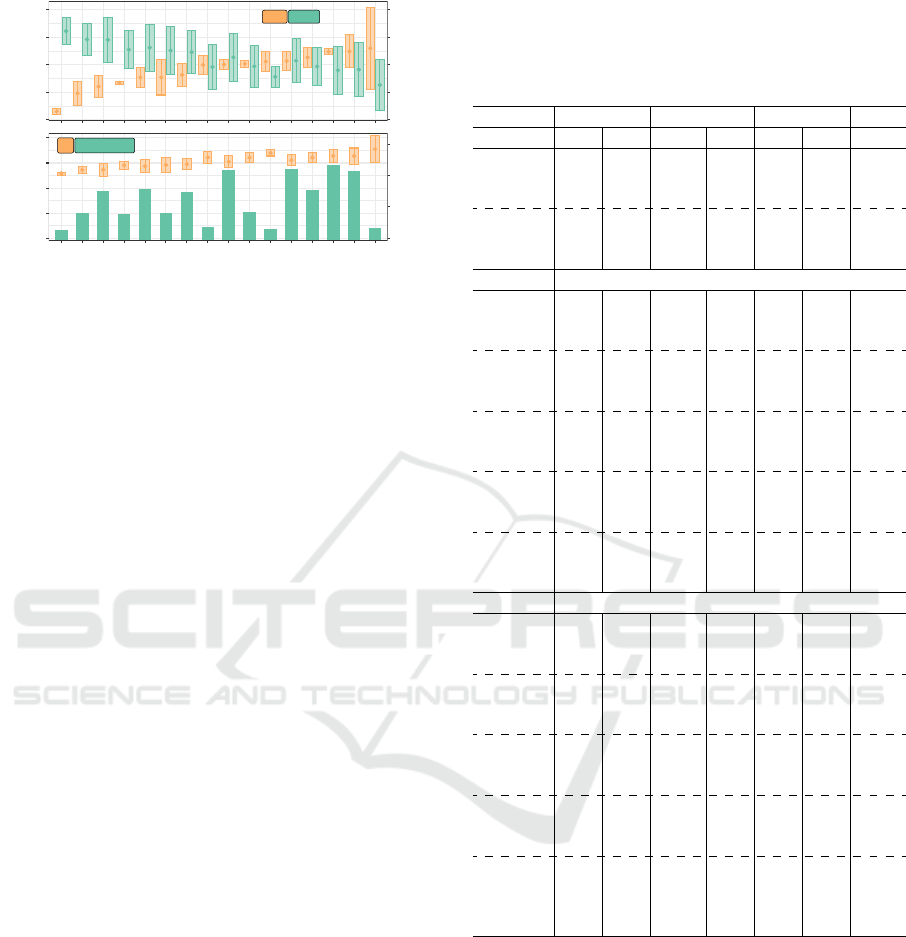
Figure 5: Average positive and negative SHAP values for
most prominent social features displayed for each model.
we both preserve the sign and the deviation of the
SHAP values. In contrast, SHAP values of different
signs will cancel out each other in a regular mean cal-
culation. In Figure 5, the positive and negative mean
SHAP values for the social features are visualised.
Hashtag Count and Posted Day Are Good Discri–
minators. In Figure 5, the base model CT consist-
ing of content and temporal features indicate that
hashtag count and posted day are good discrimina-
tors. The reason is two-fold: 1) they have high posi-
tive and negative means (e.g. the bars are large) and
2), the magnitude of the positive and negative mean
is similar, meaning that features can affect a predic-
tion in a positive and negative direction, equally. The
feature users tagged also has a high impact on the pre-
diction, but the effect is mainly in a positive direction,
since the positive mean is of larger magnitude than the
negative mean and, consequently, it is not as good a
discriminator as the two aforementioned. Regarding
the size of the bars, similar trends from the top fea-
tures in Figure 4 are observed in the figure.
Language is Important with Visual Features. If
we consider the first column in Figure 5, only small
changes are observed down the rows. The size of the
bars is decreasing slightly as we add visual features,
e.g word count is larger in CT than YEPCT. Adding Y
only seem to have very small effects on the bars and is
not changing the relative distribution, whereas adding
E and P give an increase in the positive mean of lan-
guage. In fact, all the features are smaller in YEPCT
than in CT except language, which is slightly higher.
A similar trend is observed in the last two columns,
where IIPA (I) is added to CT and ACT. I also affects
the positive mean of language in a positive direction,
e.g. comparing CT with ICT. This is also seen for the
other rows though the increase is smaller due to the
increase from E and P. This indicates that language
is more important when visual semantics and I are
added to the model. We hypothesise that the visual
predictors of popularity vary across cultures.
The Caption is Less Important with Visual Fea-
tures. If we compare the models in the first row
with the models in the last row in Figure 5, the attri-
bution of the feature word count has decreased. This
indicates a connection between the visual features and
the word count, which suggests that the visual infor-
mation can partly substitute the information in the
word count. Word count is the number of words in
the caption, and thus, we observe how the caption is
less important when visual features are present.
Visual Features Have a Small Impact on Social
Features. Overall, only small changes are observed
across the models in Figure 5, indicating that the vi-
sual features only slightly affect the impact of the so-
cial features on a prediction. If we compare the mod-
els in the first row and last row, the features language
has increased and word count has decreased. If we
compare ACT with YIEPACT, it is observed that the
majority of the features have a smaller impact and
word count is very small but the author features fol-
lowers and followers per post are unchanged, and the
content feature language is actually larger. This sug-
gests that author features are important no matter the
visual information, that language might capture some
sort of user segment, and that word count and visual
information are highly related.
Table 2: Ablation study with feature groups removed. Per-
formance metrics are given by Spearman’s rank correlation
(SRC) and root mean square error (RMSE) together with
the training and prediction time. All standard deviations
with respect to RSME and SRC are below 0.002.
Performance Time
Group removed SRC RMSE Train (s) Pred. (ms)
Author 0.463 1.202 1075 186
EfficientNet 0.509 1.158 421 1055
Places365 0.509 1.158 772 1111
YOLOv3 0.510 1.157 1170 1051
IIPA 0.509 1.159 1105 1104
ICAART 2021 - 13th International Conference on Agents and Artificial Intelligence
1206
SRC RMSE
0.500
0.504
0.508
0.512
0.516
1.25
1.26
1.27
1.28
1.29
SRC
RMSE
A
R
2
Training time
0.25
0.26
0.27
0.28
0.29
0
500
1000
1500
ACT
PACT
EACT
IPACT
YEACT
YPACT
IEACT
YACT
EPACT
YIPACT
IACT
YEPACT
YIEACT
IEPACT
YIEPACT
YIACT
R
2
Training time (s)
B
Figure 6: Performance for models getting an SRC higher
than 0.5. The boxes shows ±2 standard deviations. (A)
Spearman’s rank correlation (SRC) and Root Mean Square
Error (RMSE). (B) R
2
and training time.
The performance of the models is quantified us-
ing Spearman’s rank correlation (SRC), Root Mean
Square Error (RMSE), R
2
, and training time. In the
top panel of Figure 6, the performance ±2 standard
deviations for the 16 best models are shown. As ex-
pected, the SRC and RMSE are inversely related. The
standard deviations of performance between cross-
validation folds form a conservative (too large) es-
timate of the standard error of the mean. YIACT
has the highest SRC, but also a high standard devi-
ation, while the model IEPACT has similar perfor-
mance but is more robust. If we also include the R
2
and the training time from the bottom panel of Figure
6, we note that the models ACT, YACT, IACT, and
YIACT are fast with training times below 200 sec-
onds. All the other models have more than four times
as many features, which is reflected in the increased
training time. If R
2
is also taken into account, YI-
ACT has the highest values but IACT has similar per-
formance with much lower standard deviation. The
model IACT has a low training time, a high R
2
, and
a high SRC with a small confidence interval. Hence,
it is a good candidate for a strong, robust, and effi-
cient baseline for Instagram popularity prediction. If
we accept the somewhat larger training time (about
20 minutes), the model IEPACT is an excellent and
robust candidate with a strong, consistent SRC per-
formance across cross-validation folds.
For a real-time application, the prediction time is
a central metric. The prediction time includes the fea-
ture extraction, and we assume that if you want to pre-
dict the popularity of a new post, you have the image,
content, and temporal information at hand. The au-
thor features are crawled from WWW and the visual
features are obtained via a propagation through the
networks. In parallel, all LightGBM models run in
less than one tenth of a millisecond. In Table 2 and
Table 3: Quantitative evaluation of all models given by
Spearman’s rank correlation (SRC), root mean square error
(RMSE), the R
2
, and the prediction time given in millisec-
onds. Abbr.: author (A), content (C), temporal (T), Effi-
cientNet (E), Places365 (P), YOLO (Y), and IIPA (I).
SRC RMSE R
2
Time
µ σ µ σ µ σ ms
T .261 .001 1.306 .001 .086 .001 <1
C .305 .002 1.291 .001 .108 .001 <1
A .349 .002 1.266 .001 .141 .001 935
CT .417 .001 1.231 .001 .188 .000 <1
AT .425 .001 1.219 .002 .204 .001 936
AC .426 .000 1.216 .001 .207 .000 936
CT
YCT .433 .000 1.222 .001 .200 .000 71
ICT .435 .001 1.219 .001 .204 .000 18
YICT .444 .001 1.214 .001 .211 .001 88
PCT .452 .001 1.210 .001 .216 .001 33
ECT .455 .000 1.208 .001 .219 .001 89
YPCT .456 .000 1.207 .002 .220 .001 103
IPCT .456 .000 1.206 .001 .221 .001 50
YECT .457 .000 1.206 .002 .221 .001 159
IECT .458 .001 1.205 .001 .222 .000 106
YIPCT .459 .000 1.204 .001 .224 .001 120
EPCT .460 .001 1.205 .001 .223 .000 99
YIECT .461 .000 1.204 .001 .224 .001 176
YEPCT .461 .000 1.204 .002 .224 .001 169
IEPCT .462 .001 1.202 .001 .226 .001 116
YIEPCT .463 .000 1.202 .001 .227 .001 186
ACT
ACT .501 .000 1.163 .001 .276 .000 936
PACT .504 .001 1.162 .001 .277 .001 968
EACT .505 .001 1.162 .002 .277 .001 1024
IPACT .505 .000 1.160 .001 .279 .001 985
YEACT .506 .001 1.160 .002 .279 .001 1094
YPACT .506 .001 1.160 .002 .279 .002 1038
IEACT .507 .001 1.160 .002 .280 .001 1041
YACT .508 .001 1.158 .002 .282 .001 1006
EPACT .508 .000 1.159 .002 .280 .001 1034
YIPACT .508 .000 1.158 .002 .282 .001 1055
IACT .508 .001 1.156 .001 .284 .001 954
YEPACT .509 .001 1.159 .002 .281 .001 1104
YIEACT .509 .001 1.158 .001 .282 .001 1111
IEPACT .510 .000 1.157 .002 .283 .001 1051
YIEPACT .510 .001 1.157 .002 .283 .002 1121
YIACT .510 .003 1.155 .002 .285 .003 1023
Table 3, the prediction time for a single evaluation of
a post is seen.
5 CONCLUSIONS
In this paper, we revisit the problem of content popu-
larity ranking on Instagram with a general population-
based approach and no prior information about the
content’s authors. We use a multi-modal approach
to popularity prediction and focus on enhancing
the visual modality’s predictive power alongside the
On the Limits to Multi-modal Popularity Prediction on Instagram: A New Robust, Efficient and Explainable Baseline
1207

model’s explainability, scalability, and robustness.
We design a comprehensive ablation study including
transfer learning to represent visual semantics with
the explainable features concepts, scenes, and objects.
The approach is strong, since we show robustness and
consistency across models that take advantage of the
synergy between the visual semantics. We show that
the approach is explainable on both a high-level with
feature groups and a low-level with individual fea-
tures. We use Shapley analysis to quantify each fea-
ture’s impact on the predictions. We calculate Shap-
ley values for every prediction, before aggregating the
explanations to provide novel attributions for all the
visual semantics detected. In particular, we find that
object detection works better with author features,
and language is important with visual semantics.
Finally, we recommend two strong, explainable
and scalable baselines which also inform a new
lower limit in popularity ranking on Instagram, with
population-based approach and without prior author
information. We can lower bound the predictability
as Spearman’s rank correlation (SRC) > 0.5. Based
on the many combinations of multi-modal models,
we make the following recommendations: If train-
ing time is of importance, we recommend the model
(IACT) that combines author, content and temporal
features with a single dimension measure of image
popularity. This model trains in less than three min-
utes. If the focus is on robust performance and less on
time to train, we recommend the model (IEPACT) that
combines the social features with intrinsic image pop-
ularity and visual embeddings from EfficientNet and
Places, which is about seven times slower in training.
However, the latter model shows both strong and con-
sistent SRC across cross-validation folds.
Immediate avenues of future inquiry include ex-
periments to explain how the impact of visual seman-
tics varies across languages or investigating why ob-
ject detection performs better with author informa-
tion. Separately, it would be of high interest to apply
the proposed visual feature extraction across popula-
tion segments and social media platforms. Eventually,
we hope to inspire further applications of explainable
transfer learning to computational social science at
scale.
ACKNOWLEDGMENTS
This project is supported by the Innovation Fund
Denmark, the Danish Center for Big Data Analytics
driven Innovation (DABAI) and the Business Appli-
cations Group within Microsoft.
REFERENCES
Almgren, K., Lee, J., and Kim, M. (2016). Prediction
of image popularity over time on social media net-
works. 2016 Annual Connecticut Conference on In-
dustrial Electronics, Technology and Automation, CT-
IETA 2016, pages 1–6.
Caesar, H., Uijlings, J., and Ferrari, V. (2018). COCO-Stuff:
Thing and Stuff Classes in Context. Proceedings of
the IEEE Computer Society Conference on Computer
Vision and Pattern Recognition, pages 1209–1218.
Cappallo, S., Mensink, T., and Snoek, C. G. (2015). Latent
factors of visual popularity prediction. ICMR 2015 -
Proceedings of the 2015 ACM International Confer-
ence on Multimedia Retrieval, pages 195–202.
Chen, G., Kong, Q., Xu, N., and Mao, W. (2019a). NPP:
A neural popularity prediction model for social media
content. Neurocomputing, 333:221–230.
Chen, J., Liang, D., Zhu, Z., Zhou, X., Ye, Z., and Mo,
X. (2019b). Social media popularity prediction based
on visual-textual features with XGboost. MM 2019
- Proceedings of the 27th ACM International Confer-
ence on Multimedia, pages 2692–2696.
Chopra, A., Dimri, A., and Rawat, S. (2019). Comparative
Analysis of Statistical Classifiers for Predicting News
Popularity on Social Web. 2019 International Confer-
ence on Computer Communication and Informatics,
ICCCI 2019, pages 1–8.
Deza, A. and Parikh, D. (2015). Understanding image viral-
ity. Proceedings of the IEEE Computer Society Con-
ference on Computer Vision and Pattern Recognition,
07-12-June:1818–1826.
Ding, K., Ma, K., and Wang, S. (2019a). Intrinsic image
popularity assessment. MM 2019 - Proceedings of the
27th ACM International Conference on Multimedia,
(October):1979–1987.
Ding, K., Wang, R., and Wang, S. (2019b). Social media
popularity prediction: A multiple feature fusion ap-
proach with deep neural networks. MM 2019 - Pro-
ceedings of the 27th ACM International Conference
on Multimedia, pages 2682–2686.
Gayberi, M. and Oguducu, S. G. (2019). Popularity predic-
tion of posts in social networks based on user, post
and image features. 11th International Conference
on Management of Digital EcoSystems, MEDES 2019,
pages 9–15.
Gelli, F., Uricchio, T., Bertini, M., Bimbo, A. D., and
Chang, S. F. (2015). Image popularity prediction
in social media using sentiment and context features.
MM 2015 - Proceedings of the 2015 ACM Multimedia
Conference, pages 907–910.
He, Z., He, Z., Wu, J., and Yang, Z. (2019). Feature con-
struction for posts and users combined with lightgBM
for social media popularity prediction. MM 2019 -
Proceedings of the 27th ACM International Confer-
ence on Multimedia, pages 2672–2676.
Hidayati, S. C., Chen, Y. L., Yang, C. L., and Hua,
K. L. (2017). Popularity meter: An influence- and
aesthetics-aware social media popularity predictor.
MM 2017 - Proceedings of the 2017 ACM Multime-
dia Conference, pages 1918–1923.
Hsu, C. C., Lee, J. Y., Kang, L. W., Zhang, Z. X., Lee,
C. Y., and Wu, S. M. (2019). Popularity prediction
of social media based on multi-modal feature mining.
ICAART 2021 - 13th International Conference on Agents and Artificial Intelligence
1208

MM 2019 - Proceedings of the 27th ACM Interna-
tional Conference on Multimedia, pages 2687–2691.
Kang, P., Lin, Z., Teng, S., Zhang, G., Guo, L., and Zhang,
W. (2019). Catboost-based framework with additional
user information for social media popularity predic-
tion. MM 2019 - Proceedings of the 27th ACM In-
ternational Conference on Multimedia, pages 2677–
2681.
Ke, G., Meng, Q., Finley, T., Wang, T., Chen, W., Ma,
W., Ye, Q., and Liu, T. Y. (2017). LightGBM: A
highly efficient gradient boosting decision tree. Ad-
vances in Neural Information Processing Systems,
2017-Decem(Nips):3147–3155.
Khosla, A., Das Sarma, A., and Hamid, R. (2014). What
makes an image popular? In Proceedings of the 23rd
international conference on World wide web - WWW
’14, pages 867–876, New York, New York, USA.
ACM Press.
Kowalczyk, D. K. and Hansen, L. K. (2020). The complex-
ity of social media response: Statistical evidence for
one-dimensional engagement signal in twitter. In 12th
International Conference on Agents and Artificial In-
telligence, pages 918–925. SciTePress.
Kowalczyk, D. K. and Larsen, J. (2019). Scalable privacy-
compliant virality prediction on twitter. In AAAI-19
Workshop On Affective Content Analysi & CL-AFF
Happiness Shared Task, pages 12–27. CEUR-WS.
Larsson, A. O. (2019). Skiing all the way to the polls: Ex-
ploring the popularity of personalized posts on politi-
cal Instagram accounts. Convergence, 25(5-6):1096–
1110.
Lin, T., Maire, M., Belongie, S. J., Bourdev, L. D., Girshick,
R. B., Hays, J., Perona, P., Ramanan, D., Doll
´
ar, P.,
and Zitnick, C. L. (2014). Microsoft COCO: common
objects in context. CoRR, abs/1405.0312.
Lundberg, S. M. and Lee, S. I. (2017). A unified ap-
proach to interpreting model predictions. Advances
in Neural Information Processing Systems, 2017-
December(Section 2):4766–4775.
Mazloom, M., Pappi, I., and Worring, M. (2018). Cate-
gory Specific Post Popularity Prediction. In MultiMe-
dia Modeling, volume 10704 LNCS, pages 594–607.
Springer International Publishing.
Mazloom, M., Rietveld, R., Rudinac, S., Worring, M., and
Van Dolen, W. (2016). Multimodal popularity predic-
tion of brand-related social media posts. MM 2016
- Proceedings of the 2016 ACM Multimedia Confer-
ence, pages 197–201.
McParlane, P. J., Moshfeghi, Y., and Jose, J. M. (2014).
”Nobody comes here anymore, it’s too crowded”; pre-
dicting image popularity on Flickr. ICMR 2014 -
Proceedings of the ACM International Conference on
Multimedia Retrieval 2014, pages 385–391.
Mishra, S., Rizoiu, M. A., and Xie, L. (2016). Fea-
ture driven and point process approaches for popular-
ity prediction. International Conference on Informa-
tion and Knowledge Management, Proceedings, 24-
28-October-2016:1069–1078.
Ortis, A., Farinella, G. M., and Battiato, S. (2019). Predict-
ing Social Image Popularity Dynamics at Time Zero.
IEEE Access, 7:171691–171706.
Overgoor, G., Mazloom, M., Worring, M., Rietveld, R., and
Van Dolen, W. (2017). A spatio-temporal category
representation for brand popularity prediction. ICMR
2017 - Proceedings of the 2017 ACM International
Conference on Multimedia Retrieval, pages 233–241.
Patterson, G. and Hays, J. (2012). SUN attribute database:
Discovering, annotating, and recognizing scene at-
tributes. Proceedings of the IEEE Computer Society
Conference on Computer Vision and Pattern Recogni-
tion, pages 2751–2758.
Redmon, J. and Farhadi, A. (2018). YOLOv3: An Incre-
mental Improvement.
Rietveld, R., van Dolen, W., Mazloom, M., and Worring, M.
(2020). What You Feel, Is What You Like Influence
of Message Appeals on Customer Engagement on In-
stagram. Journal of Interactive Marketing, 49:20–53.
Russakovsky, O., Deng, J., Su, H., Krause, J., Satheesh, S.,
Ma, S., Huang, Z., Karpathy, A., Khosla, A., Bern-
stein, M., Berg, A. C., and Fei-Fei, L. (2015). Ima-
geNet Large Scale Visual Recognition Challenge. In-
ternational Journal of Computer Vision, 115(3):211–
252.
Song, C., Qu, Z., Blumm, N., and Barab
´
asi, A.-L. (2010).
Limits of predictability in human mobility. Science,
327(5968):1018–1021.
Tan, M. and Le, Q. V. (2019). EfficientNet: Rethinking
Model Scaling for Convolutional Neural Networks.
Wang, K., Bansal, M., and Frahm, J. M. (2018). Retweet
wars: Tweet popularity prediction via dynamic mul-
timodal regression. Proceedings - 2018 IEEE Win-
ter Conference on Applications of Computer Vision,
WACV 2018, 2018-Janua:1842–1851.
Wang, R., Yang, F., and Haigh, M. M. (2017). Let me take
a selfie: Exploring the psychological effects of post-
ing and viewing selfies and groupies on social media.
Telematics and Informatics, 34(4):274–283.
Wu, B., Cheng, W. H., Zhang, Y., Huang, Q., Li, J., and
Mei, T. (2017). Sequential prediction of social me-
dia popularity with deep temporal context networks.
IJCAI International Joint Conference on Artificial In-
telligence, 0:3062–3068.
Wu, B., Cheng, W. H., Zhang, Y., and Mei, T. (2016). Time
matters: Multi-scale temporalization of social media
popularity. MM 2016 - Proceedings of the 2016 ACM
Multimedia Conference, pages 1336–1344.
Zhang, Y. and Jatowt, A. (2019). Image tweet popu-
larity prediction with convolutional neural network.
In Advances in Information Retrieval, volume 11437
LNCS, pages 803–809. Springer International Pub-
lishing.
Zhang, Z., Chen, T., Zhou, Z., Li, J., and Luo, J. (2018).
How to Become Instagram Famous: Post Popularity
Prediction with Dual-Attention. Proceedings - 2018
IEEE International Conference on Big Data, Big Data
2018, pages 2383–2392.
Zhou, B., Lapedriza, A., Khosla, A., Oliva, A., and Tor-
ralba, A. (2018). Places: A 10 Million Image
Database for Scene Recognition. IEEE Transac-
tions on Pattern Analysis and Machine Intelligence,
40(6):1452–1464.
Zhou, B., Lapedriza, A., Xiao, J., Torralba, A., and Oliva,
A. (2014). Learning Deep Features for Scene Recog-
nition using Places Database - Supplementary Materi-
als. NIPS’14 Proceedings of the 27th International
Conference on Neural Information Processing Sys-
tems, 1:487–495.
On the Limits to Multi-modal Popularity Prediction on Instagram: A New Robust, Efficient and Explainable Baseline
1209
