
Complexity Measures for the Analysis of SDG Interlinkages:
A Methodological Approach
Gabriel Pereira
a
, Arturo González
b
and Gerardo Blanco
c
Grupo de Investigación en Sistemas Energéticos (GISE), Facultad Politécnica, Universidad Nacional de Asunción
(FP-UNA), Campus Universitario, San Lorenzo, Paraguay
Keywords: Sustainable Development Goals (SDGs), Economic Complexity, Product-Space Theory, Revealed
Comparative Advantage (RCA).
Abstract: The 2030 Agenda, with its 17 Sustainable Development Goals (SDGs), 169 targets and 232 indicators, has
set an ambitious “plan of action for people, planet and prosperity”1 that must be achieved within 15 years
(2015-2030). These first years of implementation of the SDGs by the 193 member states of the United Nations
(UN) have served the international community to realize the complexity of the network of interactions
(synergies and trade-off) between goals, targets and indicators, within a context where each country has set
its priorities of development and those are not always aligned with the main objective of the 2030 Agenda
(lack of policy coherence; policy vs politics). As a result of this situation, one of the main difficulties that the
countries will need to overcome is to comprehend the nature and complexity of the intricate network of
interlinkages between the SDGs, considering their universal and integrated nature. The purpose of this study
is to improve the understanding of the level of sustainability complexity of each member state of the UN in
the process of the implementation of the SDGs based on the Product-Space Theory and the Economic
Complexity. Thus, we present a SDG priority-setting tool applied to the challenging and ambitious task of
accomplishment of the 2030 Agenda, through the understanding of the SDG interlinkages network and its
complexity. Our findings are significant for the on-going debate of policy coherence and alignment of national
policies with the SDGs and the sustainability path countries should follow to progress towards an integral
achievement of the 2030 Agenda.
1 INTRODUCTION
The 2030 Agenda, with its 17 Sustainable
Development Goals (SDGs), 169 targets and 232
indicators, has set an ambitious “plan of action for
people, planet and prosperity” that must be achieved
within 15 years (2015-2030) (UN, 2015). These first
years of implementation of the SDGs by the 193
member states of the United Nations (UN) have
served the international community to realize the
complexity of the network of interactions (synergies
and trade-off) between goals, targets and indicators,
within a context where each country has set its
priorities of development and those are not always
aligned with the main objective of the 2030 Agenda
(lack of policy coherence; policy vs politics).
a
https://orcid.org/0000-0001-9966-6715
b
https://orcid.org/0000-0001-5672-3679
c
https://orcid.org/0000-0001-9773-8922
In this context, countries members have begun to
send their Voluntary National Reviews (VNRs) to the
High-Level Political Forum on Sustainable
Development of the United Nations with their
performances and experiences in the implementation
of the SDGs at the national level (UN, 2016).
In this process of sharing the first results,
experiences, and difficulties on the 2030 Agenda
implementation, it has been evidenced that key gaps
and doubts remain in the understanding on the SDGs
interactions and their individual impact (influence and
dependence) in the whole SDG system (UN, 2016).
The main difficulties that countries, will need to
overcome is to understand the nature and impact
(synergies and trade-offs) of the interlinkages
between the different targets at the national level,
considering the universal and integrated nature of the
Pereira, G., González, A. and Blanco, G.
Complexity Measures for the Analysis of SDG Interlinkages: A Methodological Approach.
DOI: 10.5220/0010374600130024
In Proceedings of the 6th International Conference on Complexity, Future Information Systems and Risk (COMPLEXIS 2021), pages 13-24
ISBN: 978-989-758-505-0
Copyright
c
2021 by SCITEPRESS – Science and Technology Publications, Lda. All rights reserved
13

SDGs and that the decisions made by the country in a
specific goal will necessarily have an effect (positive,
negative, or neutral) in the achievement of the other
SDGs and in the probability as a country to
accomplish the full 2030 Agenda.
As many experts have underlined, in this global
scenario and facing the complexity and universality
of the SDGs, a priority setting for the implementation
of the 2030 Agenda is recommended (Allen et al.,
2018; Allen et al., 2018a; Weitz et al., 2018; Zelinka
& Amadei, 2019; McGowan et al., 2018), in order to:
improve the qualitative and quantitative
understanding on SDGs interactions; identify direct
and indirect effects of SDGs interactions; detect
patterns on SDGs interactions; identify critical goals
and targets (central nodes) in the SDG network; and
secondary analyses to increase synergies and avoid
trade-off in the implementation of the 2030 Agenda
and its alignment with the national plans of
development (UN, 2014).
The aim of this study is to propose a new
methodological approach for the analysis of the SDG
interlinkages and the progress of the countries in the
implementation of the 2030 Agenda, based on their
accumulated sustainability capabilities measured
through the use of complexity measures and network
theory.
This paper is organized as follow: first, in Section
II a brief account of state-of-the-art literature on
Sustainable Development Goals (SDGs) and SDG
interlinkages analysis is made. Then, in Section III
the methodology, based on the economic complexity
and the product space theory to evaluate the SDG
interlinkages is explained. Third, in Section IV, we
show the results and discussion of our analyses,
including the interpretation of the findings.
Finally, in Section V, the conclusions are
presented.
2 LITERATURE REVIEW
The UN Sustainable Development Goals (SDGs)
were adopted in September 2015 by the 193 United
Nations (UN) member states, in a document called
“Transforming our world: the 2030 Agenda for
Sustainable Development”. The SDGs with its 17
goals, 169 targets and 244 indicators, try to leave
behind the siloed approach applied by the countries in
the past, to propose an “indivisible and integrated”
agenda, focusing on the 3 dimensions of the
sustainable development: social, economic, and
environmental (UN, 2015). Additionally, the 2030
Agenda also considers the 5P (people, planet,
prosperity, peace, partnerships) as key elements for
delivering the SDGs.
These goals are a result of a major multilateral and
intergovernmental cooperation through a
participatory process that included the work of (UN,
2014), with the purpose of filling the gaps from the
Millennium Development Goals (MDGs) that were
less ambitious and more focused on poverty and
water sanitation issues (Le Blanc, 2015; Vladimorova
& Le Blanc, 2016; Gusmao et al., 2018).
Achieving this highly ambitious agenda will
require not only political commitment, but also
important global investments of approximately 5-7
trillion USD per year (2015-2030) according to
estimations of (UNCTAD, 2014).
At the moment of writing this paper, there are
already available, at the Sustainable Development
Knowledge Platform, 227 documents reporting the
national voluntary reviews of the implementation of
the SDGs. These reviews have revealed the
difficulties of countries to implement the 2030
Agenda and the need of a better understanding of the
interactions between goals, targets, and indicators in
order to take advantage of the synergies and to
improve policy coherence (UN, 2016; Allen et al.,
2018; Allen et al., 2018a; Weutz et al., 2018).
2.1 The “Indivisible and Integrated”
Nature of SDGs
In the last years it can be observed an increase of the
literature related to assessment, analysis and
evaluations of the interlinkages between the SDGs,
covering different approaches and using a diversity of
methodological tools for SDG interactions.
As mentioned by (McGowan et al., 2018), “… the
indivisible nature of the SDGs is widely advanced as
axiomatic and underpins assessments of policy
coherence”. Therefore, the analysis of SDG
interlinkages offers fundamental information for
policymakers, guiding (through validated data) the
decision-making and the policy-design, aligned with
the sustainable development pillars.
Since the beginning of the implementation of the
2030 Agenda, the main part of the literature focused
on the study of the impact of one specific goal and its
interaction with the other goals or development
priorities (Vladimorova & Le Blanc, 2016, Alcamo,
2019; Nerini et al., 2017).
In the following years, the analysis of interactions
between goal sub-groups and the rest of the SDGs
have gained more relevance in the literature, in an
approach that is known as the “nexus approach”.
Under this approach it can be found a wide range of
COMPLEXIS 2021 - 6th International Conference on Complexity, Future Information Systems and Risk
14

studies, analyzing different combination of goals
(nexus combinations), for example: water-energy-
food nexus, energy-poverty-climate nexus, etc. (Liu
et al, 2018; Bleischwitz et al, 2018; Dargin et al.,
2019; Karnib, 2017).
Alternatively, with the purpose of improving the
comprehension of the interactions (synergies and
trade-off) between goals and targets, a new approach
appeared, based in more quantitative and data
visualization methods for the different analysis,
known as: network analysis (Allen et al, 2018; Allen
et al, 2018a; Weitz et al., 2018; Zelinka & Amadei,
2019; McGowan et al, 2018; Le Blanc, 2015;
Pedrosa-Garcia, 2018; Lusseau & Mancini, 2018).
Nevertheless, despite the existence of several
approaches, methods and studies about the SDG
interlinkages, there are still many questions as: which
is the real impact of the potential synergies and trade-
off at the different SDG levels (goals, targets and
indicators)?; which mechanisms intervene in those
interactions?; what is the impact of neutral
interactions?; how can be quantified the potential
impact of synergies and trade-off?; etc. (Nerini et al.,
2017; Nilsson et al., 2016; Nilsson et al., 2018; Maes
et al., 2019 : McCollum et al., 2018; Moyer & Bohl,
2019; Scherer et al., 2018; Singh et al., 2018).
2.2 SDGs Network System Analysis
Considering the universality, the diversity of sectors
and stakeholders involved in the implementation of
the 2030 Agenda, it becomes necessary for countries
the identification of priorities within the SDGs (Allen
et al, 2018; Weitz et al., 2018; McGowan et al., 2018;
Alcamo, 2019; Nilsson et al., 2016; Scherer et al.,
2018; Singh et al., 2018). As stated by (McGowan et
al., 2018), the selection of priorities reflects the
strategy and policy criteria of each country (expressed
by its policymakers) to evaluate the level of urgency
in each sector.
The pioneer study in this field related to the SDGs
was the one from (Le Blanc, 2015) that, even if it was
criticized for the superficiality of the wording
reference methodology implemented to analyze the
interactions between SDG and mapping its
interlinkages network. Then, (Vladimorova & Le
Blanc, 2016) have presented and analysis of 37
official reports from the United Nations to evaluate
the interactions between education and SDGs, based
again on the wording reference methodology. In this
case, the results have shown low levels of interactions
between education and the SDGs related to energy,
health and responsible consumption and production.
Applying the network approach and reinforcing
the results presented by (Le Blanc, 2015) about the
asymmetry of the interlinkages between the SDGs,
(McGowan et al., 2018) highlight that those
interlinkages are uneven, observing the lack of
connections between critical SDGs as those related to
gender equality, peace and governance. These authors
have based their analysis on the report from the
(Griggs et al., 2017) and based on the interactions
identified on it from a science-based perspective
(ICSU, ISSC, 2015), they constructed a SDG network
of interactions considering 4 main elements: degree
(number of links per node), strength (total number of
links from a node), closeness (distance with other
nodes in the network and centrality of a node in the
network), betweenness (flow of information through
the network).
Similarly, (Allen et al., 2018) and (Allen et al.,
2018a) have implemented a network approach for the
analysis of SDG targets interlinkages for 22 Arab
countries, based on the methodology of (Nilsson et
al., 2016) for the evaluation of the intensity of the
interactions (from -3 to +3), through a cross-impact
matrix to identify synergies, trade-off, and neutral
interactions. The SDG network obtained as a result of
the implementation of this methodology considers to
2 network metrics: outdegree and closeness
centrality. Then, these results have been used as input
for the evaluation of policy gaps and a multi-criteria
analysis, to set priorities for the Arab region analyzed.
Similarly, based in the same methodology (Weitz
et al., 2018) have evaluated the interactions between
34 SDG targets, obtaining results that reinforce the
hypothesis that there are more synergies than trade-
off in the SDG network, but in which the trade-off
represents a serious threat for the accomplishment of
the 2030 Agenda worldwide. Moreover, the SDG
network obtained has a deeper level of analysis
compared to the study from (Allen et al., 2018),
showing the directionality of the interactions between
SDG targets, type of interactions, intensity of the
influence of targets in the SDG network, the clusters
of SDG targets in the network, etc.
Finally, one of the most recent study in the SDGs
network system approach is the proposed by (Lusseau
& Mancini, 2018), which analyzed how the main
interactions of synergy and trade-off at the goal and
target levels vary according to the level of income of
countries, showing the existence of unstable networks
composed by antagonistic subgroups, where the
identification of development of priorities in each
country is needed.
Complexity Measures for the Analysis of SDG Interlinkages: A Methodological Approach
15

2.3 Evolution in the Understanding of
SDG Interlinkages
In this context, several authors have begun to focus
the analysis in the progress of countries in the
accomplishment of the SDGs, through rankings (by
goals, targets or indicators), qualitative
methodologies, traffic light approaches, and many
others (Griggs et al., 2017; ICSU, ISSC, 2015; Sachs
et al., 2018; Schmidt-Traub et al., 2017; Salvia et al.,
2019), in order to identify critical goals and targets
for the sustainable development of the countries.
The measurement made by (Sachs et al., 2018),
published annually since 2016 with Bertelsmann
Stiftung and the Sustainable Development Solutions
Network (SDSN), are the reference at the moment of
evaluating the progress in the accomplishment of the
SDGs worldwide.
The analysis and evaluation of the SDGs is a very
complex task, as it has been already underlined in
several studies (Dargin et al., 2019; Karnib, 2017;
McCollum, et al., 2018). Therefore, it has been
developed new methodologies to facilitate the
visualization, identification and understanding of the
existing synergies and trade-off between goals,
targets, and indicators, in order to broader our vision
of the complexity of the SDG network.
One of the most implemented methodology has
been the individual analysis of the impact of a goal
(directionality, intensity, effect, etc.) over another
goal or group of goals, having even some cases of
analysis at the target level (Alcamo, 2019; Nerini et
al., 2017; Maes et al., 2019).
Studies covering the analysis and evaluation of
SDG interlinkages at the indicator level are
practically inexistent, because of the complexity of
analysis of its interactions, the difficulty to access to
reliable, regular, and official SDG indicators data in
each country, added to the fact of the low level of
understanding that still exist about the impact of the
SDG indicators interactions (Taylor et al., 2017).
The results of these studies are relevant for
policymakers and stakeholders to comprehend the
nature of the SDG interlinkages and to improve the
SDG priority setting at the national level (Alcamo,
2019). Nevertheless, even if we still have low
understanding of the SDG interactions, the existent
literature in this topic have demonstrated that there
are more positive interactions (synergies) than trade-
off in the SDG network (Weitz et al., 2018; Nerini et
al., 2017; Maes et al., 2019).
Additionally, considering the need of including in
the analysis the indivisible and integrated nature of
the SDGs, studies have incorporated the nexus
approach. As mentioned by (Liu et al., 2018), the
nexus approach facilitates the identification of
synergies between goals, the improvement of policy
design and the implementation of policies. Moreover,
the nexus approach reduces the “silo-thinking” to
focus on the synergies of critical resources and the
promotion of wellbeing (Liu et al., 2018; Bleischwitz
et al., 2018; Dargin et al., 2019; Karnib, 2017).
Then, authors using the nexus approach underline
that the simple analysis of the type of interaction
(synergy or trade-off) is not enough, and it must be
complemented with the understanding of the impact
of the direct and indirect interactions of the SDGs
(Karnib, 2017).
Even with its limitations, the analysis of
interactions between SDGs (at the goal, target or
indicator level) are fundamentally important for
politics and policymakers, considering that allows
the identification of development priorities for the
countries, the validation of strategic policies through
the alignment with the priority goals and targets
identified (policy coherence and policy gaps) and the
evaluation of strategies for development at the
national level (Allen et al., 2018a), (Le Blanc, 2015;
Nerini et al., 2017; Karnib, 2017; Maes et al., 2019;
Griggs et al., 2017).
The challenge of understanding the intricate and
complex SDG network of interactions have been
clearly explained by (Weitz et al., 2018), which have
expressed: “Understanding interactions between
targets requires quite detailed information, but it also
requires the ability to maintain a holistic view of the
system as a whole, since it is possible that one policy
change can change the dynamics of the whole
system”.
2.4 Product-Space
The Product-Space (PS) has been applied in the
several studies focused on the analysis of growth
opportunities and the level of sophistication of a
country´s exports, in order to identify productive
capabilities, based on the revealed comparative
advantages (RCA) of the products made in each
country. Some examples include the case study of
Peru, Colombia, Uruguay, Paraguay, Panama,
Kazakhstan, China, United States, Sub-Saharan
Africa, among others (Hausmann & Klinger, 2008;
Hausmann & Klinger, 2008a; González et al., 2019;
Ourens, 2012; Vaillant & Ferreira-Coimbra, 2009;
Felipe & Hidalgo, 2015; Hausmann et al., 2016;
Abdon & Felipe, 2011).
Recently, a new approach proposed by (El-
Maghrabi et al., 2018) emerged, applying the PS and
COMPLEXIS 2021 - 6th International Conference on Complexity, Future Information Systems and Risk
16

the notions of Economic Complexity to prioritize the
SDGs and to evaluate the probability of countries of
becoming an over-achiever in a particular SDG
indicator. The hypothesis proposed by the authors
suggest that the probability of achieving a particular
SDG target can be estimated conditionally on the
observed progress on all the other targets. At the
moment, this is the only study implementing this
approach in the field of SDGs and the 2030 Agenda.
The PS, based on world export data, is a tool that
allows the identification of the probability to produce a
product A with RCA, given that it is produced a
product B with RCA. Then, the PS network shows the
relationship between the capabilities needed to produce
each pair of products (Hausmann et al., 2011).
In resume, this theory suggest that countries
should take advantage of their current productive
capabilities, diversifying their exports basket and
increasing its complexity by the development of new
products and industries that use capabilities similar to
those they already have, facilitating the development
of new capabilities and the production of more
complex and higher added value goods (González et
al., 2019; Abdon & Felipe, 2011; Hidalgo &
Hausmann, 2009).
In practice, the PS provides, as mentioned by
(Hausmann et al., 2011), the easier and less risky paths
through which productive knowledge is accumulated
for each country under study. In other words, this
approach helps countries to identify products that
require similar capabilities to those that a country
already have and therefore, have higher probabilities to
be produced and co-exported (if the country decides to
do it) (Hausmann et al., 2011; Hidalgo & Hausmann,
2009; Hausmann & Klinger, 2007; Hausmann et al.,
2014; Hidalgo & Klinger, 2007; Hausmann et al.,
2007; Hausmann & Hidalgo, 2011).
The representation of the resulted network of
products exported worldwide by countries is called
“Product Space”, translating global trade data in a
network of nodes and edges (Hausmann et al., 2011;
Hidalgo & Hausmann, 2009). In its original model,
the nodes represent the different products traded
worldwide, the sizes of the nodes are proportional to
the volume of participation of each product in world
trade, while the classification of the products are
expressed through the colors of the nodes (Hausmann
et al., 2011).
The distance between nodes (links) are
determined by the proximity. The proximity (ϕ)
represents the conditional probability that a country
that exports product p also exports product p´.
There are 2 main elements to be considered in the
implementation of this methodology. First, the RCA
in a product p, that according to (Balassa, 1965) is
achieved if the country exports the product p with a
share that is equal to the share of total world trade that
the product represents (Hausmann et al., 2011;
Balassa, 1965).
𝑅𝐶𝐴
𝐴
(1)
Where X
iA
represents exports of good i of country
A, X
A
is the total exports of country A, X
iw
the world
exports of good i, and X
W
total. If RCA (A
i
) ≥ 1, then
the product i of country A has revealed comparative
advantage otherwise it has not.
Higher levels of RCA are understood as higher
level of competitiveness in the international market.
Second, the Proximity, that according to the
literature, represents the idea that 2 products that need
similar capabilities or productive knowledge have
higher probabilities to be co-exported or produced in
tandem, while products that need more different
capabilities have lower probabilities to be produced
together or to be co-exported. Then, it should be easier
for countries to improve their productive structure by
making shorts steps towards near products in the
product-space network (Hausmann et al., 2011;
Hidalgo & Hausmann, 2009; Hidalgo et al., 2007).
Mathematically, the proximity between 2
products, “i” and “j”, can be calculated as the
minimum distance between the probability that
countries can export a product “i” with RCA, since
they export the good “j” with RCA and the probability
of countries exporting a “j” good with RCA, since
they export product “i” with RCA:
ϕ
ij
minPVCR
i
1| VCR
j
1,
PVCR
j
1| VCR
i
1
(2)
The proximity matrix is constructed using the
results from the RCA analysis as inputs, showing a
matrix of countries and products, where a value of 1
is given if product p for a given country c has RCA≥1
or 0 (zero) otherwise. Then, the “Mcp” matrix can be
expressed as follows (Hausmann et al., 2011):
𝑀
1 𝑖𝑓 𝑅𝐶𝐴
1
0 𝑖𝑓 𝑅𝐶𝐴
1
(3)
Finally, the proximity measure, understood as the
conditional probability that a country that exports a
product p, will also export a product p', is calculated
based on the previously mentioned M
cp
matrix.
Formally, the proximity of a pair of products “pp´”
can be expressed as follows (Hausmann et al., 2011):
Complexity Measures for the Analysis of SDG Interlinkages: A Methodological Approach
17
𝜙
´
´
,
,
´,
(4)
2.5 Complexity Measures
The economic complexity it is related with the
ubiquity and diversity of the accumulated knowledge
in a determined economy. Then, in a specific country,
as more people from different sectors interact,
combining their knowledge to produce a diversity of
products, a more complex economy could be
expected. Therefore, the economic complexity can be
expressed as the share of productive knowledge
accumulated by a country, as a result of using and
combine that knowledge (Hausmann et al., 2011).
The knowledge can be only accumulated,
transferred and preserved if it is incrusted in a people´s
network or in organizations that apply that knowledge
for productive purposes. If producing a product
requires a specific type or combination of knowledge,
then the countries that produce that product reveal that
they have the capabilities and required knowledge to
produce it (Hausmann et al., 2011).
The economic complexity of a country is reflected
in the amount of productive knowledge of its
economy, measured by the use of 2 main indicators,
the diversity and the ubiquity.
The diversity it refers to the amount of products
produced in a specific country, while the ubiquity
refers to the amount of countries that produce a
specific product.
𝐷𝑖𝑣𝑒𝑟𝑠𝑖𝑡𝑦𝐾𝑐,0
∑
𝑀𝑐𝑝
(5)
𝑈𝑏𝑖𝑞𝑢𝑖𝑡𝑦𝐾𝑝,0
∑
𝑀𝑐𝑝
(6)
In order to generate a more accurate measure of
the number of available capabilities of a country, or
the required capabilities for a product, it is necessary
to correct the information that the diversity and
ubiquity hold, through the use of each of them to
correct the other, and vice versa. As proposed by
(Hausmann et al., 2011), this can be expressed as the
following equations:
𝐾𝑐,𝑁
,
∑
𝑀𝑐𝑝 𝐾𝑝,𝑁 1
(7)
𝐾𝑝,𝑁
,
∑
𝑀𝑐𝑝 𝐾𝑐,𝑁 1
(8)
𝐾𝑐,𝑁
,
∑
𝑀𝑐𝑝
,
∑
𝑀𝑐´𝑝 𝐾𝑐´,𝑁 2
´
(9)
𝐾𝑐,𝑁
∑
𝑘𝑐´,𝑁 2
∑
´
, ,
´
(10)
This can be rewritten as follows:
𝐾
,
∑
𝑀
´
𝐾
´,´
(11)
Finally, it can be obtained the following
expression:
𝑀
´
∑
´
,
,
(12)
Note that Eq. 12 it is fulfilled when K
c;N
= k
c;N-2
= 1. This it is the eigenvector of M
cc´
that is associated
with the highest eigenvalue. The eigenvector is a
vector of 1, so it is not informative. It is expected
instead, that the eigenvector associated to the second
largest eigenvalue, to capture the highest amount of
variance of the system. Therefore, the Economic
Complexity Index (ICE) is defined as follows
(Hausmann et al., 2011):
𝐸𝐶𝐼
⃗
⃗
⃗
(13)
Where, 𝐾
⃗
> is an average, stdev() represents the
standard deviation and 𝐾
⃗
is the eigenvector of 𝑀
´
associated with the second largest eigenvalue.
Analogously, it is defined the Product Complexity
Index (PCI). Due to the symmetry of the problem, it
can be done simply by exchanging the index of
country (c) with the products (p) in the before
mentioned equations. Then, the PCI can be expressed
as follows (Hausmann et al., 2011):
𝐼𝐶𝑃
⃗
⃗
⃗
(14)
Where, 𝑄
⃗
is the eigenvector of 𝑀
´
associated to
the second largest eigenvalue.
3 METHODOLOGY AND MODEL
ESPECIFICATION
This research develops an analysis of the
interlinkages among the Sustainable Development
Goals, through the use of the economic complexity
and product space theory, offering a new approach to
the study of SDG interlinkages.
Additionally, the methodology applied serves as a
tool for policymakers to improve decision-making,
facilitating the setting of priorities in the 2030
Agenda at the national level through the analysis of
the interlinkages, synergies and trade-off existing in
COMPLEXIS 2021 - 6th International Conference on Complexity, Future Information Systems and Risk
18

the structure of the SDGs and their impact in policy
design and its implementation.
The implementation of the methodology is
structured in 2 phases:
• Revealed Comparative Advantage: to identify the
SDGs with RCA for each country under study. This
information will serve as input for the complexity
measures.
• Product-Space Analysis: to evaluate the SDG
network and the interlinkages between goals. Then, to
calculate and evaluate the Sustainability Complexity
Index (SCI) and the Goal Complexity Index (GCI),
and its implications in the prioritization of the SDGs.
3.1 Measure the RCA
In the first stage, through the use of the concepts of
the RCA, it has been identified for each of the
countries under study, the SDGs that present a
“revealed comparative advantage” considering their
performances in the accomplishment of the 17 SDGs
for the year 2018, according to (Sachs et al., 2018).
As a result of this first stage we have obtained a
new matrix of country and goals, known as Mcg
matrix, identifying for each country the SDGs with
RCA according to their respective level of
accomplishment. The Mcg (country-goal) matrix is
obtained using the same theoretical framework
explained previously, but with the only difference is
that we analyze SDGs instead of products.
𝑅𝐶𝐴
(15)
Where,
𝑋
: the normalized value of the accomplishment
of the SDG “g” in the country “C”
𝑋
∑
𝑋
: Sum of all the normalized values of
the accomplishment of all the SDGs in the country “C”
𝑋
∑
𝑋
: Sum of all the normalized values
of the SDG “g” in all the countries under study “W”.
𝑋
∑
𝑋
=
∑
𝑋
: Sum of the normalized
values of the SDG “g” for all the countries under
study “W”
Then, using the M
cg
matrix as input, we were able
to calculate the proximity for each pair of SDGs,
which is an important information for the further
analysis of complexity measures.
The database used have been extracted from
(Sachs et al., 2018) for the 156 countries that provides
reliable data for the 17 SDGs of the 2030 Agenda.
This database is available at the SDSN website.
3.2 SDG Complexity Analysis
In this stage, based on the complexity measures, the
Sustainability Complexity Index (SCI) and the Goal
Complexity Index (GCI), it has been analyzed the
situation from a different perspective.
First, we identify the level of complexity of
countries in the accomplishment of the SDGs through
the SCI. In this evaluation, the are 2 elements that
must be considered: the ubiquity and the diversity.
Considering RCA, it can be express the Mcg matrix
(countries vs goals).
𝑀
1 𝑖𝑓 𝑅𝐶𝐴
1
0 𝑖𝑓 𝑅𝐶𝐴
1
(16)
Mathematically, and based on the complexity
measures from (Hausmann et al., 2011), the SCI is
defined as follows:
𝑆𝐶𝐼
𝑅
⃗
𝑅
⃗
𝑠𝑡𝑑𝑒𝑣 𝑅
⃗
(17)
Where 𝑅
⃗
represents an average, stdev is the
standard deviation and 𝑅
⃗
is the eigenvector of 𝑀
´
associated with the second largest eigenvalue.
Second, it has been evaluated the SCI as a tool to
predict wellbeing and development of countries,
comparing the SCI against different index
Third, based on the results of the GCI, it has been
analyzed the complexity of the SDGs, in order the
comprehend the nature of each goal and to identify
the goals that require more or less sustainability
capabilities to be fully accomplished. Formally, and
based on the theoretical framework from (Hausmann
et al., 2011), the GCI is expressed as:
𝐺𝐶𝐼
⃗
⃗
⃗
(18)
Where 𝑆
⃗
is the eigenvector of 𝑀
´
associated with the second largest eigenvalue.
4 RESULTS
The Sustainability Complexity Index (SCI) proposed
in this study could be an interesting tool to improve
the implementation of the 2030 Agenda, considering
that it allows to measure the sustainability capabilities
that each country has for the accomplishment of the
SDGs.
Additionally, we observe that the SCI it is not only
related to economic growth, but it is also strongly
Complexity Measures for the Analysis of SDG Interlinkages: A Methodological Approach
19
related to a wide and ambitious variety of critical
indicators for the development of the countries,
aligned with the integrated and indivisible nature of
the SDGs.
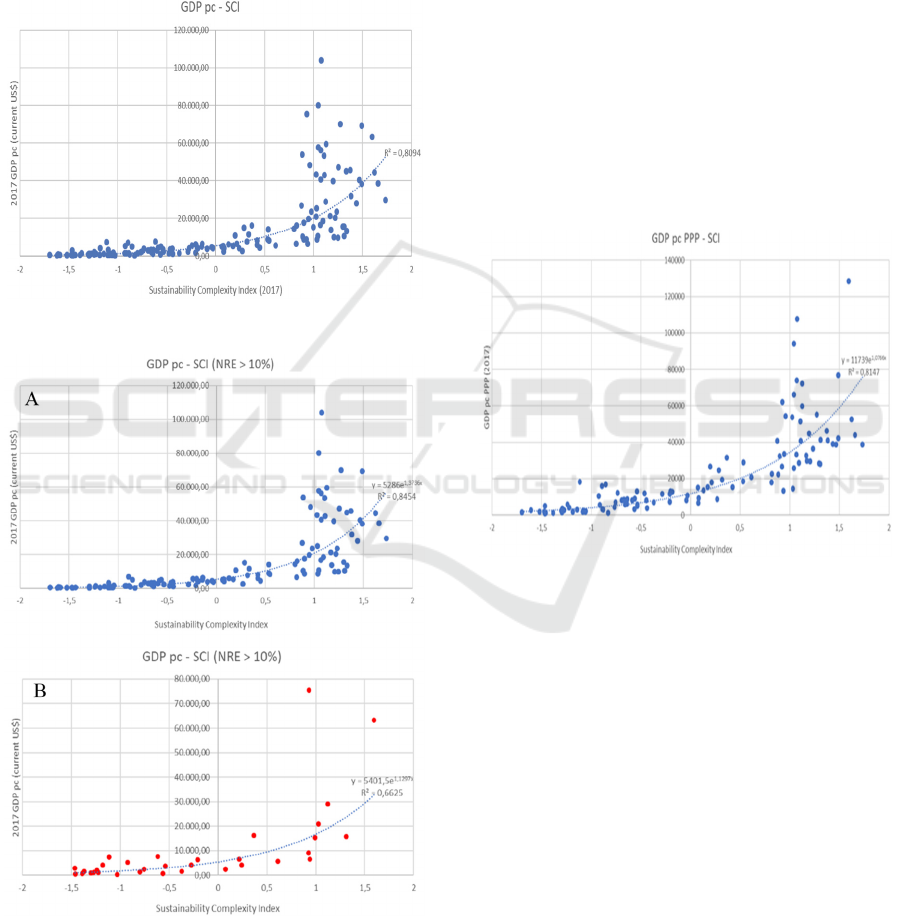
In Fig.1, we can observe a strong correlation
between GDP per capita and SCI. It must be
underlined, that from the first quadrant, the trend line
clearly fits an exponential behavior, with highest level
of GPD per capita explaining highest levels of SCI.
Figure 1: Relationship between SCI and GDP per capita.
Figure 2: (A) Relationship between GPD per capita and SCI
in countries where natural resources exports are lower than
10% of GDP. (B) Relationship between GPD per capita and
SCI in countries where natural resources exports are higher
than 10% of GDP.
Then, in Fig.2 it has been disaggregated the
analysis between exporters and non-exporters of
natural resources, based on the groups of countries
proposed in (Hausmann et al., 2011).
From Fig. 2A we can infer that GDP per capita it
is an optimal proxy of SCI in countries that are not
highly dependent on natural resources exports (i.e.
oil, natural gas, etc.). In the other hand, the correlation
of GPD per capita and SCI it is low to moderate, for
countries highly dependents on natural resources
exports. This situation could be a secondary effect of
what in economics it is known as the dutch disease,
potentially also affecting the accomplishment of the
SDGs.
Furthermore, from other perspective, in Fig. 3 we
can observe the relationship between the SCI and the
GDP per capita in terms of purchasing power parity
(PPP), showing the same exponential behavior,
especially for GDP pc (PPP) from 6.000 US$.
Figure 3: Relationship between SCI and GDP per capita in
terms of purchasing power parity (PPP).
Moreover, in Fig. 4 we can distinguish the
different levels of correlation between the SCI and a
diversity of development index as the SPI, GCI
(World Economic Forum), HDI (United Nations) and
the WHI (United Nations).
From Figure 4, we observe that SCI shows a good
fit, especially with development index that consider
different variables and sectors in the analysis, as the
SPI, the GCI and the HDI, reinforcing the fact of the
universality of the challenges behind the SDGs. In the
other hand, the WHI does not seem to be a good
explicative variable of the accomplishment of the
SDGs.
Additionally, we have also found that the SCI
shows a low correlation with the Gini Index (R
2
=
0,14), a moderated level of correlation with the
average years of education (0,56) and low to
COMPLEXIS 2021 - 6th International Conference on Complexity, Future Information Systems and Risk
20
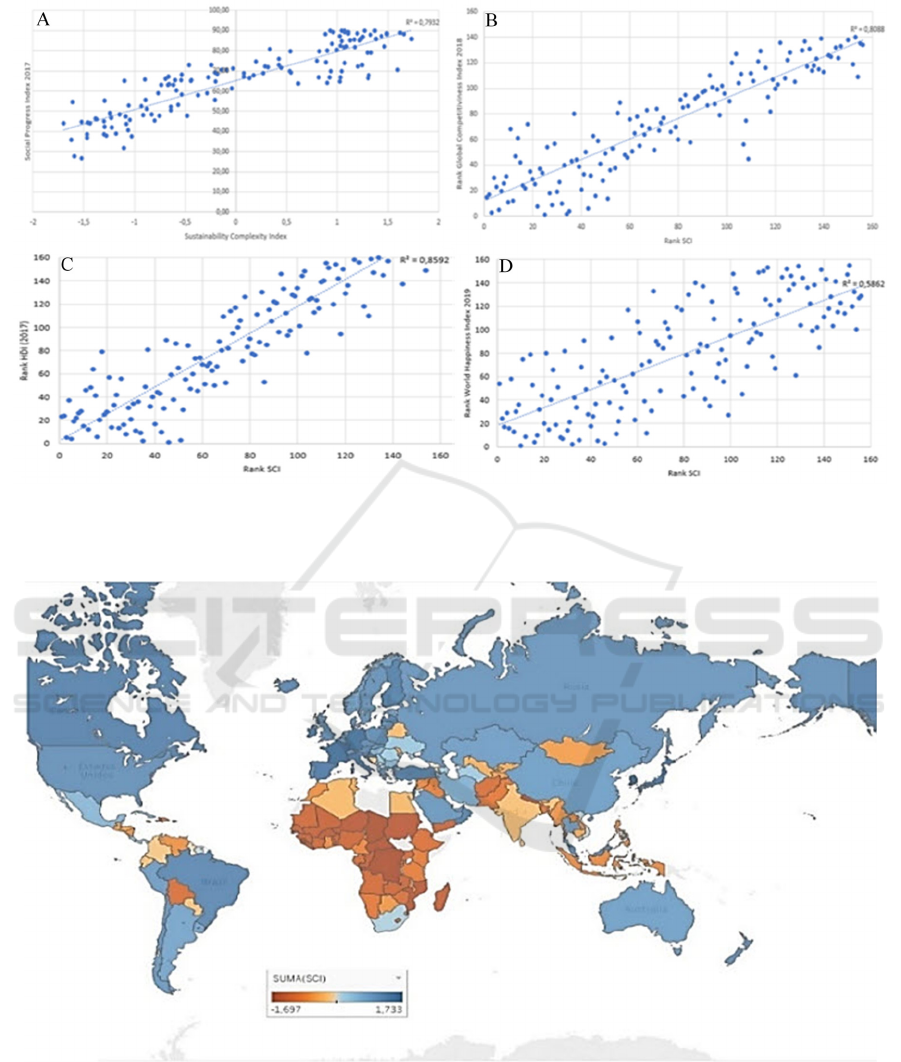
Figure 4: (A) Relationship between the SCI and the Social Progress Index (SPI). (B) Relationship between the SCI and the
Global Competitiveness Index (GCI). (C) Relationship between the SCI and the Human Development Index (HDI). (D)
Relationship between the SCI and the World Happiness Index (WHI).
Figure 5: SCI heat map (World) – warmer colors reflects lower levels of sustainability complexity.
moderate levels of correlation with the indicators of
the Worldwide
Governance Index Components (i.e. control of
corruption, government effectiveness, political
stability, regulatory quality, rule of law and voice and
accountability).
Finally, in Fig. 5 we can observe the first attempt
of implementation of the methodological approach
proposed in this study, showing the results of the SCI
for the 156 countries with available data in (Sachs et
al., 2018).
Complexity Measures for the Analysis of SDG Interlinkages: A Methodological Approach
21
From Fig. 5, it is clear that the biggest challenges
for the accomplishment of the SDGs mainly remain
in Africa and South East Asia. In South America,
Bolivia and Venezuela present the lowest level of
SCI.
Additionally, the Goal Complexity Index (GCI)
has been measured, obtaining the results shown in
Fig. 6. (darker colors reflects higher levels of GCI).
Figure 6: GCI Index.
From the GCI, we conclude that the top 3, of more
complex goals in the 2030 Agenda, are the SDG12
(Responsible Production & Consumption), SDG13
(Climate Action) and SDG17 (Peace, Governance &
Partnerships). In the other hand, the least complex
goals are SDG9 (Industry, Innovation and
Infrastructure), SDG3 (Health & Wellbeing) and
SDG7 (Energy).
In this context, an optimal strategy for countries
could be following the sustainability complexity path,
in order to fully achieve the 2030 Agenda, advancing
from the accomplishment of less complex goals to
more complex goals.
Finally, following studies should be oriented to
analyze and to identify, through the use of network
theory and product-space theory, how the
accomplishment of a specific SDGs could lead to the
accomplishment (or not) of another SDG.
5 CONCLUSIONS
The methodological approach proposed in this study
shows strong evidence of its usefulness for the
purposes of measuring the accomplishment of the
SDGs, aligned with the 2030 Agenda. This
complexity measures shows strong correlation with
several development index that could explain the
accomplishment of the SDGs in the different
countries.
At the moment, the analysis of the SCI is limited
to the availability of reliable data from the countries
about their progress in the accomplishment of the
different SDGs. It must be underlined, that the input
data use in this methodology is based on SDG Report,
published annually by the Sustainable Development
Solution Network (SDSN) and the Bertelsmann
Stiftung Foundation, that provides data that due to
methodological limitations are not comparable year-
by-year.
Nevertheless, we believe that the main
contribution of this study is the innovative and
interesting methodological approach to evaluate the
progress in the accomplishment of the SDGs and the
2030 Agenda, offering a new tool to policy-makers
and decision-makers to set development priorities and
to identify opportunities or synergies to accelerate the
accomplishment of the SDGs, based on complexity
measures. Additionally, this index may provide a
more synthetic summary to help predicting better
adjustment policies.
Finally, considering that the methodology
proposed in this study it is relatively new and the
literature background of its implementation it is still
relatively low, we suggest further studies in order to
improve the experimentation and validation of the
SCI and GCI for the analysis of the SDGs worldwide.
ACKNOWLEDGEMENTS
The authors are very grateful to the Paraguayan
National Council of Science and Technology
(CONACyT) for financial support through the project
PINV15-531 and PRONII Program.
REFERENCES
Abdon, A., Felipe, J., 2011. The Product Space: What Does
It Say About the Opportunities for Growth and
Structural Transformation of Sub-Saharan Africa?.
Working Paper No. 670, Levy Economic Institute of
Bard College.
Alcamo, J., 2019. Water quality and its interlinkages with
the Sustainable Development Goals. Current Opinion in
Environmental Sustainability, 36, pp. 126–140.
SDG GCI
SDG12 1,65700123
SDG13 1,57927816
SDG17 1,22489455
SDG15 0,98658457
SDG6 0,56162096
SDG16 0,21317229
SDG11 0,1373906
SDG5 ‐0,0195058
SDG10 ‐0,07001025
SDG1 ‐0,07214902
SDG14 ‐0,19094156
SDG8 ‐0,28877772
SDG2 ‐0,6670405
SDG4 ‐0,7780202
SDG7 ‐0,9705432
SDG3 ‐1,24560092
SDG9 ‐2,05735319
COMPLEXIS 2021 - 6th International Conference on Complexity, Future Information Systems and Risk
22

Allen, C., Metternich, G., Wiedmann, T., 2018. Prioritising
SDG targets: assessing baselines, gaps and
interlinkages. Sustainability Science.
https://doi.org/10.1007/s11625-018-0596-8
Allen, C., Metternich, G., Wiedmann, T., 2018a. Initial
progress in implementing the Sustainable Development
Goals (SDGs): a review of evidence from countries.
Sustainability Science. https://doi.org/10.1007/s11625-
018-0572-3
Balassa, B., 1965. Trade liberalisation and “revealed”
comparative advantage. Manch Sch, 33(2), pp.99–123.
http://dx.doi.org/10.1111/j.1467-9957.1965.tb00050.x.
Bleischwitz, R., Spataru, C., VanDeveer, S.D., Obersteiner,
M., van der Voet, E., Johnson, C., Andrews-Speed, P.,
Boersma, T., Hoff, H., van Vuuren, D.P., 2018.
Resource nexus perspectives towards the United
Nations Sustainable Development Goals. Nature
Sustainability, Volume 1, pp. 737-743.
https://doi.org/10.1038/s41893-018-0173-2
Dargin, J., Daher, B., Mohtar, R.H., 2019. Complexity
versus simplicity in water energy food nexus (WEF)
assessment tools. Science of the Total Environment,
650, pp. 1566–1575. https://doi.org/10.1016/j.
scitotenv.2018.09.080
Dörgo, G., Sebestyén, V., Abonyi, J., 2018. Evaluating the
Interconnectedness of the Sustainable Development
Goals Based on the Causality Analysis of Sustainability
Indicators. Sustainability 2018, 10, 3766;
doi:10.3390/su10103766
El-Maghrabi, M. H., Gable, S., Osorio Rodarte, I., Verbeek,
J., 2018. Sustainable Development Goals Diagnostics:
An Application of Network Theory and Complexity
Measures to Set Country Priorities. World Bank Group
- Office of the Senior Vice President UN Relations and
Partnerships. Policy Research Working Paper 8481,
WPS8481.
Felipe J, Hidalgo CA. Economic diversification:
implications for Kazakhstan. Development and modern
industrial policy in practice. Issues and country
experiences. Cheltenham UK: Edward Elgar Pub; 2015.
Gusmao, R.G., Leal Filho, W., Gonçalves, O.L., de Mattos,
D.L., Veigas, L., 2018. A literature-based review on
potentials and constraints in the implementation of the
sustainable development goals. Journal of Cleaner
Production, 198, pp. 1276-1288.
https://doi.org/10.1016/j.jclepro.2018.07.102
Hausmann R, Hidalgo CA, Bustos S, Coscia M, Chung S,
Jimenez J., Simoes, A., Yildirim, M., 2011. The Atlas
of economic complexity: mapping paths to prosperity.
Cambridge, Mass: Center for International
Development, Harvard University; Harvard Kennedy
School; Macro Connections, Massachusetts Institute of
Technology
Hausmann, R., & Hidalgo, C. A. (2011). The network
structure of economic output. Journal of Economic
Growth, 16(4), 309–342. DOI:10.1007/s10887-011-
9071-4
Hausmann R, Klinger B. Growth diagnostic: Peru. Inter-
American Development Bank; 2008a. Tech. Rep.
Hausmann R, Klinger B. Achieving export-led growth in
Colombia Tech Rep. 2008. p. 2008.
Hausmann R, Hwang J, Rodrik D. What you export matters.
J Econ Growth 2007;12(1):1–25.
http://dx.doi.org/10.1007/s10887-006-9009-4.
Hausmann, R., Morales, J.R., Santos, M.A., 2016.
Economic Complexity in Panama: Assessing
Opportunities for Productive Diversification. HKS
Faculty Research Working Paper Series RWP16-046.
Hausmann, R., Hidalgo, C.A., Stock, D.P., Yildirim, M.A.,
2014. Implied Comparative Advantage. CID Working
Paper No. 276
Hidalgo CA, Hausmann R. The building blocks of
economic complexity. Proc Natl Acad Sci USA
2009;106(26):10570–5. http://dx.doi.org/10.1073/pnas.
Hidalgo CA, Klinger B, Barabási A-L, Hausmann R. The
product space conditions the development of nations.
Science (Wash D C) 2007;317(5837):482–7.
http://dx.doi.org/10.1126/science.1144581.
ICSU, ISSC, 2015.Review of the Sustainable Development
Goals: The Science Perspective. Paris: International
Council for Science (ICSU). ISBN: 978-0-930357-97-9
International Council for Science (ICSU), 2017. A Guide to
SDG Interactions: from Science to Implementation
[D.J. Griggs, M. Nilsson, A. Stevance, D. McCollum
(eds)]. International Council for Science, Paris. DOI:
10.24948/2017.01
Le Blanc, D., 2015. Towards Integration at Last? The
Sustainable Development Goals as a Network of
Targets. Sustainable Development, 23, pp. 176-187.
DOI: 10.1002/sd.1582
Liu, J., Hull, V., Godfray, H.C.J., Tilman, D., Gleick, P.,
Hoff, H., Pahl-Wostl, C., Xu, Z., Chung, M.G., Sun, J.,
Li, S., 2018Nexus approaches to global sustainable
development. Nature Sustainability, Volume 1, pp.
466-476. https://doi.org/10.1038/s41893-018-0135-8
Lusseau, D., Mancini, F., 2018. Income-based variation in
Sustainable Development Goal interaction networks.
Nature Sustainability. https://doi.org/10.1038/s41893-
019-0231-4
Karnib, A., 2017. Mapping the direct and indirect
interlinkages across the sustainable development goals:
A qualitative nexus approach. International Journal of
Development and Sustainability, Volume 6, No. 9, pp.
1150-1158.
Maes, M., Jones, K., Toledano, M. Milligan, B., 2019.
Mapping synergies and trade-offs between urban
ecosystems and the sustainable development goals.
Environmental Science and Policy, 93, pp. 181 -188.
https://doi.org/10.1016/j.envsci.2018.12.010
McGowan, P.J.K., Stewart, G.B., Long, G., Grainger, M.J.,
2018. An imperfect vision of indivisibility in the
Sustainable Development Goals. Nature Sustainability,
Brief Communication. https://doi.org/10.1038/s41893-
018-0190-1
McCollum, D.L., Gomez, L., Busch, S., Pachauri, S.,
Parkinson, S., Rogelj, J., Krey, V., Minx, J.C., Nilsson,
M., Stevance, A-S., Riahi, K., 2018. Connecting the
sustainable development goals by their energy inter-
Complexity Measures for the Analysis of SDG Interlinkages: A Methodological Approach
23

linkages. Environmental Research Letters 13.
https://doi.org/10.1088/1748-9326/aaafe3
Moyer, J., Bohl, D., 2019. Alternative pathways to human
development: Assessing trade-offs and synergies in
achieving the Sustainable Development Goals. Futures,
105, pp.199-210. https://doi.org/10.1016/j.futures.
2018.10.007
Nerini, F., Tomei, J., Seng To, L., Bisaga, I., Parikh, P.,
Black, M., Borrion, A., Spataru, C., Castán, V.,
Anandarajah, G., Milligan, B., Mulugetta, Y., 2017.
Mapping synergies and trade-offs between energy and
the Sustainable Development Goals. Nature Energy.
https://doi.org/10.1038/s41560-017-0036-5
Nilsson, M., Griggs, D., Visbeck, M., 2016. Map the
interactions between Sustainable Development Goals.
Nature, Volume 534, pp. 320-322.
Nilsson, M., Chisholm, E., Griggs, D., Howden-Chapman,
P., McCollum, D., Messerli, P., Neumann, B.,
Stevance, A-S, Visbeck, M., Stafford-Smith, M., 2018.
Mapping interactions between the sustainable
development goals: lessons learned and ways forward.
Sustainability Science, 13, pp. 1489-1503.
https://doi.org/10.1007/s11625-018-0604-z
Ourens, G., 2012. Uuruguay al espajo: Análisis de la
estructura productiva uruguaya a través del Métdo de
los Reflejos. Revista de Economía, Vol. 19, Nº 1, Mayo
2012. ISSN: 0797-5546.
Pedrosa-Garcia, J.A., 2018. Mapping Synergies and
Tradeoffs in the Sustainable Development Goals
Network: A Case Study from Jordan. Economic and
Social Commission for Western Asia (ESCWA).
E/ESCWA/SDD/2017/WP.2
Sachs, J., Schmidt-Traub, G., Kroll, C., Lafortune, G.,
Fuller, G., 2018. SDG Index and Dashboards Report
2018. New York: Bertelsmann Stiftung and Sustainable
Development Solutions Network(SDSN).
http://sdgindex.org/reports/2018/
Salvia, A., Leal Filho, W., Brandli, L., Griebeler, J., 2019.
Assessing research trends related to Sustainable
Development Goals: local and global issues. Journal of
Cleaner Production, 208, pp. 841-849.
https://doi.org/10.1016/j.jclepro.2018.09.242
Scherer, L., Behrens, P., de Koning, A., Heijungs, R.,
Sprecher, B., Tukker, A., 2018.Trade-offs between
social and environmental Sustainable Development
Goals. Environmental Science and Policy, 90, pp. 65-
72. https://doi.org/10.1016/j.envsci.2018.10.002
Schmidt-Traub, G., Kroll, C., Teksoz, K., Durand-Delacre,
D., Sachs, J., 2017. National baselines for the
Sustainable Development Goals assessed in the SDG
Index and Dashboards. Nature Geoscience, Vol.10, pp.
546-556. DOI: 10.1038/NGEO2985
Singh, G., Cisneros-Montemayor, A.M., Swartz, W.,
Cheung, W., Guy, J.A., Kenny, T-A., McOwen, C.J.,
Asch, R., Geffert, J.L., Wabnitz, C., Sumaila, R.,
Hanich, Q., Ota, Y., 2018. A rapid assessment of co-
benefits and trade-offs among Sustainable
Development Goals. Marine Policy, 93, pp. 223-231.
http://dx.doi.org/10.1016/j.marpol.2017.05.030
Taylor, P., Abdalla, K., Quadrelli, R., Vera, I., 2017. Better
energy indicators for sustainable development. Nature
Energy, 2, pp.1-4. DOI: 10.1038/nenergy.2017.117
United Nations, Synthesis of voluntary national reviews
2016. Department of Economic and Social Affairs,
New York, 2016.
United Nations, Report of the Open Working Group of the
General Assembly on Sustainable Development Goals,
A/68/970: New York, 2014
UNCTAD (United Nations Conference on Trade and
Development): World investment report. 2014
https://unctad.org/en/PublicationsLibrary/wir2014_en.
pdf
United Nations, General Assembly: Transforming our
world: the 2030 Agenda for Sustainable Development,
A/RES/70/1: New York, 2015.
Vaillant M, Ferreira-Coimbra N. Evolución del espacio de
productos exportados: ¿está Uruguay en el lugar
equivocado? Germany: University Library
ofMunich;2009. https://mpra.ub.unimuenchen.de/
47286/1/MPRA_paper_47286.pdf.
Vladimirova, K., Le Blanc, D., 2016. Exploring Links
Between Education and Sustainable Development
Goals Through the Lens of UN Flagship Reports.
Sustainable Development. DOI: 10.1002/sd.1626
Weitz, N, Carlsen, H., Nilsson, M., Skanberg, K., 2018.
Towards systemic and contextual priority setting for
implementing the 2030 Agenda. Sustainable Sciences,
13, pp. 531-548 https://doi.org/10.1007/s11625-017-
0470-0
Zelinka, D., & Amadei, B. (2019). Systems Approach for
Modeling Interactions Among the Sustainable
Development Goals Part 1. International Journal of
System Dynamics Applications, 8(1), 23–40.
doi:10.4018/ijsda.2019010102
COMPLEXIS 2021 - 6th International Conference on Complexity, Future Information Systems and Risk
24
