
SMartyTesting: A Model-Based Testing Approach for Deriving Software
Product Line Test Sequences
Kleber L. Petry
1 a
, Edson OliveiraJr
1 b
, Leandro T. Costa
2 c
, Aline Zanin
3 d
and Avelino F. Zorzo
3 e
1
State University of Maring
´
a, Maring
´
a, Brazil
2
Unisinos, Porto Alegre, Brazil
3
PUCRS, Porto Alegre, Brazil
Keywords:
Activity Diagrams, Model-Based Testing, Sequence Diagrams, SMarty, Software Product Line, UML,
Variability.
Abstract:
Code reuse and testing approaches to ensure and to increase productivity and quality in software develop-
ment has grown considerably among process models in recent decades. Software Product Line (SPL) is a
technique in which non-opportunistic reuse is the core of its development process. Given the inherent vari-
ability in products derived from an SPL, an effective way to ensure the quality of such products is to use
testing techniques, which take into account SPL variability in all stages. There are several approaches for
SPL variability management, especially those based on the Unified Modeling Language (UML). The SMarty
approach provides users identification and representation of variability in UML models using stereotypes and
tagged-values. SMarty currently offers a verification technique for its models, such as sequence diagrams, in
the form of checklist-based inspections. However, SMarty does not provide a way to validate models using,
for example, Model-Based Testing (MBT). Thus, this paper presents SMartyTesting, an approach to assist the
generation of test sequences from SMarty sequence diagrams. To evaluate the feasibility of such an approach,
we performed an empirical comparative study with an existing SPL MBT approach (SPLiT-MBt) using activ-
ity diagrams, taking into account two criteria: sequence differentiation, and number of sequences generated.
Results indicate that SMartyTesting is feasible for generating test sequences from SMarty sequence diagrams.
Preliminary evidence relies on generating more test sequences using sequence diagrams than activity diagrams,
thus potentially increasing SPL coverage.
1 INTRODUCTION
Code reuse and step reduction in the software devel-
opment process are techniques that have been adopted
by academia and industry over the years (Almeida,
2019). Furthermore, several approaches have been
developed with the purpose of increasing software
reusability and, consequently, return on investment
(ROI), for example, Software Product Line (SPL).
SPL provides a software reuse-based development
process to achieve greater productivity, cost, time and
risk reduction, and to provide higher product quality
a
https://orcid.org/0000-0001-6949-596X
b
https://orcid.org/0000-0002-4760-1626
c
https://orcid.org/0000-0001-6084-8896
d
https://orcid.org/0000-0002-2542-573X
e
https://orcid.org/0000-0002-0790-6759
(Pohl et al., 2005).
An SPL provides artifacts that can be reused based
on the inherited variability, thus traditional software
development processes are not suitable for the con-
text of SPL as they do not support variability man-
agement, especially those based on Unified Modeling
Language (UML) (Raatikainen et al., 2019).
Several variability management approaches have
been proposed (Raatikainen et al., 2019), for ex-
ample, Stereotype-based Management of Variability
(SMarty) (OliveiraJr et al., 2010). These approaches
use UML stereotypes to represent variability in UML
elements of an SPL.
Even though successful SPL approaches have
been proposed in the past, one of the biggest SPL
challenges remains, i.e., products testing, especially
testing of model-based SPLs due to the inherit vari-
ability and the amount of potential products to be
Petr y, K., OliveiraJr, E., Costa, L., Zanin, A. and Zorzo, A.
SMartyTesting: A Model-Based Testing Approach for Deriving Software Product Line Test Sequences.
DOI: 10.5220/0010373601650172
In Proceedings of the 23rd International Conference on Enterprise Information Systems (ICEIS 2021) - Volume 2, pages 165-172
ISBN: 978-989-758-509-8
Copyright
c
2021 by SCITEPRESS – Science and Technology Publications, Lda. All rights reserved
165

tested (Petry et al., 2020; Machado et al., 2014;
Lamancha et al., 2013).
As testing all products is unfeasible, in this paper
we consider generating test sequences to be reused
during SPL generated products testing. To address
some of the above mentioned issues, we specified a
Model-Based Testing (MBT) approach, named SMar-
tyTesting, which uses UML sequence diagrams to
generate SPL test sequences. Such kind of diagram
contains variability modeled according to the SMarty
approach. We chose sequence diagrams due to its
large amount of details and the possibility to repre-
sent more variability than any other UML diagrams.
Therefore, we want to answer the following re-
search question: “Is SMartyTesting feasible to derive
test sequences from sequence diagrams?”
2 BACKGROUND AND RELATED
WORK
2.1 Software Product Lines and
Variability Management
A Software Product Line (SPL) is a set of systems that
share common and manageable characteristics (Pohl
et al., 2005). Pohl et al. (2005) developed a frame-
work for SPL engineering, which aims to incorporate
the core concepts of traditional product line engineer-
ing, providing artifact reuse and mass customization
through variability. Such framework is divided into
two main phases: Domain Engineering, in which
similarities and variability of SPLs are identified and
represented; and Application Engineering, in which
SPL-specific products are built by reusing domain ar-
tifacts, exploring the variability of an SPL.
Variability is the term used to differentiate prod-
ucts from an SPL. It is usually described by: i) vari-
ation point, which is a specific location in a generic
artifact; ii) variant, which represents the possible ele-
ments to be chosen to resolve a variation point and;
and, iii) constraints between variants, which estab-
lish relationships between one or more variants to re-
solve their respective variation points or variability
at a given resolution time (Pohl et al., 2005). There
are several approaches to manage variability, espe-
cially those based on UML (Raatikainen et al., 2019).
These include the Stereotype-based Management of
Variability (SMarty) (OliveiraJr et al., 2010).
The motivation for choosing SMarty among other
variability management approaches based on UML
notation, is that it can be easily extended, it has a
low learning curve, it supports many models, it is able
to represent variability information in UML elements
by using tagged values and stereotypes and, different
from other approaches, it defines a stereotype to rep-
resent inclusive variants.
SMartyProfile provides the following stereotypes:
<<variability>> to represent the concept of vari-
ability; <<variationPoint>> to represent a varia-
tion point; <<mandatory>> to represent variants
present in every product; <<optional>> to rep-
resent variants that might be present in a product;
<<alternative OR>> to represent variants of an in-
clusive group; <<alternative XOR>> to represent
variants of an exclusive group; <<mutex>> to de-
note the concept of mutual exclusion between two
variants; <<requires>> to represent variants that
need another one to be part of a product.
2.2 Model-Based Testing of SPLs
Model-Based Testing (MBT) aims to automate the
generation of test artifacts, e.g. test cases and test se-
quences, based on system models describing the soft-
ware requirements. The basic idea is to identify and
to build an abstract model that represents the behavior
of the System Under Test (SUT). Based on this model
it is possible to generate a large number of test cases
even in product modeling (Devroey, 2014).
Such test cases, which are derived from models,
are known as the abstract test suite, and their level
of abstraction is closely related to the level of model
abstraction (Isa et al., 2017). The advantages of the
MBT approach is that test generation starts early in
the development cycle and test cases can be created
automatically from a template. Test cases can be rep-
resented using Unified Modeling Language (UML)
(Isa et al., 2017) decision trees, statecharts, domain
ontologies, or use case diagrams and or states.
MBT can be applied to an SPL context. For exam-
ple, Machado et al. (2014) point out SPL tests should
be considered in Domain and Application Engineer-
ing. Within the interest of testing, two items should
be considered: the product requirements set and the
quality of the variability model under test.
Based on this scenario, one of the biggest chal-
lenges in SPL testing is related to the particularities
of each model. To this end, MBT seeks to create Do-
main Engineering models to generate test cases that
can be reused in the Application Engineering phase.
Machado et al. (2014), for example, focus on building
the early generation of SPL domain modeling tests.
ICEIS 2021 - 23rd International Conference on Enterprise Information Systems
166

2.3 The SPLiT-MBt Method
Software Product Line Testing Method Based on Sys-
tem Models (SPLiT-MBt) (Costa, 2016) is a method
to support automatic generation of functional test
cases from SMarty activity diagrams modeled ac-
cording to SMarty. The idea is to generate test arti-
facts during Domain Engineering and reuse them dur-
ing Application Engineering. Figure 1 presents the
steps of the SPLiT-MBt method.
The method is applied in two steps. The first one
occurs during Domain Engineering, when test and
variability information are extracted from UML mod-
els. For SPLiT-MBt it is assumed that these models
were previously designed by the SPL analyst using
SMarty. Therefore, a test analyst uses SPLiT-MBt
to add test information on two UML diagrams, i.e.
Use Case and Activity Diagrams. Then, once the Use
Case and Activity Diagrams are annotated with test
information, the test analyst uses SPLiT-MBt to gen-
erate Finite State Machines (FSMs) from these UML
diagrams. These FSMs are extended in an SPL con-
text and are used as input to generate test sequences
with variability information. These test sequences
are generated through extending conventional test se-
quence generation methods in an SPL context, e.g.,
the Harmonized State Identifiers (HSI). The test se-
quences generated through applying these modified
methods are stored in a test repository and the vari-
ability present in these sequences is resolved during
Application Engineering.
The second step of SPLiT-MBt takes place during
Application Engineering, when the variability present
in those test sequences is resolved to meet the specific
requirements of each system. The generated test se-
quences are stored in a repository, which can be used
in Application Engineering.
2.4 Related Work
Based on the MBT concepts, Petry et al. (2020) ana-
lyzed 44 primary studies, from which a small subset
of them takes into account sequence diagrams to gen-
erate SPL test sequences, as we do with SMartyTest-
ing (Section 3). Such studies are discussed as follows,
as we did with SPLiT-MBt in Section 2.3.
Lamancha et al. (2009) describe an MBT ap-
proach, which takes into account the OMG Testing
Profile for deployment of industrial software tools.
Process inputs are templates described in UML 2.0,
while outputs consist of artifacts according to such
profile. The transformation process for generat-
ing test sequences is based on OMG Query-View-
Transformation (QVT) 1.2 scripts. It takes use case
diagrams and sequence diagrams as input artifacts.
They work directly with the UML metamodel, per-
forming a sequence diagram conversion into test se-
quences and cases. However, it is not explicit whether
they consider variability for testing products.
Lamancha et al. (2013) present an MBT approach
for model-driven projects and SPLs. The approach
uses OMG standards and defines transformations
from design models to test models. Furthermore,
it was implemented as a framework using modeling
tools and QVT transformations. The contributions re-
lated to it and applied in a conversion implementation
provide improvements in the use of the QVT model,
as well as the specificity of generating test cases from
a previously converted sequence diagram. Lamancha
et al. (2010) also present improvements on the use of
sequence diagrams for a micro vision artifact testing
process for a macro view, without losing the proper-
ties and details of the sequence diagram. We do not
use QVT transformations in our work.
3 THE SMartyTesting APPROACH
This section presents the characterization and de-
sign of the SMartyTesting approach for generating
test sequences in the SPL Domain Engineering from
SMarty sequence diagrams.
SMartyTesting starts at an early stage of SPL de-
velopment taking into consideration use cases and
their basic and alternative flows and sequence dia-
grams (Stage 1). After that, it manually converts a
sequence diagram into an activity diagram (Stage 2).
Finally, SMartyTesting, in its Stage 3, uses the SPLiT-
MBt method infrastructure based on the Domain
Test Sequence Generation (c) from Figure 1 to
automate the test sequence generation
3.1 Modeling Sequence Diagrams from
Use Cases
This is a knowledge-based process in which an
UML-based SPL Expert takes into account the exist-
ing Use Cases and their basic and alternative flows
description for a certain SPL to model a Sequence
Diagram containing variabilities.
Such modeling may be performed using general
purpose UML tools, such as Astah
1
or our tool named
SMartyModeling.
1
http://astah.net
SMartyTesting: A Model-Based Testing Approach for Deriving Software Product Line Test Sequences
167
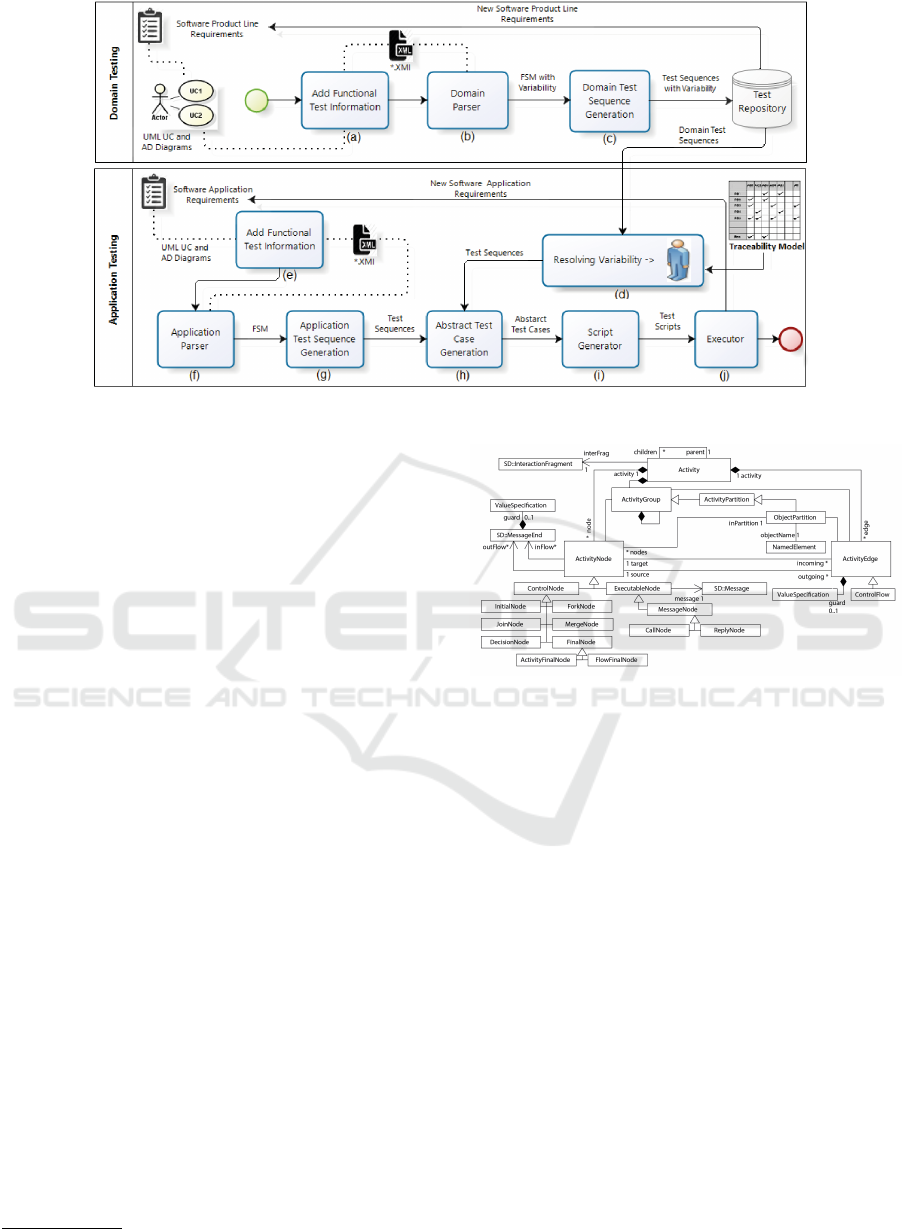
Figure 1: The SPLiT-MBt method (Costa, 2016).
3.2 Converting Sequence Diagrams to
Activity Diagrams
As we are taking advantage of the existing SPLiT-
MBt HSI-based engine to generate test sequences,
we need to convert sequence diagrams to activity di-
agrams. Activity diagram demonstrates the flow of
control from one activity to another, as well as ac-
tivities concurrency. Therefore, while a sequence dia-
gram is closer to methods and source code, an activity
diagram is closer to use cases in terms of abstraction.
Based on Garousi et al. (2005), through convert-
ing sequence diagram to activity diagram there is no
risk of distortion of properties, maintaining the orig-
inal characteristics and the variability contained in
the sequence diagram. Validation of this conversion
was performed by Swain et al. (2010). Furthermore,
Garousi et al. (2005) proposal consists of a control
flow analysis methodology based on UML 2.0 Se-
quence Diagrams (SD). This technique can be used
throughout the development cycle and other testing
approaches that make model understanding and exe-
cution. This technique can be used in SD-based sys-
tems among several applications.
Based on well-defined activity diagrams, the
proposed Control Flow Analysis of UML 2.0 Se-
quence Diagrams (Garousi et al., 2005) brings an
extended activity diagram metamodel (Figure 2) to
support control flow analysis of sequence diagrams.
Thus, one can define an Object Constraint Language
(OCL)
2
mapping for describing the rules that apply to
UML models.
OCL application is formally performed and veri-
2
https://www.omg.org/spec/OCL
Figure 2: CCFG metamodel (Extended Activity Diagrams)
(Garousi et al., 2005).
fiable with consistency rules between an SD and an
extended activity diagram using Constraint Control
Flow Graph (CCFG). CCFG has all necessary classes
and associations, as well as support for concurrent
control (concurrency) flow paths, which are a gen-
eralization of the conventional (Garousi et al., 2005)
control flow path concept.
The mapping consists of the use of an SD meta-
model (Figure 3) and a set of rules to be used in such
conversion, in which the CCFG metamodel (Figure 2)
is considered as validator.
To perform the activity mapping using CCFG, a
set of rules created from the Garousi et al. (2005)
metamodels is used. The rules are presented in Ta-
ble 1.
3.3 Automating Test Sequence
Generation
SPLiT-MBt makes use of the HSI generation method.
According to Costa (2016), the reason for choosing
ICEIS 2021 - 23rd International Conference on Enterprise Information Systems
168
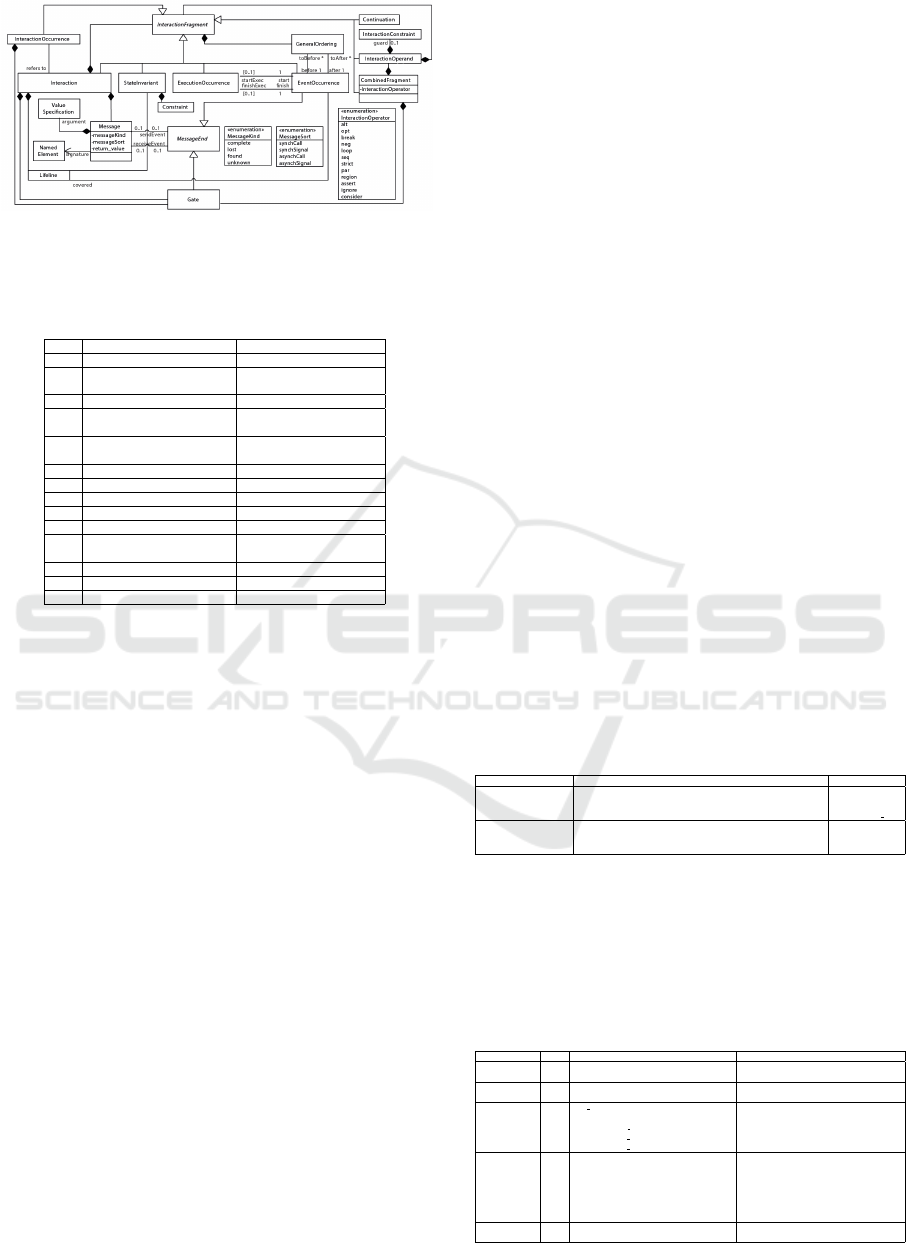
Figure 3: UML sequence diagram metamodel (Garousi
et al., 2005).
Table 1: Rules used for sequence diagram to activity dia-
gram conversion (Garousi et al., 2005).
Ord. Sequence Diagram Element CCFG Activity Diagram
1 Interaction Activity
2 First message end
Flow between InitialNode
and first control node
3 SynchCall/SynchSignal CallNode
4 AsynchCall or AsynchSignal
(CallNode+ForkNode) or
ReplyNode
5
Message SendEvent and
ReceiveEvent
ControlFlow
6 Lifeline ObjectPartition
7 par CombinedFragment ForkNode
8 loop CombinedFragment DecisionNode
9 alt/opt CombinedFragment DecisionNode
10 break CombinedFragment ActivityEdge
11 Last message ends
Flow between end control
nodes and FinalNode
12 InteractionOccurrence Control Flow across CCFGs
13 Polymorphic message DecisionNode
14 Nested InteractionFragmen Nested CCFGs
this method is because it is one of the least restric-
tive methods with respect to the properties that Finite
State Machines (FSM) should have. For example,
HSI is capable of interpreting full and partial FSMs
(Costa, 2016). Furthermore, the HSI method allows
full coverage of existing faults and generates shorter
test sequences than other methods, which contributes
to an optimized test process. These factors are very
relevant in the context of SPL, because the more fea-
tures in an SPL, the more test cases it takes to test SPL
products (Engstr
¨
om and Runeson, 2011).
SPLiT-MBt accepts an input file in the XML for-
mat, reads the file, and validates all artifact input re-
quirements. If it is correct, the structure is assembled
and it converts the activity diagram into an FSM at
runtime and performs the process of generating test
sequences containing variabilities from the respective
activity diagram. Therefore, such sequences are ready
to be used for testing SPL products by resolving their
variabilities. The test scripts generated by SPLiT-MBt
have a tabular format. These scripts are imported by
a testing tool, e.g. MTM, for the test execution.
An example of how SMartyTesting is used is pre-
sented along with its evaluation in Section 4.
4 FEASIBILITY STUDY OF
SMartyTesting
This study aims to: characterize the SMartyTesting
approach, with the purpose of identifying its feasi-
bility with respect to test sequence generating ca-
pacity from sequence diagrams in the perspective of
SPL researchers, in the context of lecturers and grad-
uate students of Software Engineering.
Based on the above mentioned goal, we de-
fined the following research questions: RQ.1 - Can
SMartyTesting generate more test sequences from se-
quence diagrams than SPLiT-MBt using activity di-
agrams?; and RQ.2 - Is there any difference among
generated test sequences from sequence diagrams
compared to activity diagrams?.
To achieve the objective of this study, the follow-
ing criteria were defined: CT.1: Number of gener-
ated test sequences. It is the total number of gen-
erated test sequences by each approach (SMartyTest-
ing and SPLiT-MBt); and CT.2: Differentiation be-
tween generated sequences. Input artifacts of each
approach differ from each other because of the par-
ticularities of the initial model. Thus, one can obtain
different sequence paths, demonstrating that different
paths have been taken, differing from each other.
For the generation of the test sequences, we se-
lected two diagrams. Table 2 contains characteristics
and variability of each diagram.
Table 2: Diagrams used in the process of generating test
sequences.
Models Feature Variability
Play Selected Game
Fig:4 (AD)
Fig:7 (SD)
Play Selected Game is the representation of the game menu.
Through it is made the selection of which
game will be played.
-variation point
-variability
-alternative OR
Save Game
Fig:5 (AD)
Fig:6 (SD)
Save Game is the action of saving the game. -mandatory
For test sequence generation with SPLiT-MBt, Ta-
ble 3 lists the generated test sequences of an activ-
ity diagram for the AGM SPL Play Selected Game
(Costa, 2016) (Figure 4).
Table 3: SPLiT-MBt test sequences generated from Figure
4.
Test Sequence
Step Action/Description Expected result
Test Case 1 1
Initialization
- Select Play from menu;
Creates the default instances of the required
classes.
Test Case 1 2
Initialize the game
- Left-click Button to begin play;
Start the game action and the animation
begins.
Test Case 1 3
VP Initialize the game
- {;
- b{alternative OR};
- c{alternative OR};
- a{alternative OR}};
{.
The paddles and disc begin to move.
The ball begins to move.
Move racket horizontally
to follow mouse track }.
Test Case 1 4
Responds to Won/Lost/Tied Dialog
- {;
- Responds to Won/Lost/Tied dialog;
- Responds to Won/Lost/Tied dialog;
- Responds to Won/Lost/Tied dialog };
{.
Return to the initial state of the
tray.
Return to the initial state of the
tray.
Playback dialog
is displayed again}.
Test Case 1 5
Initialization
- Respond“yes” in the dialog to play again;
Returns the game board to its
initialized state, ready to play.
SMartyTesting: A Model-Based Testing Approach for Deriving Software Product Line Test Sequences
169
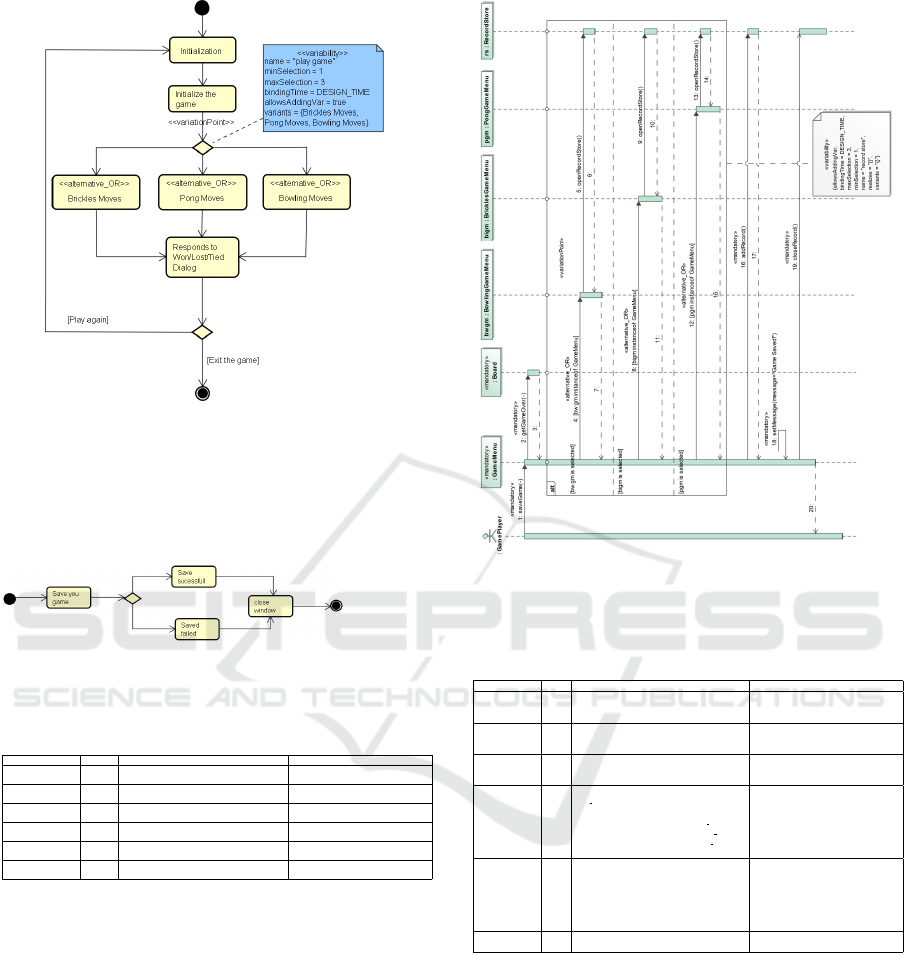
Figure 4: Activity diagram of Play Selected Game
(Costa, 2016).
Table 4 lists the generated test sequences of Figure 5,
which is an activity diagram for the AGM SPL Save
Game.
Figure 5: Activity diagram of Save Game (Costa, 2016).
Table 4: SPLiT-MBt test sequences generated from Figure
5.
Test Sequence
Step Action / Description Expected result
Test Case 1 1
Save your game
- save GAME window is shown;
Finish the game.
Test Case 1 2
Saved failed
- click SAVE GAME button;
message SAVE failed game is shown.
Test Case 1 3
close window
- Click close SAVE THE GAME;
The SAVE GAME window is closed.
Test Case 2 1
Save your game
- save GAME window is showed;
Finish the game.
Test Case 2 2
Save successful
- click SAVE GAME button;
SAVE GAME message is shown.
Test Case 2 3
close window
- click close SAVE GAME button;
The SAVE GAME window is closed.
For test sequence generation with SMartyTesting, we
used the sequence diagrams created by Marcolino
et al. (2017), which are equivalent to those created
by Costa (2016).
This equivalence is due to the used level of ab-
straction. An example is in Figure 5, which represents
Save Game, in which two conditions are observed:
save successful or save failed. In this paper, we also
represent the save success condition in Figure 6.
Figure 7 depicts a sequence diagram and Figure
8 the converted activity diagram of the AGM Play
Selected Game (Marcolino et al., 2017). Thus, Ta-
ble 5 displays generated test sequences for the AD of
Figure 8.
Figure 6 depicts the sequence diagram for the
Figure 6: Sequence diagram for Save Game (Marcolino
et al., 2017).
Table 5: SMartyTesting test sequences generated from Fig-
ure 8.
Test Sequence
Step Action / Description Expected result
Test Case 1 1
1:loadGame(-)
- Game Player start
loadGame method{Mandatory};
loadGame is loaded.
Test Case 1 2
2:getNumRecords()
- Game menu after loading makes
use method getNumRecords{Mandatory};
access data from recordStore.
Test Case 1 3
3:return
- recordStore send return messages;
Score data is
returned by
getNumrecords to GameMenu.
Test Case 1 4
VP 3:return
- {;
- Bw option is selected{alternative OR};
- Bigm option is selected{alternative OR};
- Pgm option is selected{alternative OR}};
{.
Instance feature of option
bowling.
instance feature of option
bigm brickles.
instance feature of option
pong}.
Test Case 1 5
5 - 7 - 9:return
- {;
- Return of option bw;
- Return of option bigm;
- Return of option pgm };
{.
Returns after bw instanceof
GameMenu is executed.
Returns after bigm instanceof
GameMenu is executed.
Returns after pgm instanceof
GameMenu is executed}.
Test Case 1 6
10:return
- Returning Information to the Game Player;
Player gets return from chosen action.
AGM SPL Save Game (Marcolino et al., 2017) and
Figure 9 its converted activity diagram.
Table 6 displays the generated test sequences from
Figure 9.
The number of test sequences generated (CT.1)
for each activity diagram using original SPLiT-MBt
compared to SMartyTesting is: Play Selected Game,
six sequences for SMartyTesting and five for SPLiT-
MBt; and Save Game, 12 for SMartyTesting and six
for SPLiT-MBt.
Based on data, we can observe that when using se-
quence diagrams (SMartyTesting) the number of test
ICEIS 2021 - 23rd International Conference on Enterprise Information Systems
170
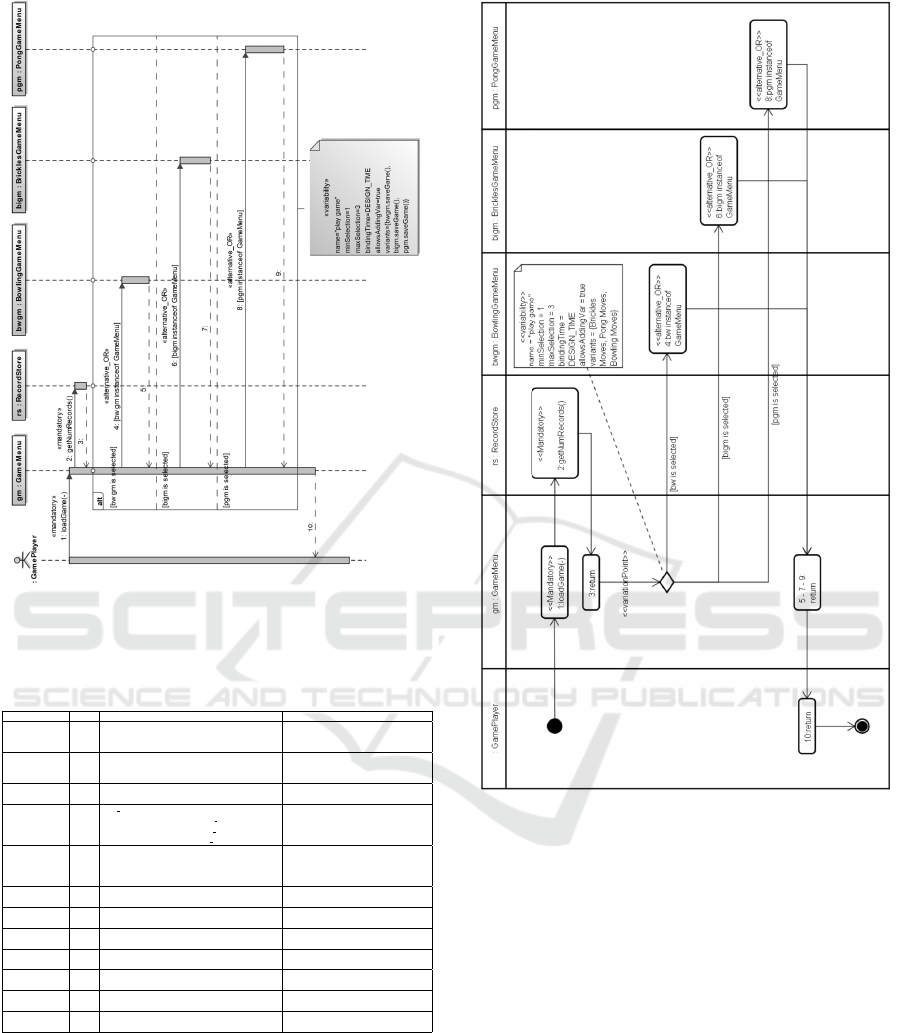
Figure 7: Sequence diagram for Play Selected Game
(Marcolino et al., 2017).
Table 6: SMartyTesting test sequences generated from Fig-
ure 9.
Test Sequence
Step Action / Description Expected result
Test Case 1 1
1:saveGame(-)
- GamePlayer start method
saveGame{mandatory};
GameMenu is loaded.
Test Case 1 2
2:getGameOver(-)
- GameMenu start method
getGameOver{mandatory};
Board check action.
Test Case 1 3
3:return
- Board returns request;
Value returns to selected game.
Test Case 1 4
VP 3:return
- {; bw is selected{alternative OR};
- bigm is selected{alternative OR};
- pgm is selected{alternative OR}};
{.
start method instanceofGameMenu.
start method instanceofGameMenu.
start method instanceofGameMenu}.
Test Case 1 5
5-9-13:openRecordStore()
- {; bw send data to method openRecordStore;
- bigm send data to method openRecordStore;
- pgm send data to method openRecordStore};
{.
data are used by openRecordStore.
data are used by openRecordStore.
data are used by openRecordStore}.
Test Case 1 6
6-10-14:return
- operRecordStore returns to bw - bigm - pgm;
confirms that you have data available.
Test Case 1 7
7-11-15:return
- Return data to GameMenu;
Available data is returned
to be added.
Test Case 1 8
16:addRecord()
- triggered method addRecord{mandatory};
Data is saved.
Test Case 1 9
17:return
- returns action of addRecord;
Confirms data persistence.
Test Case 1 10
18:setMessage(message=”Game Saved!”)
- triggers confirmation message{mandatory};
Confirmation message displayed.
Test Case 1 11
19:closeRecord()
- start method closeRecord{mandatory};
Method terminates operation.
Test Case 1 12
20:return
- return operation confirmation;
Successfully completed return
Confirmation to user
sequences tends to be considerably higher than using
directly activity diagrams (SPLiT-MBt). We under-
stand, therefore, that this can be determined by the
level of abstraction of the diagram: the more abstract,
the fewer test sequences.
If we consider the level of abstraction of each di-
agram, we believe that SMartyTesting has the poten-
tial to generate more test sequences than SPLiT-MBt.
Figure 8: Activity diagram for Play Selected Game.
from Figure 7.
Therefore, there is preliminary evidence that SMar-
tyTesting is able to generate a larger number of test
sequences using sequence diagrams than SPLiT-MBt
using activity diagrams directly.
For difference between generated sequences
(CT.2), we look at the input diagrams of both ap-
proaches, in which their similarities are made by
equivalence, we identified that there is a significant
difference among generated test sequences, answer-
ing RQ.2. We also believe this is due to the abstrac-
tion level of each diagram as we expected. Besides,
there is a different applicability to each type of dia-
gram, and because sequence diagrams are more de-
tailed, it is expected that they generate different test
sequences compared to a higher-level diagram. How-
ever, in certain cases the test sequences are almost
equivalent. Therefore, we believe that this depends on
SMartyTesting: A Model-Based Testing Approach for Deriving Software Product Line Test Sequences
171
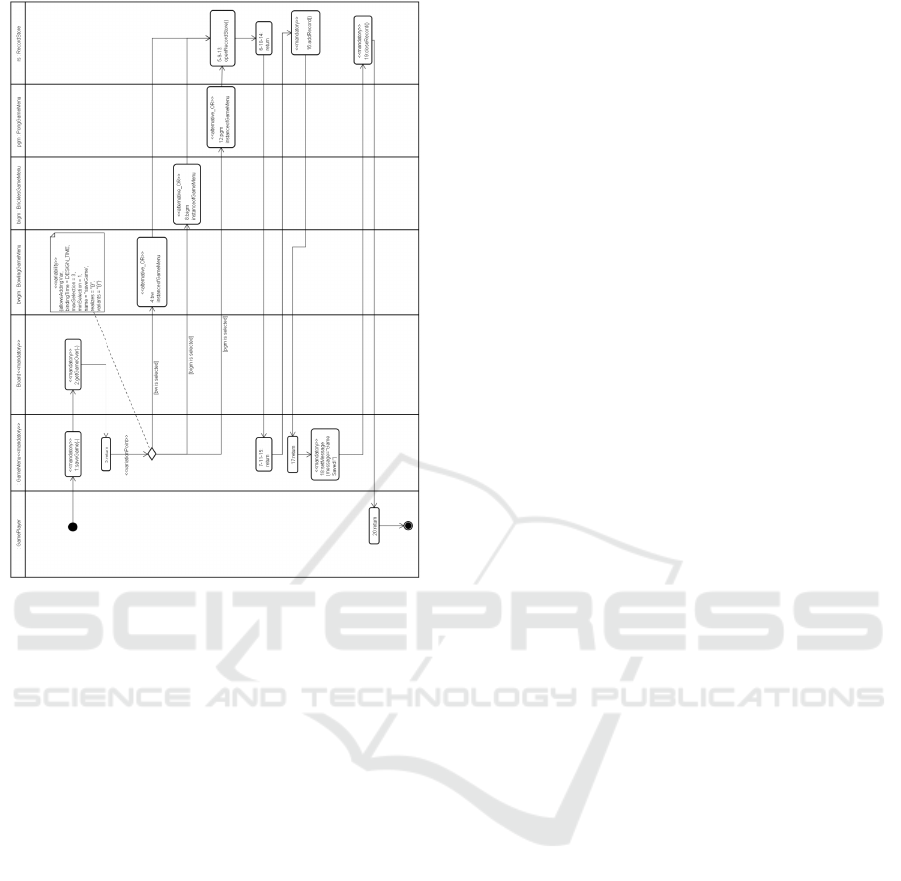
Figure 9: Activity diagram for Save Game from Figure 6.
the level of detail an SPL engineer models sequence
diagrams.
5 CONCLUSION
We compared the SMartyTesting feasibility to SPLiT-
MBt according to two criteria: number of generated
test sequences and difference of sequences using both
approaches.
Results point out SMartyTesting is capable of gen-
erating more test sequences based on the two used di-
agrams. We understand the more the number of test
sequences, the more the test coverage due to a lower
abstraction level of sequence diagrams compared to
activity diagrams. Test sequences generated by both
approaches are overall similar. We believe this de-
pends on the level of details expressed by the SPL
engineer at modeling sequence diagrams.
We plan as future work the full automation of
SMatyTesting by implementing a module to convert
sequence diagrams to finite state machines with no
need of the activity diagram as an intermediate arti-
fact.
REFERENCES
Almeida, E. S. (2019). Software Reuse and Product Line
Engineering. In Cha, S., Taylor, R. N., and Kang,
K., editors, Handbook of Software Engineering, pages
321–348. Springer International Publishing, Cham.
Costa, L. T. (2016). SPLiT-MBt: A model-based testing
method for software product lines. PhD thesis, Pon-
tif
´
ıcia Universidade Cat
´
olica do Rio Grande do Sul.
Devroey, X. (2014). Behavioural model based testing of
software product lines. In SPLC. ACM.
Engstr
¨
om, E. and Runeson, P. (2011). Software product line
testing–a systematic mapping study. Information and
Software Technology, 53(1):2–13.
Garousi, V., Briand, L. C., and Labiche, Y. (2005). Con-
trol flow analysis of uml 2.0 sequence diagrams. In
ECMDA-FA, pages 160–174. Springer.
Isa, M. A. B., Razak, S. B. A., Jawawi, D. N. B. A., and
Fuh, O. L. (2017). Model-based testing for software
product line: A systematic literature review. Int. Jour.
Soft. Eng. and Tech., 2(2).
Lamancha, B. P., Mateo, P. R., de Guzm
´
an, I. R., Usaola,
M. P., and Velthius, M. P. (2009). Automated model-
based testing using the UML testing profile and qvt.
In MODEVVA, page 6. ACM.
Lamancha, B. P., Polo, M., and Piattini, M. (2013). System-
atic review on software product line testing. In CSDT,
pages 58–71. Springer.
Lamancha, B. P., Usaola, M. P., and Velthius, M. P. (2010).
A model based testing approach for model-driven de-
velopment and software product lines. In ENASE,
pages 193–208. Springer.
Machado, I., Mcgregor, J. D., Cavalcanti, Y. C., and
Almeida, E. S. (2014). On strategies for testing soft-
ware product lines: A systematic literature review. Inf.
Sof. Tech., 56(10):1183–1199.
Marcolino, A. S., OliveiraJr, E., Gimenes, I. M., and Bar-
bosa, E. F. (2017). Variability resolution and prod-
uct configuration with SMarty: An experimental study
on uml class diagrams. Journal of Computer Science,
13(8):307–319.
OliveiraJr, E., Gimenes, I. M. S., and Maldonado, J. C.
(2010). Systematic management of variability in uml-
based software product lines. Jour. Univ. Comp. Sci.,
16(17):2374–2393.
Petry, K. L., OliveiraJr, E., and Zorzo, A. F. (2020). Model-
based testing of software product lines: Mapping
study and research roadmap. Journal of Systems and
Software, 167:110608.
Pohl, K., B
¨
ockle, G., and van Der Linden, F. J. (2005). Soft-
ware product line engineering: foundations, princi-
ples and techniques. Springer.
Raatikainen, M., Tiihonen, J., and M
¨
annist
¨
o, T. (2019).
Software product lines and variability modeling: A
tertiary study. Journal of Systems and Software,
149:485 – 510.
Swain, S. K., Mohapatra, D. P., and Mall, R. (2010). Test
case generation based on use case and sequence dia-
gram. International Journal of Software Engineering,
3(2):21–52.
ICEIS 2021 - 23rd International Conference on Enterprise Information Systems
172
