
A Study on Enhanced Fluorescence Signal-to-noise by using the Stray
Light Shutter for Quantitative PCR Chip
Liang-Chieh Chao
1
, Chun-Han Chou
1
, Hsin-Yi Tsai
1
, Kuo-Cheng Huang
1
and Dar-Bin Shieh
2
1
Taiwan Instrument Research Institute, National Applied Research Laboratories, Hsinchu, Taiwan
2
Institute of Oral Medicine, School of Dentistry, National Cheng Kung University, Tainan, Taiwan
Keywords: Quantitative Polymerase Chain Reaction (qPCR), Fluorescence Signal-to-noise, Stray Light Shutter.
Abstract: Quantitative polymerase chain reaction (qPCR) is the most important inspection technique for virus,
especially for coronavirus disease, in this year. The qPCR chip and device were planned to develop because
of the characteristics of fast inspection time, high accuracy and small system volume. Therein, the
fluorescence intensity was the important signal in qPCR device, which represented the positive or negative
reaction after the DNA was amplified and bound on the fluorescence dye, but the fluorescence signal was
easily to be affected by the excitation and scattered light. The mini spectrometer was employed to receive the
fluorescence intensity in PCR chip in this study, and the optical simulation was progressed, and the stray light
shutter (SLS) was added to improve the signal-to-noise ratio (SNR) of fluorescence. The analysis results
showed that the SNR of fluorescence can be enhanced from 3.14 to 16.78 by using the SLS with shape of
extend component aperture, which the protruding structure was at the direction away from center. The results
from this manuscript can provide the important reference information to the developer of qPCR chip, whom
can obtain the high SNR fluorescence signal in qPCR inspection process for disease.
1 INTRODUCTION
Quantitative polymerase chain reaction (qPCR also
called real time PCR, RT PCR) is an important
laboratory technique in molecular biology application
based on the PCR technique, which was one of the
most common method in a large amount of disease
detection, such as virus and bacterial inspection (Espy
et al., 2006). The qPCR technique was widely applied
in clinical disease inspection (Kralik et al., 2017),
especially for the coronavirus disease 2019 in this
year. In qPCR process, the standard double strand
DNA would be separated into two single strand DNA
by increasing the reagent to specific temperature,
which the temperature was about 92-95 ℃ depends
on the reagent. In addition, the specific primer DNA
would bind on the single standard DNA with the
annealing of reagent’s temperature to 58-62 ℃, and
the specific primer DNA will extend while the
temperature raised to about 72 ℃. With the repeat
cycle of increased and decreased temperature of
biological sample included DNA, the amount of DNA
can be amplified with 2 to the 30
th
power in the PCR
process. It looks on the amplification of a targeted
DNA in the regular PCR process, and it collected the
result within the fluorescent signal instead of post
process such as Gel electrophoresis. There are two
type of methods for products detection in real-time
PCR process: (1) non-specific fluorescent dyes
directly intercalated with any double-stranded DNA
and (2) specific DNA probes connected with
oligonucleotides being labelled with fluorescent
reporter (Bustin et al., 2009). When the DNA of
sample included the specific fragment of disease,
qPCR could provide the quantitative fluorescence
information after each thermal cycle. Therefore, the
fluorescence intensity could present positive or
negative reaction to the tested target DNA. Therein,
in consideration of the inspection cost, except the
usage in clinical diagnosis, most of the experiment
would choose SYBR Green for the fluorescence
sample.
In addition, the previous study had proved that the
SYBR Green can also get the precise result as
TaqMan probes can made. The applicability was
demonstrated by measuring the copy number in three
different genetic contexts, which included the
quantification of gene rearrangement, the detection
and quantification in cell lines and cancer biopsies,
54
Chao, L., Chou, C., Tsai, H., Huang, K. and Shieh, D.
A Study on Enhanced Fluorescence Signal-to-noise by using the Stray Light Shutter for Quantitative PCR Chip.
DOI: 10.5220/0010362500540060
In Proceedings of the 9th International Conference on Photonics, Optics and Laser Technology (PHOTOPTICS 2021), pages 54-60
ISBN: 978-989-758-492-3
Copyright
c
2021 by SCITEPRESS – Science and Technology Publications, Lda. All rights reserved

and the detection of deletions in dominant optic
atrophy (Ponchel et al., 2003). The results showed
that the presented assay had important clinical
application and can providing accuracy diagnostic
results in short time. Four gerne expression profiles
(A1, A2A, A2B, A3) of adenosine receptors in breast
cancer tissue were analysed by optimized TaqMan
and SYBR Green quantitative RT PCR (Tajadini et
al., 2014). The result showed that the efficiency for
TaqMan and SYBR Green methods in all genes were
calculated mor than 95 %, and the correlations of
mean normalized data of each gene in two methods
were positive and significant. SYBR Green I-based
duplex qPCR was developed for simultaneous
detection of virus (Zheng et al., 2020). Therein, the
classical swine fever virus (CSFV) and porcine
circovirus 3 (PCV3) were simultaneously inspected
in one sample that amplified by their distinct melting
temperatures. The experimental results showed that
the qPCR with fluorescence dye of SYBE Green was
a reliable diagnostic tool to monitor the disease in
clinical field.
In the qPCR system, the accuracy of the result
strongly depends on the correctness, sensitivity and
resolution of the fluorescent signal. In the commercial
PCR System. The most common fluorescent detector
is modulated CMOS Camera or the photodiode. In
modulated CMOS camera, every pixel has 1 amplifier
with it. Therefore, the detecting signal of the tiny
fluorescence variation can be easier observed than
CCD type camera, and also the driving voltage can be
lower at the same time. Based on the advantages
above, CMOS component has been more and more
common use in the Fluorescence lifetime imaging
microscopy (FLIM) techniques. The researcher
(Chen et al., 2015) used the frequency-domain
fluorescence lifetime imaging microscopy (FD-FLIM)
composed with Olympus TIRFM microscope and
CMOS camera capturing the scattered laser and
analysed the intensity and modulation. The result
proved that the calibration in the CMOS camera
observation would be necessary in the imaging
process, which can minimize the effect of bleaching
or background interference. Anitoa’s ultra-low light
CMOS biosensor was used in a handheld, real-time
qPCR system (BioOptics World, 2015). The several
types of pathogen DNA and RNA, including hepatitis
B/C and E coli. The detection limit of four copies per
sample was achieved and over nine orders of
magnitude in dynamic range. The CMOS biosensor
had the enough sensitivity to replace the
photomultiplier tubes and cooled CCDs in
applications medical and scientific instruments.
However, the colour filter should be used on the
photodiode or CMOS camera when multi colour of
fluorescence signal needed to de detect in one sample
for various diseases. Hence, the optical component
which has the characteristics of spectrum separation
becomes an important component in future
application for detection of compound disease in
clinical inspection field. The spectrometer has the
characteristics of wavelength separation, and the
information of detected light intensity at each specific
wavelength can be recorded independently. In the
study, the spectrometer was employed to receive the
fluorescence intensity in qPCR device. In addition,
the package shape of the spectrometer and the effect
the stray light was analyzed, and the stray light shutter
was investigated to prevent the interference of
fluorescence by excitation light and enhance the
fluorescence signal-to-noise ratio. In the future, we
will consider the design and the results that
investigated in this manuscript, and we can get the
more precise results in different concentration of
DNA than previous device.
2 EXPERIMENTAL PRINCIPLE
AND SETUP
The total power of an incident light is equal to the
outer light, and the power can be divided into the
reflected, transmitted, scattered, and absorbed. There
is fluorescent particle in the liquid in the qPCR
sample, and fluorescence is emitted when the
substance or particle is excited and then absorbing the
light or electromagnetic radiation. Generally, the
fluorescence occurs when an electron of molecule
jumps to ground state by emitting the light from the
excited state, and the emission light ceases nearly
immediately when the excitation light stops.
Therefore, the distribution of emission light intensity
of fluorescence particles can be simulated by the
scattering model.
2.1 Scattering Model Principle
If the substance is a particle, the particle would absorb
the light energy and re-emit the light with different
intensity in different directions. Therein, the Rayleigh
scattering theory was employed when the dimension
of particle was smaller than the light wavelength, and
the Mie scattering theory was used when the particle
size was larger than the wavelength of light. However,
there is lots of calculation time in the light intensity
of each light beam. Total integrated scattering (TIS)
A Study on Enhanced Fluorescence Signal-to-noise by using the Stray Light Shutter for Quantitative PCR Chip
55

is defined as the ratio of the total power generated by
contributions of scattered radiation included the
forward and backward to the incident radiation,
shown as Fig. 1. In the generally TIS situation
(Harvey et al., 2012), the incident beam on the sample
was nearly normal, and the integration was carried
from the small values to almost 90 degrees. When the
light scattered from the specular reflection is small
and if the substance is surface material, the TIS will
be affected by the surface roughness. In addition, the
bidirectional scattering distribution function (BSDF)
was used to describe the scattered light (Pfisterer et
al.). The phenomenon of BSDF is usually split into
the reflected and transmitted light, which is separated
to the BRDF (bidirectional reflectance distribution
function) and BTDF (bidirectional transmittance
distribution function). In general, the vector I is the
incident light, vector R is the specular light, and the
vector S is the scattered light, shown as Fig. 2.
Therein, the specular light presented the mirror
reflected or scattering light. The projection light of
specular light and scattered light on the plane was
defined as β and β
0
, and the variation was x. When the
scattering phenomenon was caused by an isotropic
random rough surface, and the dimension of rough
structure was relatively smaller than the wavelength
of scattered light. The ABg scattering model can
usually described the required scattering probability
distribution well and was suitable to the polished
optical surfaces. Therefore, the ABg scattering model
was used to fit to the BSDF which is plotted as a
function of
|
|
(Won, 2014). The ABg scattering
model was widely used to evaluate scatter results
through ABg parameters, and written as Eqn. (1).
|
|
(1)
where A must be equal to 0 or larger than 0. B must
be larger than 1E-12, unless g is equal to 0. If g is
equal to 0, then B can be equal to 0. In addition, no
scattering will occur if A is equal to 0. In the
manuscript, the intensity distribution was analyzed by
ABg model, and the fitting curve was similar to the
Lambertian scattering type. The Lambertian
scattering model was usually used to present the
scattering intensity of uniform rough surface. The
probability of the scattered light on the projection
vector β is the same everywhere in the unit circle, and
the BSDF is 1/π.
Figure 1: The schematic of the total integrated scattering.
Figure 2: The schematic of the total integrated scattering.
2.2 Experimental Setup
The FRED optical engineering software was
employed to simulate the fluorescence distribution
that received by the spectrometer in qPCR chip.
Therein, the excitation light was the blue LED with
wavelength of 465 nm and half angle of ±9°, and the
spectrometer was used to receive the fluorescence. In
addition, the spectrometer can detect the light
intensity of 11 wavelengths because of the nano
interference filter deposited on standard CMOS
silicon sensor, which the detection wavelength was
350-1000 nm. The dimension of sensing area was 780
μm × 520 μm, and the diameter of the detection
aperture was 0.9 mm with height of 1 mm. The gap
between the surface of spectrometer and the qPCR
chip was 1 mm. Due to the bottom of the PCR chip
was sealed by the plastic thin film to prevent
outflowing of liquid reagent, which the reflection
ratio of plastic thin film and chamber of qPCR chip
was set at 30% and 80% in the simulation process,
respectively. The schematic of the experimental setup
was shown in Fig. 3. In addition, the reagent was
composed of water and some biological component,
so the setting parameter of refractive index was 1.336
in the simulation process. The setting parameter of
scattering ratio was 0.6, which means the 100% of
incident light and 60% of light will be scattered.
PHOTOPTICS 2021 - 9th International Conference on Photonics, Optics and Laser Technology
56
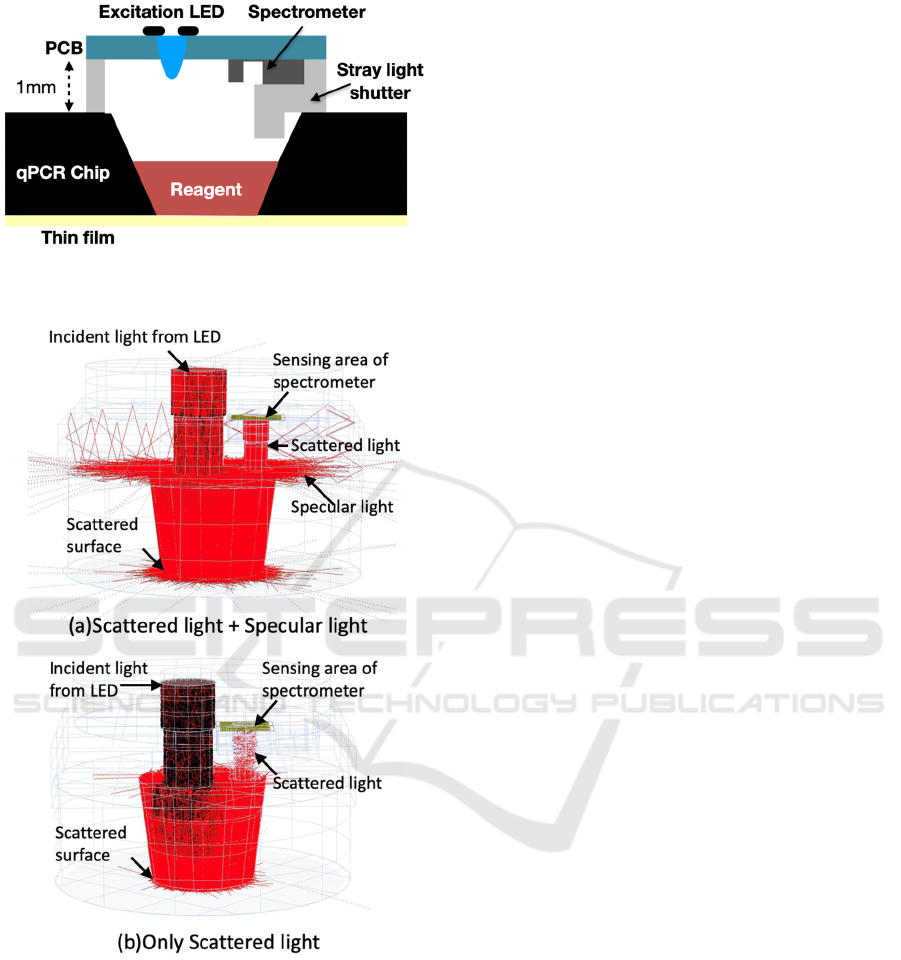
Figure 3: The schematic of simulation and experimental
setup.
Figure 4: The Ray trace of (a) specular light and scattered
light and (b) only scattered light.
3 EXPERIMENTAL RESULT
AND DISCUSSION
Initially, the stray light has an evidently effect in the
actual experiment, and the signal variation of the
fluorescence intensity that received by spectrometer
was small. Therefore, the analysis of the scattered
light in the experimental setup and the solution was
presented to obtain a high signal-to-noise ratio results
for the following actual qPCR experiments. Therein,
the specular light in the simulation software was
determined as the noise because it does not excite the
fluorescence substance and directly reflect, shown as
Fig. 4(a). In addition, the specular light was set as
absorption light, and the real signal received by the
spectrometer was the scattered light that generated by
the fluorescence light, which was defined as the
signal and shown as Fig. 4(b). Therefore, the choose
and the shape of the stray light shutter was designed,
and the light intensity of signal and noise was
analyzed in the following sections.
3.1 Effect of Stray Light
In order to investigate whether the stray light shutter
can enhance the SNR or not, the same gap between
the surface of spectrometer and chamber of qPCR
chip was fixed at 1mm. Initially, there was no stray
light shutter at the light path region, shown as Fig. 5
(a). In the analysis progress, the light distribution of
all rays included specular light (defined as noise) and
scattered light was shown in Fig.6 (a). The light
distribution at the corner can be removed when the
specular light was set as be absorbed, which the light
distribution can present that the only scattering light
from the fluorescence substance and shown as Fig.
6(b). The results showed that the specular light was
generated by the incident light on the chamber of
qPCR chip, so the protruding structure was designed
to occlude the specular light from the side wall of
qPCR chip’s chamber. Therein, the protruding
structure was defined as the stray light shutter (SLS)
and the protruding position was designed at the
semicircle away from the center (Fig. 5 (b)) and near
the center (Fig. 5(c)).
With the SLS, the irradiance of signal (scattering
light) and the noise (specular light) were analyzed
under different scattering ratios. The results showed
that signal was linear relationship to the scattering
ratio by using away from center SLS and without
using SLS, but most signal was occluded by using
near center SLS (Fig.7(a)). In addition, the noise
intensity can be evidently decreased by using the
away from center SLS (Fig.7(b)), and the SNR can be
enhanced about 4 -5 times compared to the SNR
without using SLS (Fig.7(c)). On the contrary, the
SNR of fluorescence by using near center SLS was
lower than that without using SLS. Therefore, the
SLS that with protruding structure away from center
was the important component to enhance the SNR of
fluorescence in qPCR process.
A Study on Enhanced Fluorescence Signal-to-noise by using the Stray Light Shutter for Quantitative PCR Chip
57
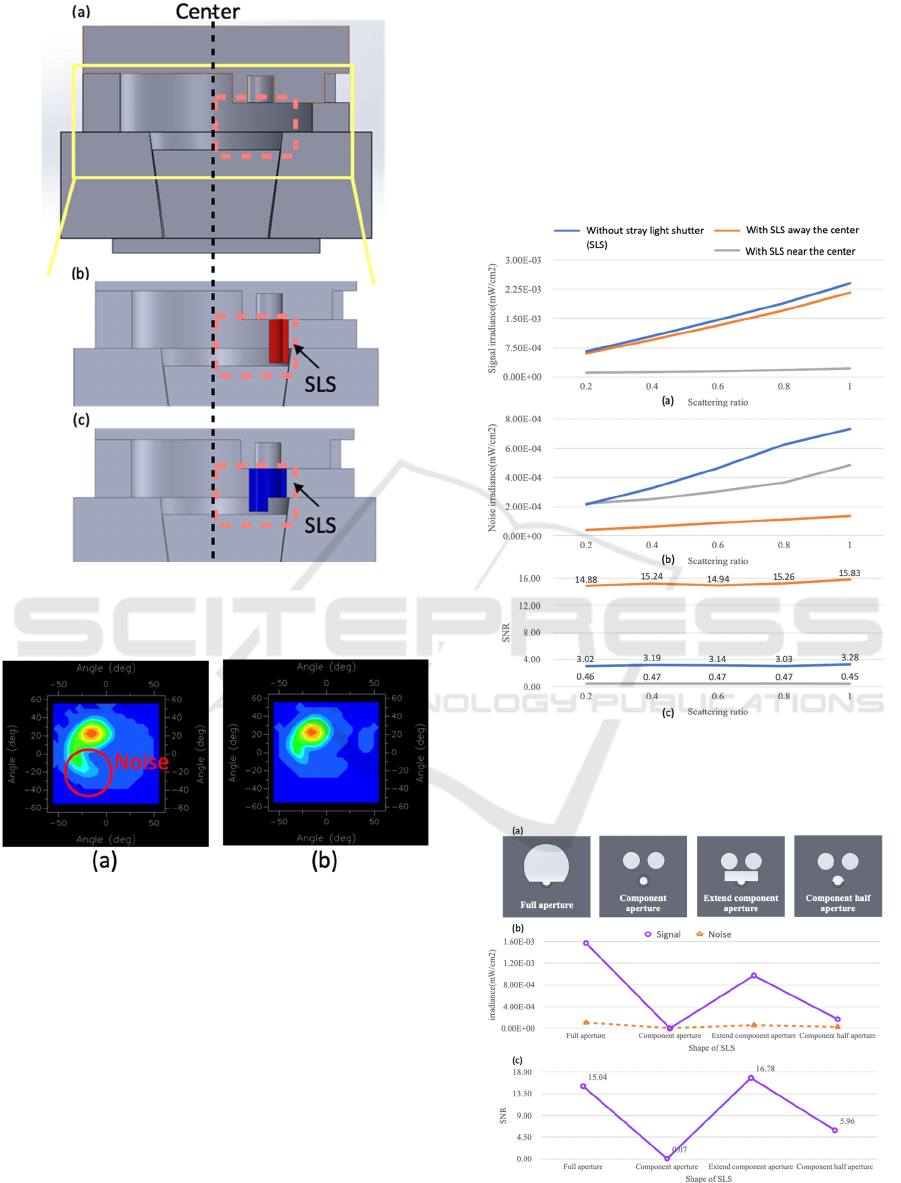
Figure 5: The simulation setup of (a) without stray light
shutter (SLS), (b) with SLS away from centre, and (c) with
SLS near the centre.
Figure 6: The light distribution of (a) all rays and (b) only
scattering rays received by sensor.
3.2 Shape Effect of Stray Light Shutter
The signal decreased obviously when the light was
isolated by the designed structure. Hence, four
different shapes of SLS were designed and employed
to analyze the signal, noise and SNR (Fig. 8(a)).
Therein, there was almost no signal when the shape
of SLS was the same to the aperture of spectrometer
and excitation light (Fig. 8(b)). The signal was
slightly higher with protruding structure of
component half aperture shape than component
aperture. There was the highest signal can be obtained
when the structure between the excitation light and
spectrometer was removed and designed only the
protruding structure away from the center. In addition,
there was 60 % of the highest signal by using the SLS
with shape of extend component aperture. In this
shape, the noise also decreased to the half value
compared to the full aperture. Therefore, the highest
SNR can be evaluated and obtained by using the SLS
with shape of the extend component aperture, which
the SNR was 16.78(Fig. 8(c)).
Figure 7: The (a) signal, (b) noise and (c) SNR of fluorescent
under different scattering ratios by without using SLS and
with using away from centre and near centre SLS.
Figure 8: The (a) the design shape of the stray light shutter
(SLS), (b) the irradiance of signal and noise and (c) the SNR
of fluorescence using different shape of SLSs.
PHOTOPTICS 2021 - 9th International Conference on Photonics, Optics and Laser Technology
58
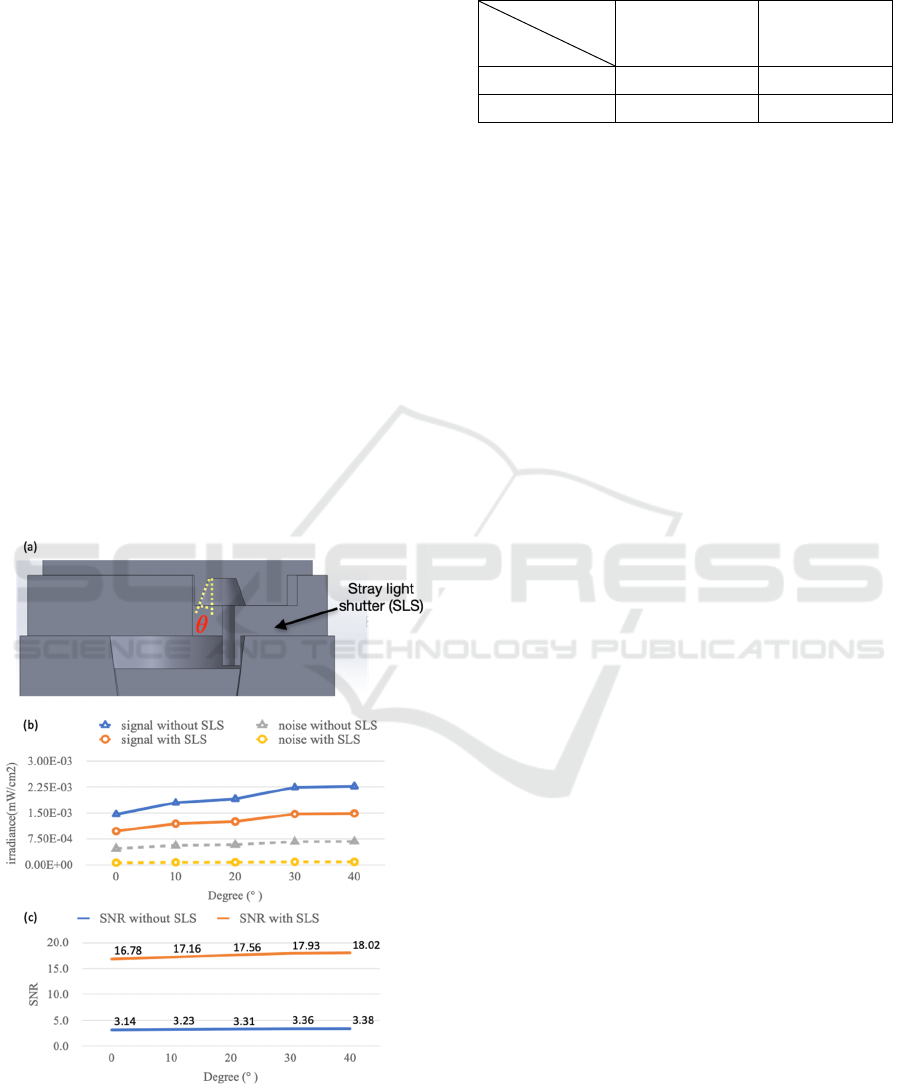
3.3 Effect of Detection Angle
From the above results, the suitable shape of SLS was
determined. However, several signal would be
blocked by the package of spectrometer because of
the vertical structure with height of 1 mm. Therefore,
the expand angle of the package of spectrometer was
simulated to detect more rays and obtain the better
package shape of spectrometer, shown as Fig. 9(a).
The irradiance of signal and noise that received by
spectrometer with SLS of extend component aperture
shape and without SLS were analyzed, and the results
showed than the higher signal can be obtained with
the increase of expand angle, shown as Fig. 9(b). The
signal was gradually saturated when the expand angle
was set at 30 and 40 degree. In addition, the SNR with
SLS was about 5-6 times compared to the SNR
without SLS, and the SNR with expand angle of 40
degrees can be enhanced 7.3% relative to without
expand angle (Fig. 9(c)). The comparison of the SNR
under different parameters were summarized in Table
1. Therefore, the spectrometer package can be
modified to expand the detection angle and the SLS
can be added in the actual experimental setup to
enhance the SNR of fluorescence.
Figure 9: The (a) chematic of expand angle of spectrometer
package, (b) the irradiance of signal and noise and (c) SNR
of fluorescence without and with SLS under different
expand angles.
Table 1: This comparison of the SNR under different
parameters.
Expand
angle(°)
SLS
0 40
Without SLS 3.14 3.38
With SLS 16.78 18.02
4 CONCLUSIONS
In the results of qPCR technology, the intensity of
fluorescence signal plays an important role because it
indicated the positive or negative reaction of tested
target disease. Hence, the optical simulation results
can provide the referential information for designing
the experimental setup to obtain the higher SNR
fluorescence signal in qPCR chip. From the
simulation results, the 5 times of SNR of fluorescence
can be enhanced by adding a stray light shutter (SLS)
with protruding structure away from centre. In
relative to the original package and without adding
SLS, the SNR of fluorescence can be enhanced from
3.14 to 18.02 by adding SLS and expanding the 40
degrees of spectrometer package. From the above
simulation results, the better fluorescence signal can
be obtained by referring simulation setup and set up
in the actual experiments in the future, which the
higher fluorescence SNR can present the better
performance of qPCR technology.
ACKNOWLEDGEMENTS
This work was supported in part by the Ministry of
Science and Technology, TAIWAN, under Grants
MOST 109–2221–E–492–010–.
REFERENCES
Espy, M. J., Uhl, J. R., Sloan, L. M., Buckwalter, S. P.,
Jones, M. F., Vetter, E. A., Yao, J. D. C., Wengenack,
N. L., Rosenblatt, J. E., Cockerill, F. R., Smith, T. F.,
2006. Real-time PCR in Clinical Microbiology:
Applications for routine Laboratory testing, Clinical
Microbiology Reviews, Vol. 19, 165-256.
Kralik, P., and Ricchi, M., 2017. A Basic Guide to Real
Time PCR in Microbial Diagnostics: Definitions,
Parameters, and Everything, Frontiers in Microbiology,
Vol. 8, 108.
Bustin, S. A., Benes, V., Garson, J. A., Hellemans, J.,
Huggett, J., Kubista, M., Mueller, M., Nolan, T., Pfaffl,
A Study on Enhanced Fluorescence Signal-to-noise by using the Stray Light Shutter for Quantitative PCR Chip
59

M. W., Shipley, G. L., Vandesompele, J., Wittwer, C.
T., 2009. The MIQE guidelines: minimum information
for publication of quantitative real-time PCR
experiments, Clinical Chemistry, Vol. 55, 611-22.
Ponchel, F., Toomes, C., Bransfield, K., Leong, F. T,
Douglas, S. H., Field, S. L, Bell, S. M., Combaret, V.,
Puisieux, A., Mighell, A. J., Robinson, P. A.,
Inglehearn, C. F., Issacs, J. D., Markham, A. F., 2003.
Real-time PCR based on SYBR-Green I fluorescence:
An alternative to the TaqMan assay for a relative
quantification of gene rearrangements, gene
amplifications and micro gene deletions, BMC
Biotechnology, Vol. 18, 1-13.
Tajadini, M., Panjehpour, M., Javanmard, S. H., 2014.
Comparison of SYBR Green and TaqMan method in
quantitative real-time polymerase chain reaction
analysis of four adenosine receptor subtypes, Advanced
Biomedical Research, Vol. 3, 85.
Zheng, H. H., Zhang, S. J., Cui, J. T., Zhang, J., Wang, L.,
Liu, F., Chen, H. Y., 2020. Simultaneous detection of
classical swine fever virus and porcine circovirus 3 by
SYBR green I-based duplex real-time fluorescence
quantitative, Molecular and Cellular Probes, Vol. 50,
101524.
Chen, H., Holst, G., Gratton, E., 2015. Modulated CMOS
camera for fluorescence lifetime microscopy,
Microscopy Research and Technology, Vol. 78, 1075-
81.
BioOptics World Editors, 2015. Low-light CMOS
biosensor enables detection of four copies of pathogen
DNA per sample, BioOptics World.
Harvey, J. E., Choi, N., Schroeder, S., Duparré, A., 2012.
Total integrated scatter from surfaces with arbitrary
roughness, correlation widths and incident angles,
Optical Engineering, Vol. 51, 013402.
Pfisterer, R., Scatter and BSDF Measurements: Theory and
Practice, Photonics Marketplace.
Won, Y. 2014. A Study of Scattering Characteristics for
Micro-scale Rough Surface.
PHOTOPTICS 2021 - 9th International Conference on Photonics, Optics and Laser Technology
60
