
An Optimization Model to Help Cruise Companies to Evaluate their
Offer in a Basin
Daniela Ambrosino and Veronica Asta
Department of Economics and business studies, University of Genova, Via Vivaldi 5, 16126, Genoa, Italy
Keywords:
Cruise Offer Decision Process, Evaluation of Cruise Offer, Optimization Model.
Abstract:
This work focuses on the problem of evaluating and improving a current offer, when the market changes due
to either new customers demands or new actions of competitors. A model for evaluating the current offer of
cruise itineraries is proposed. A case study related to the Mediterranean sea cruise offer is presented. Offers
have been compared in terms of demand satisfaction, revenue, costs, accessibility and appealing values that are
important information that can help the decision maker to choose the best offer in accordance with the trend
of the demand, the future business development and the future companys strategies. The current situation due
to COVID-19 pandemic represents an extreme case that poses new decision problems and requires different
analysis due to very high level of uncertainty. The present paper can furnish useful insights for facing some of
the emerging decision problems but it is dedicated to help decision makers in evaluating the cruise offer when
changes occur in a single market or in a limited area.
1 INTRODUCTION
The worldwide cruise ship tourism account for about
2 percent of the world tourism markets revenue, about
1.22 trillion (Statista, 2018). Over a ten-year period
(from 2007 to 2017), the world demand for cruising
has increased of about 69 percent passing from 15.9
million passengers to 26.8 million, as stressed in the
Cruise Lines International Association report (CLIA,
2018), and the capacity deployed by the cruise indus-
try has followed a similar growth, with 19 new ships
in 2020. In the last decades, cruise ship tourism has
represented the most dynamic segment of the tourism
involving many groups of stakeholders: from the de-
mand side customers and tourists, from the supply
side travel agencies, carriers and providers of tourist
services, and finally, tourist destinations and regula-
tory systems (Chen et al., 2016).
The health emergency due to COVID-19 has
changed these trends and forecasts for 2020 and 2021.
The health emergency forced cruise companies to
stop their ships and to re-organise their offer.
Since the production of the cruise industry output
has a great impact (also in terms of new jobs and in-
comes) on the global economy, it is really important
a rapid re-start of the cruise sector. Companies have
defined health and safety measures protocols for be-
ing able to offer their cruises on the market. New
operative procedures derived by international health
authorities have been adopted and must be contin-
uously modified in accordance with new authorities
guidelines. As a consequence it is required to re-
organize cruises, to analyse constantly new distribu-
tion of the cruise demand from the world markets and
to re-evaluate the cruise offer.
The definition of the cruise itineraries offer is a
long process involving three planning levels: a long,
a medium and a day by day plan.
Given the planning horizon, usually ten years, and
the global long term strategy defined by the company,
the main decisions of the long term plan consist in
the assignment of the available ships belonging to the
fleet to the different basins of the world in which the
company offers its services. Seasons, specialties of
the different geographical areas, dry docks related to
the ordinary and no-ordinary maintenance of the ships
may be considered at this level, together with past re-
sults in terms of operative margin and customer satis-
faction degree, competitive analysis and business de-
velopment.
The medium level (at basin level) focuses on each
basin and a planning horizon of generally less than
one year (i.e. a season). For each ship assigned to
the basin are defined the duration and the homeport
of its itineraries. These decisions are again guided by
the demand forecasting for the markets linked to the
Ambrosino, D. and Asta, V.
An Optimization Model to Help Cruise Companies to Evaluate their Offer in a Basin.
DOI: 10.5220/0010350203750383
In Proceedings of the 10th International Conference on Operations Research and Enterprise Systems (ICORES 2021), pages 375-383
ISBN: 978-989-758-485-5
Copyright
c
2021 by SCITEPRESS – Science and Technology Publications, Lda. All rights reserved
375

basin.
Finally, there is the day by day planning (at
itinerary level). At this level each itinerary of each
ship of a basin is detailed, starting from the duration
and the homeport determined at the previous level.
Each itinerary is characterized by a schedule, which
is the arrival time at each port and the departure time.
Note that the schedule has an impact on the activities
offered and sold to customers when the ship arrives at
ports, but also on the activities offered on board dur-
ing the dock at ports and during navigation.
Each itinerary is defined in such a way to grant
guest safety, to maximize the customer satisfaction
and the revenue, and minimize total costs.
At the end of this three level decision process the
cruise offer is defined. This decision process is rolling
and each year is updated to include a new year.
Generally, cruise companies have two main objec-
tives: to gain new clients among those that usually
do not choose a cruise and to offer attractive and de-
sirable itineraries for maintaining repeater clients. In
fact, the cruise customers are usually loyal/repeater
clients, and the company has to propose them new
and different destinations, new and unique experi-
ences. For doing that, new itineraries must be sug-
gested and the cruise offer must constantly updated.
On the other hand, for reaching new market segments,
the cruise industry has to offer different cruise prod-
ucts. In (Ward, 2005) a classification of ocean cruises
into ten different categories is presented, together
with a lifestyle classification that distinguishes stan-
dard, premium, luxury cruises (Barron and Green-
wood, 2006). A detailed analysis on cruise tourism
motivation, preference, intention and competitiveness
is reported in (Chen et al., 2016).
A constant market analysis is required in such a
way to immediately notice changes in the market de-
mand; a change in the customers demand can be due
to particular events in some countries, to actions real-
ized by competitors and so on. The company has to
verify if its current offer is able to face the new market
demand.
Summarizing for the cruise company is really im-
portant to plan optimal space-time itineraries in such
a way to maximize occupancy and expected revenue
(Sun et al., 2011). Even if few papers deal with the
optimal definition of an itinerary, the optimal plan
space time itineraries is not at all discussed in the
literature (at least for the authors knowledge). This
work is a first attempt of both describing the deci-
sion process followed by cruise industries to define
their cruise offer and defining a model to evaluate
and, in case, improve the current cruise itineraries of-
fer in a given basin (i.e. defining optimal space-time
itineraries). Note that, this decision problem can be
considered between the day by day planning and the
cruise by cruise one. In fact, itineraries are the inputs
data and the output is a set of itineraries to offer in a
basin in a planning horizon as for example a season
or 6 months.
The Covid-19 pandemic at the beginning of 2020
is a global event that has temporally and partially
changed the decision process described above and the
main objectives: companies have to attract clients and
reassure them on safety in taking a cruise, and their
main aim is to reduce the risks connected to the epi-
demic. Companies have to act at different levels: i) at
itinerary level to grant safety, to dock available ports
and to respect new rules emerging with the health
emergency (in fact, new decision problems related to
the definition of new reduced capacity of the ships,
to the reorganization of activities on board are emerg-
ing); ii) at basin level for adapting the itineraries of-
fer to the new demand; iii) at deployment level since
global distribution of passenger will not remain the
same in next few years.
The current situation due to COVID-19 pandemic
represents an extreme case that poses new decision
problems and requires different analysis due to very
high level of uncertainty. The present paper can fur-
nish useful insights for facing some of the emerging
decision problems but it is dedicated to help decision
makers in evaluating the cruise offer when changes
occur in a single market or in a limited area. The pan-
demic is having its effects on the world market. The
model here proposed, related to the cruise offer in a
given basin, should be extended to include more than
one basin for addressing some aspects and some new
emerging problems.
The paper is organized as follows. Section 2 is
devoted to the literature review, while Section 3 de-
scribes the problem under investigation and the pro-
posed mathematical model. Results are discussed in
Section 4 and conclusions outlined in the last section.
2 LITERATURE REVIEW
Even if studies about the cruise shipping are lim-
ited, recently some works are emerging in this field,
in particular in the economic literature. (Sun et al.,
2011) propose a concise review of the past research
on cruise industry. They also discuss the importance
of applying revenue management to cruise industry.
It is clear that good revenue management deci-
sions are strongly dependent on accurate forecasting.
Interesting forecasting methods are presented in (Sun
et al., 2010). (Petrick, 2005) segments cruise pas-
ICORES 2021 - 10th International Conference on Operations Research and Enterprise Systems
376

sengers on the bases of their price sensitivity. In the
cruise industry, each passenger should be priced and
managed separately (Biehn, 2006). The cruise com-
pany has to plan optimal space-time itineraries in such
a way to maximize occupancy and expected revenue
(Sun et al., 2011).
Only few papers deal with itinerary de-
sign/optimization, optimal market segmentation,
and demand infiltration (see for example, (Wang
and Qu, 2016), (Ambrosino et al., 2018), (Mancini
and Stecca, 2018)). The itinerary design, recently
included by (Cusano et al., 2017) in the class of
cruise supply, is a problem that received few atten-
tion, even if it has been recognized that it represents
an important task having an impact on consumers
satisfaction.
The importance of itinerary design is underlined
by (Lee and Ramdeen, 2013) which performed a lin-
ear regression analysis to investigate the interaction of
cruise ship itinerary on cruise ship occupancy rates.
The regression model explained a significant propor-
tion (23 %) of the variance in occupancy rates. (Chen
and Nijkamp, 2018) presents a guide for ports market-
ing policies and cruise companies decisional process
for ports selection and destinations. Tourists lengths
of stay at destination is investigated being an impor-
tant variable for estimating tourist consumption (Chen
et al., 2019). Moreover, port locations and port net-
works affect the overall spending at port destinations
and onboard services and experiences (Satta et al.,
2015). Finally, the occupancy rates are influenced by
the ports geography, the destinations and costs. (Sun
et al., 2011) suggest the integration of the itinerary
design and the revenue management, being a cruise
a combination of transportation and accommodation.
Integrating these two components, in fact, the cruise
line companies can not only enhance revenue but in-
crease customers satisfaction.
(Cusano et al., 2017) review works published in
the last two decades. Moreover, the authors analyze
the organization of cruise itineraries in the Mediter-
ranean Sea and highlight the dual role of excursions
used by cruise companies to differentiate services and
by the port cities to promote themselves. In (Ro-
drigue and Notteboom, 2013) is stressed the role of
the itineraries in the appeal of a cruise service. (Wang
and Qu, 2016) deal with a Cruise Service Planning
(CSP) Problem, which consists in determining cruise
transport services, i.e. the assignment of some prede-
fined sequences of ports to a set of ships, in order to
maximize total profit, while considering berth avail-
ability and the effect of decreasing marginal profit.
The main point of a cruise service design is the abil-
ity to offer to the customer a various set of itineraries
including different kind of destinations.
In (Ambrosino et al., 2018) a mathematical for-
mulation for determining a new itinerary maximiz-
ing revenue, customers satisfaction, while minimiz-
ing operative costs has been proposed. The customer
satisfaction is one of the main issue to consider. It
depends on different aspects, for example the accessi-
bility and the appealing of the destinations achievable
from the port. The (Wang et al., 2014) analysis shows
that the category tourism attractions is the most con-
siderable issue taken in consideration when a cruise
ship is selecting a port of call location. In their re-
sults the category connectivity and agility ranks sec-
ond. The aim of itinerary design is to determine when
to depart and return, what duration, which destina-
tions and what fare structure to adopt.
(Mancini and Stecca, 2018) face the tour planning
problem defining a fixed number of tours (a tour for
each available vessel) that must be repeated in a given
planning horizon in such a way to minimize fixed and
variable costs related to the ports and to fuel con-
sumption. The authors propose a model for solving
the tour planning problem that is a rich vehicle routing
problem and propose a Large Neighborhood Search
based matheuristic for solving it. The problem un-
der investigation is similar to the CSP introduced in
(Wang and Qu, 2016) and differs from that studied
in (Mancini and Stecca, 2018) for the fact that, each
vessel is not obliged to repeat the same tour during
the planning horizon and for the objective function
considered when defining the tours (itineraries) to of-
fer. In this paper, the offer is defined by selecting a
number of itineraries among a set of potential ones,
each one with a given set of characteristics as better
explained in the following section.
3 THE CRUISE ITINERARY
OFFER
As already introduced, this work aims at evaluating
a cruise offer and improving it by choosing what
itineraries offer in a given basin during a planning
horizon, for example a season. We suppose that all
itineraries have the same duration, thus the planning
horizon under investigation can be split into a certain
number of time periods each one having length equal
to the itinerary duration (i.e. 7 days = a week, that
is the most common, as reported in (CLIA, 2018)).
Given a basin with its ships and a set of markets with
a positive cruise demand for each period of the plan-
ning horizon, given a set of itineraries designed to sat-
isfy the cruise demand of the markets of the basin, the
problem consists in selecting the itineraries to offer in
An Optimization Model to Help Cruise Companies to Evaluate their Offer in a Basin
377

each period of the planning horizon in such a way to
maximize the revenue, the customers satisfaction, the
accessibility and minimize the operative costs, while
satisfying some requirements.
The itineraries among which to choose for defin-
ing the offer are characterized by a sequence of visited
ports, a cost, a revenue, an appealing and an accessi-
bility value. Moreover, each itinerary is able to satisfy
a given amount of the demand of the markets of the
basin.
When defining the cruise offer, the requirements
to take into consideration may be different for the
cruise companies but are generally related to:
• the demand to satisfy: the chosen itineraries must
satisfy the cruise demand of each market involved
in the basin under consideration and of each time
period;
• the maximum number of itineraries that can be of-
fered in the whole planning horizon, that is lim-
ited:
- by the number of ships deployed in the basin;
- for commercial and organizational reasons;
• the maximum number of itineraries that can be of-
fered in each time period of the planning horizon,
that is limited:
- by the number of ships deployed in the basin and
available in each time period;
• the repeatability of the itineraries in the whole
planning horizon, due to commercial and organi-
zational reasons; when an itinerary is chosen:
- it must be offered for a certain number of con-
secutively period of times;
- it can be offered again, but there is a limitation
to the number of times the same itinerary can be
re-offered;
• the maximum number of times a port can be
present in the itineraries offered in each time pe-
riod.
For what concerns the limitation for ports, it is de-
fined by the cruise company differently depending on
each port: the company assigns to each port an ap-
pealing class and thus, in accordance with the appeal-
ing class of the ports, defines the limitation.
Finally, the number of ships available in each time
period can be less than the number of ships assigned
to the basin due to, for example, planned dry docks.
3.1 The Optimization Model
The mixed integer 0/1 linear programming model for
solving Cruise Itinerary Offer Problem (CIOP), to-
gether with the useful notation, are here below intro-
duced. Let be:
• T the set of periods of time in which is divided the
planning horizon;
• M the set of markets;
• I the set of available itineraries that can be se-
lected for the offer;
• P the set of ports belonging to the different
itineraries of set I;
• Q the set of appealing classes of the ports of set P;
• d
mt
demand to satisfy in market m, in time period
t, ∀m ∈ M, ∀t ∈ T ;
• o
im
demand of market m, satisfied by itinerary
i, ∀m ∈ M, ∀i ∈ I ;
• r
i
revenue of itinerary i, ∀i ∈ I;
• c
i
costs of itinerary i, ∀i ∈ I;
• ap
i
appealing value of itinerary i,∀i ∈ I;
• ac
i
accessibility value of itinerary i, ∀i ∈ I;
• b
ip
= 1 if port p belongs to itinerary i, ∀p ∈ P, ∀i ∈
I;
• s
max
t
maximum number of itineraries that can be
offered in time period t, ∀t ∈ T ;
• i
max
maximum number of itineraries that can be
offered during the whole planning horizon;
• n
i
maximum number of time the itinerary i can be
offered during the planning horizon, ∀i ∈ I;
• µ maximum number of time an itinerary can be
re-planned in the cruise offer during the planning
horizon;
• r
pq
maximum number of time port p, having ap-
pealing belonging to the appealing class q, can be
offered in each time period, ∀p ∈ P, ∀q ∈ Q;
• g
qp
= 1 if appealing value of port p belongs to the
appealing class q, ∀p ∈ P, ∀q ∈ Q;
• α, β weights used in the objective function.
The decision variables are the following:
y
i
∈ {0, 1} ∀i ∈ I,y
i
= 1 if itinerary i is selected;
x
i,t
∈ {0, 1} ∀i ∈ I, ∀t ∈ T , x
i,t
= 1 if itinerary i is
selected for being offered in time period t;
j
i,t
∈ {0, 1} ∀i ∈ I, ∀t ∈ T , j
i,t
= 1 if itinerary i is
offered starting from time period t.
MIN
∑
t∈T
∑
i∈I
(r
i
−c
i
)x
it
+α
∑
t∈T
∑
i∈I
ac
i
x
it
+β
∑
t∈T
∑
i∈I
ap
i
x
it
(1)
subject to
∑
t∈T
x
it
≤ |T |y
i
∀i ∈ I (2)
ICORES 2021 - 10th International Conference on Operations Research and Enterprise Systems
378

∑
i∈I
o
im
x
it
≥ r
mt
∀m ∈ M, ∀t ∈ T (3)
∑
i∈I
y
i
≤ i
max
(4)
∑
i∈I
x
it
≤ s
max
t
∀t ∈ T (5)
x
it
− x
it−1
≤ j
it
∀i ∈ I, ∀t ∈ T − {t
1
} (6)
x
it
≤ j
it
∀i ∈ I, ∀t ∈ T : t = t
1
(7)
∑
t∈T
j
it
≤ µy
i
∀i ∈ I (8)
x
it
+x
it+1
+x
it+2
+x
it+3
≥ 4 j
it
∀i ∈ I, ∀t ∈ T : t < |T |−3
(9)
∑
i∈I
b
ip
x
it
≤ m
qp
+M(1 −g
qp
) ∀i ∈ I, ∀p ∈ P, ∀q ∈ Q
(10)
Equation (1) represents the objective function that
is the maximization of weight sum of operative mar-
gin, appealing and accessibility. Constraints (2) de-
fine variables y
i
, indicating if itinerary i is offered in
some periods of the planning horizon.
Equations (3) are the demand constraints: in each
time period t the demand of each market m must be
covered by the selected itineraries. Equation (4) lim-
its the number of itineraries to offer during the consid-
ered planning horizon, while the maximum number of
itineraries that can be offered in each time period t is
verified thanks to equations (5). Equations (6) and (7)
define the variable j
it
as the first time period in which
the itinerary i is offered. During the planning horizon
each selected itinerary can not be re-offered more than
µ times as imposed by (8), but it must be offered for
at least four consecutive periods, as required by (9).
Constraints (10) impose the number of time a port p
can be visited in each time period t; this limit depends
on the appealing class of port p.
4 A CASE STUDY
The proposed model has been used to analyse the
offer of a cruise company operating in the West
Mediterranean basin. The model has been solved
firstly for determining which itineraries to add to two
itineraries already offered in the basin (Partially Fixed
Offer - PFO), and secondly, for defining a Completely
New Offer (CNO). The offer must be defined for a
planning horizon of 12 periods (12 weeks). The max-
imum number of ships available during each week
is equal to four, except for weeks 5 and 6 in which
only three ships are available because of the dry dock
planned for the fourth ship. The maximum number
of itineraries to offer during the planning horizon is
fixed equal to 6.
The set I of itineraries used to define the cruise
offer has been obtained as the union of the set of
itineraries already offered by the company and a set of
new itineraries obtained by using the model proposed
in (Ambrosino et al., 2018) for the cruise itinerary de-
sign problem. The ports situated in the West Mediter-
ranean area are Savona, Ajaccio, Toulon, Marseille,
Barcelona, Mahon, Palma, Ibiza, Valencia, Valletta,
Palermo, Catania, Cagliari, Naples, Civitavecchia,
Livorno, La Spezia. All the itineraries are character-
ized by homeport Savona, duration 7 nights, one day
at sea, port stop of half day (i.e. the afternoon) in few
cases, while generally is the whole day (morning and
afternoon).
Figure 1: Example of two itineraries schedule.
Figure 1 sketches two itineraries of set I, showing
the sequence of ports visited and the stop duration at
ports.
The model has been implemented in Mathematical
Programming Language (MPL, 2020) and solved by
the commercial solver Gurobi 7.0.2.(Gurobi, 2020)
on a PC Intel Core i3, 2.00 G Hz; 4 G RAM. The
optimal solutions has been obtained within few sec-
onds. The solved models have 200 variables and 770
constraints.
Figure 2 shows the two offers (PFO and CNO)
defined when solving CIOP. Note that the two offers
are equals: the itineraries already offered by the com-
pany have been chosen also in the CNO. Two other
itineraries are then chosen for satisfying the demand
of the the three markets here considered for the basin
under investigation, i.e. the Italian, the French and
the Spanish ones. Tables below Figure 2 report the
percentages of the markets demand satisfied by each
itinerary offered in the PFO and CNO (weeks of the
time horizon are grouped depending on the itineraries
selected, i.e. T1-T4, T5-T6 and T7-T12).
Moreover, for the above-defined groups of weeks,
Figure 3 shows the comparison between the markets
offer and the demand to satisfy. This comparison
regards again the three markets under investigation.
Note that imposing a minimum of demand to satisfy
but no an upper bound, for each market the supply
of every complete offer overcomes the minimum de-
An Optimization Model to Help Cruise Companies to Evaluate their Offer in a Basin
379
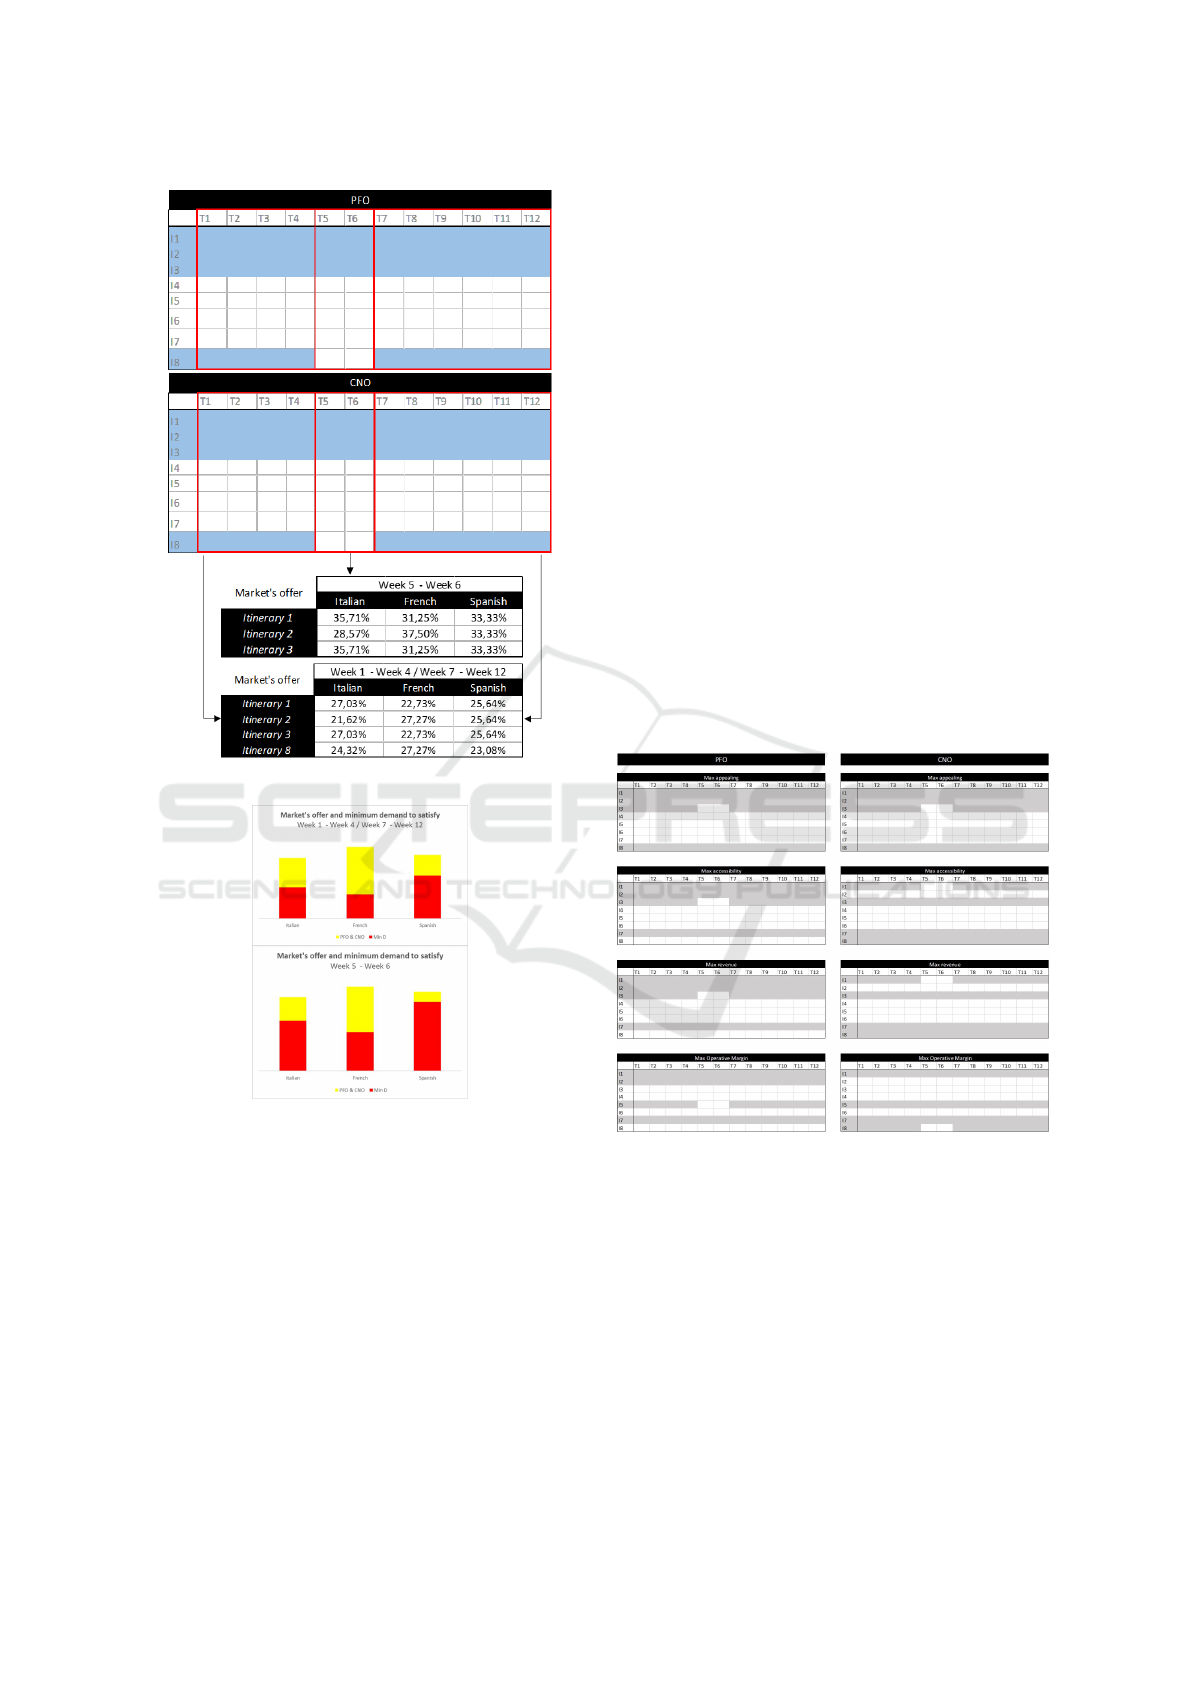
Figure 2: Market’s offer of PFO and CNO.
Figure 3: Market’s offer and demand to satisfy.
mand to satisfy.
All the selected itineraries contribute equally to
cover the markets demand. From Figure 3 we can
note that the oversupply is lower in weeks 5 and 6
than in the other periods because of the lack of one
of the four ship during this period. This kind of anal-
ysis is useful to enable the marketing department to
adopt some pricing tools in such a way to increase the
demand (for example for the French market). On the
other hand, if it should be necessary to move a ship
from a basin to another, this analysis could help to
take the more appropriate decisions by evaluating the
impact of the change on the markets.
4.1 Determining the Offers by using
Different Criteria
In this subsection, we present a comparison of the
cruise itineraries offers obtained by solving the CIOP
by modifying the objective functions used in model
(1)-(10), i.e. the criteria for the selection of the
itineraries. In particular, the four cases have been con-
sidered: a) maximization of the appealing; b) maxi-
mization of the accessibility; c) maximization of the
revenue; d) maximization of the operative margin.
Figure 4 shows the offer changes in accordance with
the objective function used (i.e. cases a)-d)), report-
ing both PFO and CNO. When using the maximiza-
tion of the appealing as the criteria for selecting the
itineraries to offer, the CNO is identical to the ob-
tained PFO. This means that the itineraries already
offered by the company perform very well in terms
of appealing. When considering the other objective
functions (i.e. b)-d)) the obtained offers are differ-
ent. The reader can also note that when comparing the
PFO obtained in the four cases, the offer determined
by maximizing the accessibility and the revenue are
equals (this fact is true also for the CNOs).
Figure 4: A comparison of PFO and CNO when varying the
objective function.
A deeply analysis related to the offers depicted
in Figure 4 is reported in the following graphs. The
CNOs permit to obtain better results in terms of ac-
cessibility, revenue and operative margin. When max-
imizing the accessibility, the CNO permits to obtain
higher accessibility, but also higher revenue and op-
erative margin, while there is a small reduction in the
appealing level, as shown in the graph of Figure 5 .
When maximizing the revenue, the CNO permits
to obtain again higher revenue, and also higher acces-
sibility and operative margin, while there is a small
ICORES 2021 - 10th International Conference on Operations Research and Enterprise Systems
380
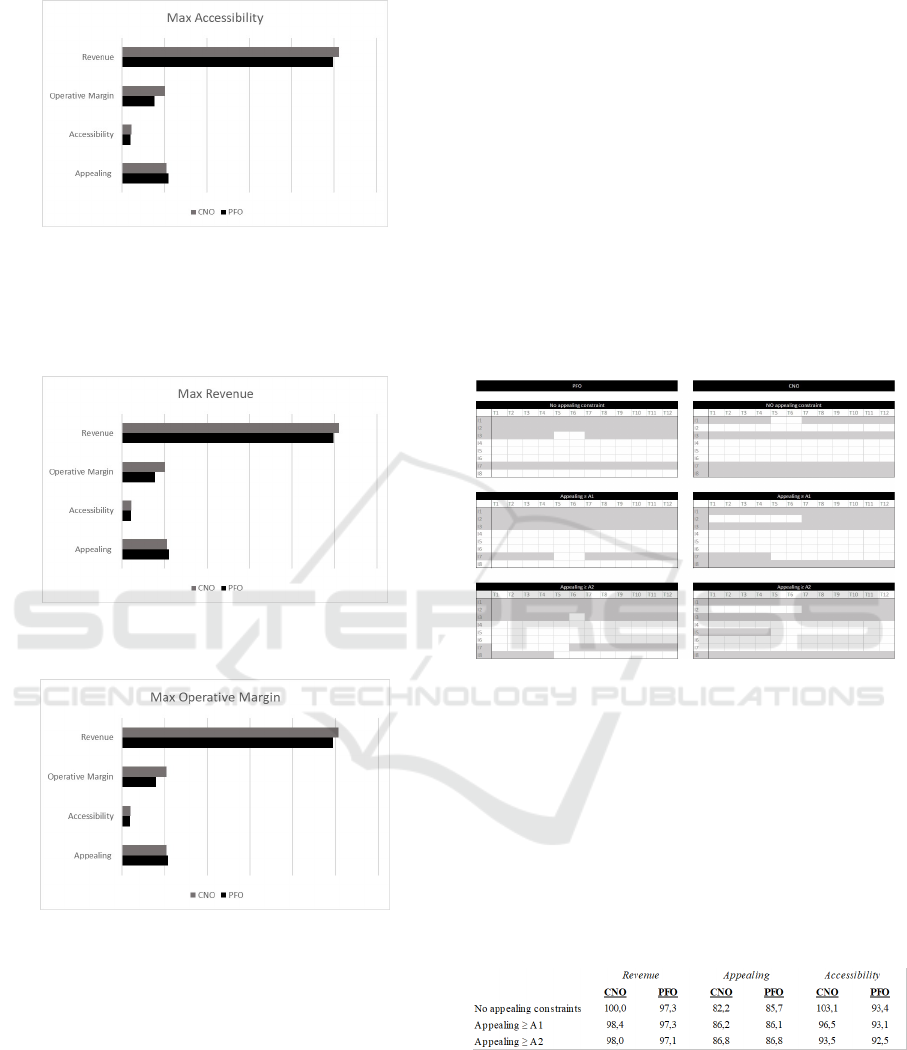
Figure 5: A graph comparing PFO and CNO when maxi-
mizing the accessibility.
reduction in the appealing level, as shown in the graph
of Figure 6. The same situation arises when maximiz-
ing the operative margin, as showed in Figure 7.
Figure 6: A graph comparing PFO and CNO when maxi-
mizing the revenue.
Figure 7: A graph comparing PFO and CNO when maxi-
mizing the operative margin.
4.2 Determining the Offers Maximizing
the Revenue While Granting
Certain Appealing Levels
The model has been used for defining the optimal of-
fer in terms of revenue maximization, controlling the
appealing level by a constraint.
If the company wants to maximize the revenue
while granting offers characterized by a certain level
of appealing, the proposed modal can be easily modi-
fied and solved.
In the following we report the results obtained in
three cases: no constraints for the appealing level,
and imposing two different levels (i.e. named A1, A2
and in ascending order). The comparison among the
planned itineraries is reported in Figure 8 . Asking for
higher values of appealing, the obtained solutions are
characterized by a higher variability in the itinerary
offered: the number of itineraries offered during the
planning horizon increases from four to five. This
is an important aspect characterizing the offer. The
itinerary management department is not indifferent to
the number of itineraries to manage. Moreover, also
to move a ship from an itinerary to another one is not
a preferred solution (i.e. this happen in PFO with ap-
pealing constraint ≥ A2 in correspondence of week 5
and 6).
Figure 8: PFO and CNO Itineraries planned maximizing
revenue while imposing different levels of appealing.
Comparing the appealing, accessibility and rev-
enue values of the solutions reported in Figure 8, we
noted that when the level of appealing is forced to in-
crease, the other values decrease or remain almost sta-
ble for both PFO and CNO (see Figure 9). Moreover,
The effect on the accessibility and revenue values is
greater in case of partially fixed offer; this fact could
evidence the necessity of modifying the current offer
of the company for obtaining better results in terms of
accessibility and revenue.
Figure 9: PFO and CNO solutions maximizing the revenue
while imposing different levels of appealing.
4.3 The Analysis on the Markets Offer
and the Demand to Satisfy
Let us conclude with an analysis on the solutions in
such a way to furnish important information to the
An Optimization Model to Help Cruise Companies to Evaluate their Offer in a Basin
381

cruise company. We compare the markets offer (de-
termined for PFO and CNO ) with the demand to sat-
isfy, when the company aim is maximizing the rev-
enue.
Figure 10: Markets offer and demand to satisfy.
This comparison realized for three types of offers
(without the constraint for imposing a given appeal-
ing level, and imposing two different appealing lev-
els A1 and A2 as explained before) has been done
for each period of the time horizon characterized by
the same set of itineraries to sell. Figure 10 shows
the obtained results (PFO and CNO) for three periods
(T1-T4, T5-T6 and T7-T12). The graphs show the
comparison between the offer and the demand for the
Italian, the French and the Spanish markets. Having a
minimum demand to satisfy without an upper bound,
for each market the supply overcomes the demand.
The only indirect limitation of the markets offer is the
maximum number of itineraries that can be offered
for each period of time (i.e. each week). Note that the
three offers are equals in weeks 5 and 6 in which the
number of ships is limited for the dry docks. In weeks
7-12 the change in the market offer is derived when
imposing an appealing level of A1, while in weeks
1-4 the change is evident when imposing the higher
level of appealing. This different impact of the ap-
pealing level on the markets offer seems due to the ra-
tio between the demand to satisfy and the global offer
capacity. These graphs permit the company to choose
the best offer taking into account also the trend of the
markets demand.
The information related to the differences between
the demand and the offer for each market can be used
in order to adopt new marketing activities and pric-
ing policies in such a way to increase the revenue and
also to face market variations due to both competitors
activities and customers behavior changes.
5 CONCLUSIONS
The mathematical formulation proposed in this paper
permits to evaluate the current cruise offer in such a
way to modify it, if necessary. It furnishes applicable
solutions and represents a support during the cruise
itinerary planning decision process. This approach to
find and analyze different solutions can be used for
deciding how to reply to market changes and also to
some operative problems related to ships or ports tem-
porally unavailable.
In this first attempt to face the cruise offer prob-
lem, some simplifying assumptions have been used.
For example, the duration of the itineraries used for
defining the cruise offer is considered constant and
equal to seven days. In practice, it is possible to have
itineraries characterized by different duration. The
proposed model can be extended to admit itineraries
of different length. Moreover it should be also modi-
fied for defining the offer in more than one basin.
REFERENCES
Ambrosino, D., Asta, V., and Bartoli, F. (2018). An op-
timization model to design a new cruise itinerary: the
case of costa crociere. Proceedings of 15th IFAC Sym-
posium on Control in Transportation Systems, June
2018, Savona, Ital.
Barron, P. and Greenwood, A. B. (2006). Issues determin-
ing the development of cruise itineraries: A focus on
the luxury market. Tourism in Marine Environments,
3(2):89–99.
Biehn, N. (2006). A cruise ship is not a floating hotel. Jour-
nal of Revenue & Pricing Management, 5:135142.
Chen, J. M., Neuts, B., Nijkamp, P., and Liu, J. (2016).
Demand determinants of cruise tourists in competi-
tive markets: Motivation, preference and intention.
Tourism Economics, 22(2):227–253.
Chen, J. M. and Nijkamp, P. (2018). Itinerary planning:
Modelling cruise lines lengths of stay in ports. Inter-
national Journal of Hospitality Management, 73:55–
63.
Chen, J. M., Petrick, J. F., and Papathanassis, A., . L. X.
(2019). A meta-analysis of the direct economic im-
pacts of cruise tourism on port communities. Tourism
Management Perspectives, 31:209–218.
CLIA (2018). Cruise lines international association,
https://cruising.org/en-gb/.
Cusano, M. I., Ferrari, C., and Tei, A. (2017). Port hierarchy
and concentration: Insights from the mediterranean
cruise market. International Journal of Tourism Re-
search, 19(2):235–245.
Gurobi (2020). Gurobi optimization,
https://www.gurobi.com/.
Lee, S. and Ramdeen, C. (2013). Cruise ship itineraries and
occupancy rates. Tourism Management, 34:236–237.
ICORES 2021 - 10th International Conference on Operations Research and Enterprise Systems
382

Mancini, S. and Stecca, G. (2018). A large neighbor-
hood search based matheuristic for the tourist cruises
itinerary planning. Computers & Industrial Engineer-
ing, 122:140–148.
MPL (2020). Mathematical programming language,
http://www.maximalsoftware.com/mpl/.
Petrick, J. (2005). Segmenting cruise passengers with price
sensitivity. Tourism Management, 26:753–762.
Rodrigue, J. and Notteboom, T. (2013). The geography of
cruises: Itineraries, not destinations. Applied Geogra-
phy, 38:31–42.
Satta, G., Parola, F., Penco, L., and Persico, L. (2015). Word
of mouth and satisfaction in cruise port estinations?
Tour. Geogr., 17(1):54–75.
Statista (2018). www.statista.com.
Sun, X., Gauri, D., and Webster, S. (2010). Forecasting for
cruise line revenue management. Journal of Revenue
& Pricing Management.
Sun, X., Jiao, Y., and Tian, P. (2011). Marketing research
and revenue optimization for the cruise industry: A
concise review. International Journal of Hospitality
Management, 30:746–755.
Wang, K.and Wang, S. Z. L. and Qu, X. (2016). Cruise
service planning considering berth availability and de-
creasing marginal profit. Transportation Research
Part B, 95:1–18.
Wang, Y., Jung, K., Yeo, G., and Chou, C. (2014). Select-
ing a cruise port of call location using the fuzzy-ahp
method: A case study in east asia. Tourism Manage-
ment, 42:262–270.
Ward, S. (2005). Ocean cruising and cruise ships 2005. 15th
edn, Berlitz Publishing.
An Optimization Model to Help Cruise Companies to Evaluate their Offer in a Basin
383
