
Reproducibility, Transparency and Evaluation of Machine Learning
in Health Applications
Janusz Wojtusiak
Health Informatics Program, Department of Health and Policy, George Mason University, U.S.A.
Keywords: Machine Learning, Health Informatics, Clinical Decision Support, Reproducibility, Transparency.
Abstract: This paper argues for the importance of detailed reporting of results of machine learning modeling applied in
medical, healthcare and health applications. It describes ten criteria under which results of modeling should
be reported. The ten proposed criteria are experimental design, statistical model evaluation, model calibration,
top predictors, global sensitivity analysis, decision curve analysis, global model explanation, local prediction
explanation, programming interface and source code. The criteria are discussed and illustrated in the context
of existing models. The goal of the reporting is to ensure that results are reproducible, and models gain trust
of end users. A brief checklist is provided to help facilitate model evaluation.
1 INTRODUCTION
Application of Machine Learning (ML) and more
broadly Artificial intelligence (AI) methods require
careful reporting of results. The current gold standard
for reporting results in the field is statistical model
evaluation reported as area under receiver-operator
curve, accuracy, precision, recall, F1-score and their
variants. While these metrics are useful in assessing
one aspect of model performance, they are
insufficient for assessing model applicability,
reproducibility of results and deployment of models.
Even machine learning models that have very high
testing scores, tend to make obvious mistakes that can
be immediately spotted by human experts. Thus,
researchers and data scientists need to better
understand their models’ behavior and limitations.
The presented work discusses ten criteria that in the
authors’ view should be used to report results of
machine learning modeling. They include specific
technical aspects of models, but models need to make
sense to domain experts and data scientists alike.
Recent significant interest in machine learning
and artificial intelligence methods, also outside
scientific community, have led to renewed focus on
trust in these approaches. Consequently, people
started questioning quality of many works,
reproducibility of results and criteria that are needed
for model evaluation. Such detailed reporting is
needed for review of methods, reproducibility and
meaningful application of the results. It is a wide
belief among non-machine learning experts that the
created models “do not generalize” and thus are
essentially useless. While the truth cannot be farther
from this statement, authors of many published works
fail to sufficiently report properties of their models.
The lack of generalizability refers to the fact that
models trained on one data, do not perform well on
different data, i.e., data from another institution, but
it also means that models built on historical data do
not work in practice.
More generally, transparency of science and
reproducibility of results are among the most
important aspects of scientific discovery. In order for
the results to be widely accepted by scientific
community and consequently applied, there needs to
be trust in how they were obtained. The results may
be reproduced by other groups on the same or
different data, or simply accepted when sufficient
evidence is provided in relation to quality of the work.
One can argue that there are many reasons for the
lack of details and sufficient reporting in published
works. Scientists are under constant pressure to
produce and publish results and faster. Many journals
and almost all conferences have space limits for
submitted manuscripts, and only some allow for
submission of supplemental material. Many scientists
report results in a standard way as most others do and
do not even consider the need for more detailed
studies. Finally, there is a strong bias for presenting
only positive results, thus some scientist may decide
not to present selected results that may negatively
affect review process of their work.
Wojtusiak, J.
Reproducibility, Transparency and Evaluation of Machine Learning in Health Applications.
DOI: 10.5220/0010348306850692
In Proceedings of the 14th International Joint Conference on Biomedical Engineering Systems and Technologies (BIOSTEC 2021) - Volume 5: HEALTHINF, pages 685-692
ISBN: 978-989-758-490-9
Copyright
c
2021 by SCITEPRESS – Science and Technology Publications, Lda. All rights reserved
685

1.1 Recent Interest
Within the past few years many works have been
published on the topic of transparency of machine
learning methods, reproducibility of results, and
overall reliance on these methods. Medical,
healthcare and health application areas of ML are of
special interest with results of modeling directly
affecting patients’ lives (Liu et al., 2019).
The need for detailed reporting of methods and
results is critical in science, yet has often be ignored
in ML, AI, and more broadly data science
(Gundersen, 2020) and only gained attention recently.
The problem is also being recognized in medical
applications (i.e., Beam et al., 2020).
To address this issue several sets of criteria have
been proposed. Luo et al. (2016), developed a set of
guidelines for reporting machine learning results in
biomedical research. They developed 12 reporting
criteria to be directly utilized in preparing
manuscripts, but do not discuss what specific metrics
should be used. Similarly, Stevens et al. (2020)
discuss reporting criteria split into main categories:
study design, data sources and processing, and model
development and validation. Vollmer et al., discuss a
framework consisting of 20 criteria (questions)
intended to guide ML and statistical research, split
into six categories: inception, study, statistical
methods, reproducibility, impact evaluation and
implementation. The authors argue for the need for
interdisciplinary teams to address these questions.
Reproducibility and quality of work has also been
addressed in the context of clinical trials (Wicks et al.,
2020). The criteria are described in Liu et al., (2020)
who provided guidelines for reporting results of
clinical trials that involve AI as an extension to the
standard CONSORT reporting (Moher et al., 2010).
Many authors describe criteria of reproducibility
in the context of other work or specific types of data.
For example, Wojtusiak and Baranova (2011) argue
that accuracy, transparency, acceptability, efficiency
and exportability are main criteria for machine
learning to be deployed in health applications. Kim et
al. (2020) describe reproducibility in the context of
genomic data. Ronald et al. (2020) as well as Yu et al.
(2020) focus on image data and reproducibility of ML
methods. Several more examples of such works are
available in the literature.
1.2 Focus of This Work
While several sets of criteria for reproducibility and
reporting of results exist, often much broader than the
work presented here, it is opinion of the author that
they are hard to follow in practice as they are too
general. The focus of this work is to list specific
metrics along with examples that are essential to
include in the reported results. The presented ten
machine learning reporting items, denoted MLI-1 to
MLI-10, include information about: experimental
design, statistical model evaluation, model
calibration, top predictors, sensitivity analysis,
decision analysis, global model explanation, local
prediction explanation, programming interface, and
source code. The criteria are intended to help guide
data scientists provide sufficient level of information
on the modeling process. The ten criteria are not
intended to be the only way reporting should be done.
Instead, they consist of a minimal set of criteria that
need to be addressed. While focus of this work is on
structured data (EHR, claims, etc.), the criteria are
also applicable to unstructured data.
Further, the presented work is not novel in terms
of the specific criteria used. All these criteria are
known and long used by machine learning
community, but often ignored. This work is intended
to contribute to discussion about reproducibility and
transparency of models and provide the authors’ view
on the topic.
2 REPORTING CRITERIA
2.1 Experimental Design
Complete understanding of how models were
constructed require detailed explanation of
experimental design in a broad sense including cohort
selection, data preprocessing, final data description,
hyperparameter tuning, and testing procedures. Most
importantly, one needs to carefully describe what is
being modeled (i.e., predicted), including the
relationship between the real world and its data
representation. The later is investigated by Cabitza et
al. (2020) in the context of relationship between the
ground truth and labeling of data as one measure to
assess the quality of data used for modeling.
Inclusion: Detailed information about inclusion
criteria to the study need to be presented. Johnson et
al. (2017) demonstrated that information included in
published ICU mortality prediction studies based on
MIMIC III data are insufficient to even reproduce
exact cohort. In most cases, the reproduced cohort is
much larger than one implied by publication, in many
cases because some exclusions applied while
preprocessing data are forgotten or buried in the
description.
There are different ways to report on how the
cohort was selected. The author’s preference is a
HEALTHINF 2021 - 14th International Conference on Health Informatics
686

flowchart that shows all exclusion steps along with
counts of included and excluded cases.
Cohort: The most commonly present way of
describing data is what is often referred to in
biomedical literature as “Table 1” that shows
characteristics of the data, typically as simple
descriptive statistics. The data are typically split
between different groups that correspond to
experimental work. Often, the data may be split based
on the predicted classes (values of output attributes).
While informative description of the population, such
table is not intended to provide detailed description of
the data. Such description should include as detailed
as possible description of how data were transformed
from the original form to the final analytic file fed into
ML algorithms.
Attributes & preprocessing: More specifically,
details of construction of derived attributes should be
described, including details of coding used. Such
descriptions are typically very complex and may
require presentation of source code (see MLI-10).
Experimental setup: Experimental setup description
includes a detailed description about how learning
and testing of the models was set up. For example,
was data split into training, validation and testing sets
and how was the split done, was cross-validation used
to tune hyperparameters and select algorithms, and
what specific methods and libraries were used at each
step of model construction.
In summary, MLI-1 is a broad category with
multiple items to be reported. Essentially, it is about
describing every step that was performed so that the
final models are constructed.
2.2 Statistical Model Evaluation
Statistical classification model evaluation results are
a gold standard of reporting results of ML modeling.
They typically include reporting of metrics such as
Area Under Receiver-Operator Curve (AUC),
Accuracy, Precision, Recall, and their derivatives.
For regression learning problems, reported values
typically include Mean Square Error (MSE), Mean
Absolute Error (MAE), and correlation coefficient.
Such metrics should be calculated on both training
and testing datasets, including results from cross-
validation, if performed.
The model accuracy is defined as the total number
of correctly classified exampled divided by the total
number of examples in the test set. In many cases,
accuracy is the most important metric reported. It is a
direct count how many times a model is correct or
incorrect. In other cases, when data are imbalanced or
one class is important than others, measures
additional measures are used. Model recall (known as
sensitivity in biomedical literature) is defined as the
number of correctly classified positive examples
divided by the total number of positive examples in
the test set. Similarly, model precision is defined as
the proportion of true positives to the total number of
examples classified as positive.
There is an obvious tradeoff between recall and
precision. Precision ad recall are often combined to
create one metric, such as F1-score and their
continuous relationship is related to the concept of
receiver-operator curve (ROC) and Area under
Receiver-Operator Curve (AUC or AROC),
sometimes referred to as C-statistic, represents
integration of all possible true and false positive rates
for a given model. In many application domains AUC
is considered as impractical as it shows overall
relationship between true positives and false
positives, but not precision and recall at the final
threshold. It is most often used to compare models.
There are many other statistical measures of
model quality. For example, the pattern quality
measure, q(w), (Michalski and Kaufman, 2001b)
allows weighting model recall and precision. Other
measures that rely on counting positive and negative
examples exist and are frequently used in the
literature: sensitivity, specificity, positive predictive
value, negative predictive value, and others. In
addition to the statistical model quality measures,
characteristics of learning algorithms should be
presented, including learning curves, attribute
selection curves, and hyperparameter tuning curves
accompanied by relevant statistical measures.
2.3 Model Calibration
There is a common misunderstanding that machine
learning methods return a probability of the target
event, or probabilities of classes in a multiclass
prediction problem. In fact, most models return a
score that is typically in 0 – 1 range and resembles
probability. Yet, probabilities have a well-defined
frequency interpretation, i.e., exactly 20% of
examples that receive score of 0.2 should really
belong to the predicted class. Model calibration is a
process that aims at changing the output scores, so
they are closer to the actual probabilities. Calibration
can be assessed numerically by metrics such as the
Brier Score, that is defined as the mean squared error
between the provided values and actual probabilities
(score zero means perfect calibration). Calibration is
often visually presented using calibration plots
(reliability curves). An example calibration curve
along with Python code is available at Scikit-learn
Reproducibility, Transparency and Evaluation of Machine Learning in Health Applications
687
website (2020). Below the actual calibration curves,
there is typically a histogram of distribution of output
values from the model.
Calibration curves as well as ROC are closely
related to the probabilistic interpretation of models
further discussed in later sections.
2.4 Top Predictors
Domain experts often want to see a list of “top
predictors” or attributes with highest scores according
to some metrics. This is in part related to their need to
understand models, and in part due to training in
standard statistics that clinicians often receive. The
attribute quality metrics can be specifically related to
models, such as coefficients in logistic regression
models or average GINI scores in random forests, or
based on criteria used in attribute selection methods
such as information gain, likelihood ratio or
Pearson’s correlation coefficient.
While listing of top predictors is often done and
should be done to provide some information to
domain experts, it is not necessarily a correct way of
presenting models and may be misleading. This is
particularly the case for nonlinear models for which
strength of each attribute/predictor needs to be
assessed locally in the neighborhood of a specific
example for which a prediction is made. This is
further discussed in sections 2.5 and 2.8.
Regardless of this limitation, an abbreviated list of
the top predictors can be included in the description
of created models, typically as a table. If space
permits, an appendix with a complete or longer list of
all predictors can be presented.
2.5 Global Sensitivity Analysis
Global sensitivity analysis is intended to test if
models are behaving in a certain way they are
expected to. It is used to measure how uncertainty in
the output of the model can be derived from
uncertainty in the model inputs. The other way of
thinking about the sensitivity analysis is to measure
how much inputs to the model would need to change
for the output to significantly change so that results
are affected. In practice, this means to ensure a
relatively smooth behavior of the model and
minimize output fluctuation, i.e., small changes to
inputs cause small changes to outputs, as well as the
models are “smooth” (the output values do not jump
back and forth when inputs are changed). This is
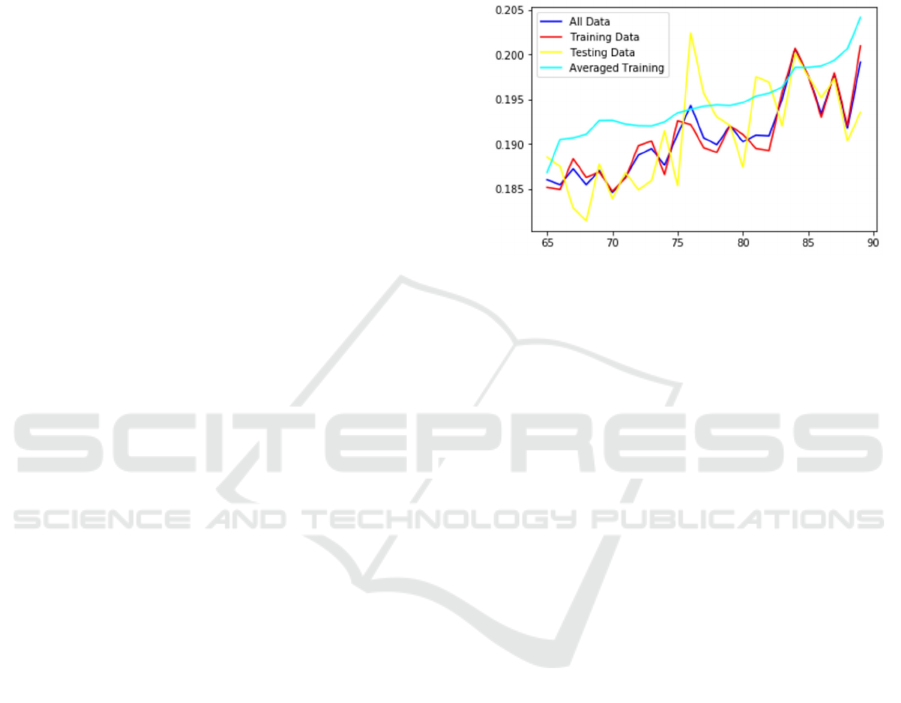
exemplified in Figure 1 that shows predicted
probability of mortality calculated by C-LACE2
model (Wojtusiak et al., 2017) based on patient age.
The three lines with “spikes” in the data represent
average predicted probabilities for patients in the data
with a given age. As one can see, the model appears
unstable. However, when patients are taken from a 5-
year age window the model is smooth. This is because
the variation is caused by small number of patients at
every given age.
Figure 1: Sensitivity of C-LACE2 model presented as
predicted probability in relation to patient age.
2.6 Decision Curve Analysis
Fine-tuning of models for application on entire
population level data typically involves cost-benefit
analysis of correctly and incorrectly classified
objects. Whenever a model is employed to make a
prediction there is a potential cost and benefits
associated with correct and incorrect classification.
Here, the words cost and benefits are loosely defined
and may carry various meaning in the context of
specific applications. In the AI community these are
often referred to as a utility function, although more
often in the context of reinforcement learning.
Benefits and costs are positive and negative
consequences of predictions. Let us assume that these
are denoted C
TP
– the cost of true positives, C
FP
– the
cost of false positive, C
TN
, - the cost of true negative,
and C
FN
, - the cost of false negative. Typically, C
FN
>
C
TP
> C
FP
> C
TN
, but most importantly C
FN
>> C
FP
.
To exemplify this idea, let’s consider a model that
is used to early detect a medical condition. Patients
who are identified by the model as likely to have the
condition receive additional screening (i.e., genetic
test). There are potential costs associates with all
possible outcomes of the prediction: patients who are
correctly predicted to have the condition (TP) are
subject to cost of additional testing and then cost of
treatment for early detected condition, C
TP
. Patients
with the condition who are not tot correctly detected
by the model (FN) incur potentially large costs
associated with treatment of the condition at a late
stage, C
FN
. The patients who are correctly identified
HEALTHINF 2021 - 14th International Conference on Health Informatics
688

as not having the condition (TN), do not undergo
additional testing and are healthy thus do not require
any treatment or testing. Their total associated cost
can be considered as zero. Finally, there are patients
who do not have the condition, but are identified by
the model as positive (FP) and receive additional
screening with cost C
FP
. If cost of testing and early
treatment is much smaller than cost of late treatment,
it may be reasonable to early test everyone. However,
if the frequency of positive cases is very low, vast
majority of tests will be done unnecessarily.
In the example below, a model was created to
predict which elderly patients receiving a traditional
form of care may benefit from a new approach. The
model predicted probability of cost savings in the new
setting vs. traditional approach. The new setting is
cheaper for some patients, but not for all. The model
was applied to about 13,000 patients receiving
traditional care and identified patients who may be
moved to the new setting. The plots in Figure 2 were
constructed to visually demonstrate the potential
savings. The plot shows entire population of 13,000
patients and indicates that the benefit of moving to the
non-traditional program peaks at about 9,000 patients
after which the model predicts the traditional program
to be more beneficial.
Figure 2: Decision/utility curve that illustrate potential
savings based on numbers of people moved to a new
treatment approach.
2.7 Global Model Explanation
In order to gain trust in the models, decisionmakers
want to understand their internal working. Despite
transparency and interpretability being considered by
some authors as ill-defined concepts (Lipton, 2018),
there is a recently growing interest in the model
transparency that narrows down to two approaches:
(1) Construct models that are transparent in the first
place, or (2) generate an explanation for a black-box
model.
The approach (1) follows the concept of natural
induction (i.e., Michalski, 2004; Wojtusiak et al.,
2006) in which models are created directly in a
transparent representation and are based on early
ideas in machine learning. The following paragraph
is from Michalski (1983) and is part of the first
published machine learning book:
The results of computer induction should be
symbolic descriptions of given entities, semantically
and structurally similar to those a human expert
might produce observing the same entities.
Components of these descriptions should be
comprehensible as single “chunks” of information,
directly interpretable in natural language, and
should relate quantitative and qualitative concepts in
an integrated fashion.
This approach assumes that the models are created
in representations that are easy to interpret. Among
the best-known transparent representations are
decision rules, decision trees, linear models such as
logistic regression or naïve Bayes, and sometimes
Bayesian networks. While the idea of using
transparent representations is great in principle, many
statistical methods outperform the transparent ones in
terms of statistical measures described in Section 2.2.
Statistical methods are usually simply more accurate.
In fact, one of benefits of using machine learning
methods is the ability to select from wide selection
available algorithms.
Therefore, considerable efforts are made to create
solutions to approach (2) that aims at explaining
black-box models. It is important to note that one can
explain algorithms that are used to create a model, but
it is impossible to grasp the entire model. For
example, how to explain a random forest with 1000
trees or a deep neural network?
There are numerous methods for explaining
global models that have been investigated, including
surrogate models, lists of predictors, and a wide range
of visualization techniques. Guidotti et al., (2018)
define global explanation of a black-box model in
terms of finding a transparent model (surrogate
model) that is able to mimic the behavior of the black-
box model. The authors provide review and discuss
approaches available in the literature. Similarly, Du
et al. (2020) discuss global model explanation mainly
in the context of deep neural networks. An interesting
study of trust in machine learning by clinicians is
presented by Tonekaboni et al. (2019) in which the
authors surveyed ICU clinicians about specific
aspects of model explanations that are useful to them.
A special issue of BMC Medical Informatics and
Decision Making fully dedicated to explainable AI
includes a wide range of related works (BMC, 2020).
Reproducibility, Transparency and Evaluation of Machine Learning in Health Applications
689

2.8 Local Prediction Explanation
Local prediction explanation refers to the ability of a
model to inform decision makers about the reasons of
why a specific prediction was made. While related to
the global model explanation, prediction explanation
requires different approaches. Very often, local
prediction explanation is more important for decision
makers than global explanation. Knowing why a
specific prediction is made, increases chance of that
prediction being used. There are four main types of
local explanations: listing top predictors for an
individual case, demonstrating causality, building
local models, and visualization. There are also several
less frequently used approaches, often developed in
the context of specific methods or application areas.
Local Interpretable Model-agnostic Explanations,
LIME (Ribeiro et al., 2016), and Shapley
Additive exPlanations, SHAP (), are two of the most
frequently used local explanation methods. The
approaches and their many recently published
variants rely on generating synthetic data close to the
example being explained and fitting local models into
that synthetic data. Such a simple model can be used
to locally explain prediction.
There are a number of other works in the literature
that base explanations on listing top predictors,
including Luo and Ruminshisky (2016) and Ge et al.
(2018) that used this approach in models for
predicting mortality in intensive care units (ICU).
Some authors argue that to explain prediction, one
needs to identify causal mechanism that links input
attributes to the predicted outcome (output attribute).
This approach is often done in the context of
graphical models such as Bayesian or Gaussian
Networks, and builds upon long research of Judea
Pearl (i.e., Pearl, 2000). Pearl (2019) recently argued
for the need of causality in machine learning
providing list of approaches that allow for causal
reasoning.
Uncertainty should be part of explanation. There
are no events in the future that can be predicted with
100% accuracy. This is the nature of time. We can
know for certain only the past that have happened, but
the future is always uncertain. Except for trivial
problems one should not expect to achieve 100%
accuracy for constructed models. This fact needs to
be communicated to end users. Further, in
classification problems, the goal is to predict the most
likely answer, but models typically communicate a
level of uncertainty in that answer (i.e., probability for
well-calibrated models as discussed in section 2.3).
Consequently, it is important to communicate and
explain that uncertainty as part of prediction. For
example, CBIT online calculator presents the
probability of a patient’s functional independence and
communicates that uncertainty in graphical form as
well as textual description (Wojtusiak et al., 2020).
Equipped with that information clinicians can make
informed decisions and decide on the appropriate
course of action.
2.9 Sharing Models and Programming
Interface
Models are created using a variety of computer
systems, programming languages, libraries, and tools.
Sharing only saved models is typically insufficient as
they need additional information to be properly
executed. For example, models that are saved in
scikit-learn library in Python can be safely loaded
only with the same version of the library, and all
dependent libraries. In addition, an ordered list of
inputs is needed so that the model is properly
executed. In practice, the most useful is to include a
part of source code that demonstrated how to load the
model, encode inputs, and execute the model on new
cases. When sharing models, complete information
needs to be given on how to load and execute them.
Sometimes models are accessible through an
application programming interface (API) allowing
remote computer systems to communicate with
models without the need for the need to depend on
specific computer implementation. Such
programming interfaces are typically based on a data
sharing standard such as XML or JSON.
2.10 Source Code
Full reproducibility of the experimental portion of the
work is even more complex. Inclusion of complete
source code for all parts of the work provides the
cleanest way of presenting steps taken to create
models. Full reproducibility may also require addition
of data used to train and test models, but data often
cannot be shared. Source code can be shared using a
public repository such as GitHub on an institutional
website. Some journals allow for submission of
additional materials, including data and source code.
In addition to reproducibility, sharing source code
allows for peer review of details of what has been
done. Others may find mistakes in the code that may
affect results. Fully opensource data analysis code
shared in a centralized repository may be the best way
to achieve transparency in the data analysis and
modeling.
HEALTHINF 2021 - 14th International Conference on Health Informatics
690

3 MLI CHECKLIST
The above criteria are summarized in the following
checklist intended to help organize reporting of
results. Even though there is no one-size-fits-all set of
evaluation criteria and metrics, the checklist is
intended to be a minimum set of reportable criteria.
MLI-1: Experimental Design
- Report inclusion criteria
- Provide descriptive statistics of data
- Describe data preprocessing & attribute construction
- Describe experimental setup, training & testing sets,
cross-validation
- Describe model training
MLI-2: Statistical Model Evaluation
- Calculate Accuracy, AUC, recall, precision, F1-score
MLI-3: Model Calibration
- Perform model calibration
- Report calibration curves and calibration measures
MLI-4: Top Predictors
- Report top-performing attributes in the model
MLI-5: Global Sensitivity Analysis
- Perform global sensitivity analysis for continuous and
discrete attributes
- Report sensitivity plots and analyze if models are stable
MLI-6: Decision Curve Analysis
- Assign costs to correctly and incorrectly classified
instances
- Construct decision curves and report on desirable
thresholds
MLI-7: Global Model Explanation
- If transparent representations are used, report entire
models
-Otherwise apply one of explanation methods to
describe models
MLI-8: Local Prediction Explanation
- Select and implement an approach to explain
predictions
MLI-9: Sharing Models and Programming
Interface
- Is sharing actual models include all needed information
to load and execute them
MLI-10: Source Code
- Share complete source code
4 CONCLUSION
Mature application of machine learning methods,
particularly in areas such as medicine and health care,
require detailed reporting on methods and results. The
presented ten MLI reporting criteria are based on
types of information typically present in the literature
(almost always separately) and are one step towards
gaining suers’ trust in the developed models and
increase their use. The presented criteria are focused
on data scientists and researchers who develop
models and contribute to scientific literature.
The presented work does not include many
additional criteria discussed in the literature, such as
ethical considerations of ML methods and their
applications in medicine, and legal requirements and
regulatory approvals. Instead, it focused on technical
concepts and research community.
Finally, the presented work is not nearly
complete. It represents one small piece of a larger
discussion on reproducibility, transparency, trust and
other related concepts in machine learning. The paper
presents current opinions of the author which are
likely to evolve.
ACKNOWLEDGEMENTS
The presented paper is partially based on early
content of technical report (Wojtusiak, 2020). The
author thanks Eman Elashkar and anonymous
reviewers who provided valuable comments that
helped improve the paper.
REFERENCES
Beam, A. L., Manrai, A. K., & Ghassemi, M. (2020).
Challenges to the reproducibility of machine learning
models in health care. Jama, 323(4), 305-306.
BMC (2020) call for papers on Explainable AI in Medical
Informatics and Decision Support:
https://www.biomedcentral.com/collections/explainableai
Cabitza, F., Campagner, A., & Sconfienza, L. M. (2020).
As if sand were stone. New concepts and metrics to
probe the ground on which to build trustable AI. BMC
Medical Informatics and Decision Making, 20(1), 1-21.
Du, M., Liu, N., & Hu, X. (2019). Techniques for
interpretable machine learning. Communications of the
ACM, 63(1), 68–77. https://doi.org/10.1145/3359786
Friedman, J. H. (2001). Greedy function approximation: a
gradient boosting machine. Annals of statistics, 1189-
1232.
Ge, Wendong, Jin-Won Huh, Yu Rang Park, Jae-Ho Lee,
Young-Hak Kim, and Alexander Turchin. "An
Interpretable ICU Mortality Prediction Model Based on
Logistic Regression and Recurrent Neural Networks
with LSTM units." In AMIA Annual Symposium
Proceedings, vol. 2018, p. 460. American Medical
Informatics Association, 2018.
Reproducibility, Transparency and Evaluation of Machine Learning in Health Applications
691

Guidotti, Riccardo, Anna Monreale, Salvatore Ruggieri,
Franco Turini, Fosca Giannotti, and Dino Pedreschi. "A
survey of methods for explaining black box
models." ACM computing surveys (CSUR) 51, no. 5
(2018): 1-42.
Gundersen, O. E. (2020). The Reproducibility Crisis Is
Real. AI Magazine, 41(3), 103-106.
Johnson, A. E., Pollard, T. J., & Mark, R. G. (2017,
November). Reproducibility in critical care: a mortality
prediction case study. In Machine Learning for
Healthcare Conference (pp. 361-376).
Kim, A. A., Zaim, S. R., & Subbian, V. (2020). Assessing
Reproducibility and Veracity across Machine Learning
Techniques in Biomedicine: A Case Study using TCGA
Data. International Journal of Medical Informatics,
104148.
Liaw, A., & Wiener, M. (2002). Classification and
regression by Random Forest. R news, 2(3), 18-22.
Lipton, Z. C. (2018). The mythos of model interpretability.
Queue, 16(3), 31-57.
Liu, Y., Chen, P. H. C., Krause, J., & Peng, L. (2019). How
to read articles that use machine learning: users’ guides
to the medical literature. Jama, 322(18), 1806-1816.
Liu, X., Rivera, S. C., Moher, D., Calvert, M. J., &
Denniston, A. K. (2020). Reporting guidelines for
clinical trial reports for interventions involving
artificial intelligence: the CONSORT-AI extension.
bmj, 370.
Lundberg, S. M., & Lee, S. I. (2017). A unified approach to
interpreting model predictions. In Advances in neural
information processing systems (pp. 4765-4774).
Luo, Yen-Fu, and Anna Rumshisky. "Interpretable topic
features for post-icu mortality prediction." In AMIA
Annual Symposium Proceedings, vol. 2016, p. 827.
American Medical Informatics Association, 2016.
Luo W, Phung D, Tran T, Gupta S, Rana S, Karmakar C,
Shilton A, Yearwood J, Dimitrova N, Ho TB,
Venkatesh S. Guidelines for developing and reporting
machine learning predictive models in biomedical
research: a multidisciplinary view. Journal of medical
Internet research. 2016;18(12):e323.
Michalski, R. S., "A Theory and Methodology of Inductive
Learning," Chapter in the book, Machine Learning: An
Artificial Intelligence Approach, R. S. Michalski, T. J.
Carbonell and T. M. Mitchell (Eds.), pp. 83-134,
TIOGA Publishing Co., Palo Alto, 1983.
Michalski, R. S., "ATTRIBUTIONAL CALCULUS: A
Logic and Representation Language for Natural
Induction," Reports of the Machine Learning and
Inference Laboratory, MLI 04-2, George Mason
University, Fairfax, VA, April, 2004.
Michalski, R. S. and Wojtusiak, J., "Semantic and Syntactic
Attribute Types in AQ Learning," Reports of the
Machine Learning and Inference Laboratory, MLI 07-
1, George Mason University, Fairfax, VA, 2007.
Moher, D., Hopewell, S., Schulz, K. F., & Montori, V.
(2010). G? tzsche, PC; Devereaux, PJ; Elbourne, D;
Egger, M; Altman, DG; CONSORT 2010 explanation
and elaboration: updated guidelines for reporting
parallel group randomised trials. BMJ, 340, c869.
Morgan, S.L. and Winship C., Counterfactuals and Causal
Inference: Methods and Principles for Social Research,
2nd Edition, Cambridge University Press, 2015.
Pearl, J. Causality, Cambridge University Press, 2000.
Pearl, J. (2019). The seven tools of causal inference, with
reflections on machine learning. Communications of the
ACM, 62(3), 54–60. https://doi.org/10.1145/3241036
Pineau, J., Vincent-Lamarre, P., Sinha, K., Larivière, V.,
Beygelzimer, A., d'Alché-Buc, F., ... & Larochelle, H.
(2020). Improving Reproducibility in Machine
Learning Research (A Report from the NeurIPS 2019
Reproducibility Program). arXiv preprint
arXiv:2003.12206.
Renard, F., Guedria, S., De Palma, N., & Vuillerme, N.
(2020). Variability and reproducibility in deep learning
for medical image segmentation. Scientific Reports,
10(1), 1-16.
Ribeiro, Marco Tulio, Singh, Sameer, and Guestrin,
Carlos.“why should I trust you?”: Explaining the
predictions of any classifier. In Knowledge discovery
and Data Mining (KDD), 2016.
Sciikit-learn website, Probability Calibration: https://scikit-
learn.org/stable/modules/calibration.html
Stevens, L. M., Mortazavi, B. J., Deo, R. C., Curtis, L., &
Kao, D. P. (2020). Recommendations for reporting
machine learning analyses in clinical research.
Circulation: Cardiovascular Quality and Outcomes,
CIRCOUTCOMES-120.
Tonekaboni, S., Joshi, S., McCradden, M. D., &
Goldenberg, A. (2019). What clinicians want:
contextualizing explainable machine learning for
clinical end use. arXiv preprint arXiv:1905.05134.
Vollmer, S., Mateen, B. A., Bohner, G., Király, F. J., Ghani,
R., Jonsson, P., ... & Granger, D. (2020). Machine
learning and artificial intelligence research for patient
benefit: 20 critical questions on transparency,
replicability, ethics, and effectiveness. bmj, 368.
Wicks, P., Liu, X., & Denniston, A. K. (2020). Going on up
to the SPIRIT in AI: will new reporting guidelines for
clinical trials of AI interventions improve their rigour?.
BMC medicine, 18(1), 1-3.
Wojtusiak, J., Michalski, R. S., Kaufman, K. and
Pietrzykowski, J., "Multitype Pattern Discovery Via
AQ21: A Brief Description of the Method and Its Novel
Features," Reports of the Machine Learning and
Inference Laboratory, MLI 06-2, George Mason
University, Fairfax, VA, June, 2006.
Wojtusiak, J., Elashkar, E. and Mogharab Nia, R., "C-
LACE2: computational risk assessment tool for 30-day
post hospital discharge mortality," Health and
Technology, Springer, 2018.
Yu, K. H., Lee, T. L. M., Yen, M. H., Kou, S. C., Rosen,
B., Chiang, J. H., & Kohane, I. S. (2020). Reproducible
Machine Learning Methods for Lung Cancer Detection
Using Computed Tomography Images: Algorithm
Development and Validation. Journal of medical
Internet research, 22(8), e16709.
HEALTHINF 2021 - 14th International Conference on Health Informatics
692
