
SIGRNN: Synthetic Minority Instances Generation in Imbalanced
Datasets using a Recurrent Neural Network
Reda Al-Bahrani
a
, Dipendra Jha
b
, Qiao Kang, Sunwoo Lee
c
, Zijiang Yang,
Wei-Keng Liao, Ankit Agrawal
d
and Alok Choudhary
Department of Electrical and Computer Engineering, Northwestern University, Evanston, IL, U.S.A.
Keywords:
Synthetic Data, Balancing, Oversampling, Classification, Imbalanced Dataset.
Abstract:
Machine learning models trained on imbalanced datasets tend to produce sub-optimal results. This happens be-
cause the learning of the minority classes is dominated by the learning of the majority class. Recommendations
to overcome this obstacle include oversampling the minority class by synthesizing new instances and using
different performance measures. We propose a novel approach to handle the imbalance in datasets by using a
sequence-to-sequence recurrent neural network to synthesize minority class instances. The generative neural
network is trained on the minority class instances to learn its data distribution; the generative neural network
is then used to synthesize minority class instances; these instances are used to augment the original dataset
and balance the minority class. We evaluate our proposed approach against several imbalanced datasets. We
train Decision Tree models on the original and augmented datasets and compare their results against the Syn-
thetic Minority Over-sampling TEchnique (SMOTE), Adaptive Synthetic sampling (ADASYN) and Synthetic
Minority Over-sampling TEchnique-Nominal Continuous (SMOTE-NC). All results are an average of mul-
tiple runs and the results are compared across four different performance metrics. SIGRNN performs well
compared to SMOTE and ADASYN, specifically in lower percentage increments to the minority class. Also,
SIGRNN outperforms SMOTE-NC on datasets having nominal features.
1 INTRODUCTION
Classification datasets for training machine learning
models are generally assumed to be balanced. A
balanced dataset is composed of approximately an
equal number of instances from each class. However,
some scientific and real-world datasets are highly im-
balanced. The ratio between some classes in these
datasets can be quite high. Machine learning models
trained on such imbalanced datasets tend to produce
sub-optimal results with inappropriate prediction ac-
curacy (Visa and Ralescu, 2005; Maloof, 2003).
Since the models focus on learning the data represen-
tation of the majority class, they tend to neglect the
data representation of the minority classes (Japkow-
icz et al., 2000; Japkowicz and Stephen, 2002). There
exist several research works that have investigated the
problem of imbalanced datasets with machine learn-
a
https://orcid.org/0000-0002-1528-0792
b
https://orcid.org/0000-0002-6210-1937
c
https://orcid.org/0000-0001-6334-3068
d
https://orcid.org/0000-0002-5519-0302
ing algorithms such as neural networks and support
vector machines (Fawcett and Provost, 1997; Chan
and Stolfo, 1998; Kubat et al., 1997b).
Some existing approaches to overcome the chal-
lenge of imbalance in training datasets include
re-sampling using unsupervised learning, under-
sampling the majority class, oversampling the minor-
ity class, synthesizing from the minority class, and us-
ing different performance measures (Yap et al., 2014;
Nickerson et al., 2001; Drummond et al., 2003; Es-
tabrooks et al., 2004). These approaches are based on
either decreasing the number of instances in the ma-
jority class or increasing the number of instances the
minority class. Usually, the minority class instances
are incremented by either repeating the original in-
stances or constructing new instances using nearest
neighbor approach based on random subsets of in-
stances.
Synthetic Minority Oversampling TEchnique
(SMOTE) increases the minority class by creating
synthetic instances based on the k-nearest neighbor
instances in the minority class (Chan and Stolfo,
1998). SMOTE, as demonstrated on multiple datasets
Al-Bahrani, R., Jha, D., Kang, Q., Lee, S., Yang, Z., Liao, W., Agrawal, A. and Choudhar y, A.
SIGRNN: Synthetic Minority Instances Generation in Imbalanced Datasets using a Recurrent Neural Network.
DOI: 10.5220/0010348103490356
In Proceedings of the 10th International Conference on Pattern Recognition Applications and Methods (ICPRAM 2021), pages 349-356
ISBN: 978-989-758-486-2
Copyright
c
2021 by SCITEPRESS – Science and Technology Publications, Lda. All rights reserved
349

by the authors, can handle continuous variables
only. Synthetic Minority Over-sampling TEchnique-
Nominal Continuous (SMOTE-NC) is a variant pre-
sented in the paper able to handle nominal data.
SMOTE-NC was tested by the authors on a single
dataset, the Adult dataset. SMOTE and SMOTE-NC
cannot generate synthetic instances in a dataset con-
taining only nominal features. To our knowledge,
SMOTE and many SMOTE variants (Han et al., 2005;
Ramentol et al., 2012; Maciejewski and Stefanowski,
2011) can only operate on datasets containing numeri-
cal features. Adaptive synthetic sampling (ADASYN)
(He et al., 2008) is another approach where the algo-
rithm tries to learn examples that are harder to gener-
ate in the minority class.
In this paper, we present a novel approach
of Synthetic minority Instances Generation using
Recurrent Neural Network (SIGRNN) to handle the
imbalance in datasets. The proposed approach uti-
lizes an encoder-decoder recurrent neural network to
generate synthetic instances from the minority class
population. Instances in the minority class of the
dataset are treated as a fixed length set of features
where each feature is represented by a set of tokens.
By treating each instance in the minority class as a
small set vocabulary (a sentence), the sequence-to-
sequence encoder-decoder recurrent neural network is
trained to predict the next token based on the current
and past input tokens of a sentence. The SIGRNN
model is trained only on the minority class to augment
the training datasets by generating synthetic minority
instances We evaluate our approach using three dif-
ferent datasets. These datasets represent different fea-
ture types, minority class to majority class ratios, and
minority class sizes.
To analyze the impact of the proposed data aug-
mentation approach, Decision Tree models were
trained on the original dataset and the augmented
datasets, and the results were compared against
SMOTE, ADASYN, and SMOTE-NC depending on
the input dataset. Metrics such as Accuracy, Area un-
der the ROC Curve, F1 score, and Gmean were com-
pared.
2 RELATED WORK
2.1 Over-sampling
Synthetic Minority Over-sampling TEchnique
(SMOTE) presented in (Chawla et al., 2002) over-
samples the minority class by creating “synthetic”
examples. SMOTE operates on the features by
taking each minority class instance and introducing
synthetic instances along the line segments joining
any/all of the k minority class nearest neighbors. A
number of synthetic instances are generated based
on the k nearest neighbors of each instance in the
minority class. In case there exist nominal features
in the data, Synthetic Minority Over-sampling
TEchnique-Nominal Continuous (SMOTE-NC)
populates nominal features by selecting the value
occurring in the majority of the k-nearest neighbors.
Adaptive Synthetic Sampling approach (ADASYN)
is another approach where the algorithm focuses
on learning examples that are hard to generate in
the minority class while focusing less on generating
examples that are easy to learn.
2.2 Performance Measures
Several performance measures have been proposed to
measure the effectiveness of machine learning classi-
fiers on the minority class. The area under the receiver
operating characteristic curve is by far the most used.
The AUC ROC represents the relationship between
sensitivity and specificity (Beck and Shultz, 1986).
The F1-score captures the relationship between pre-
cision and recall. Other measures have been proposed
such as the geometric mean (Kubat et al., 1997b).
2.3 Language Modeling
In statistical language modeling recurrent neural net-
works have been used to learn a representation of
words by training on a large corpus (Bengio et al.,
2003). Such models are capable of learning the prob-
ability of word sequences. In (Cho et al., 2014) the
authors propose a recurrent neural network encoder-
decoder architecture capable of learning mappings of
input sequences to an output sequence. The concept
of sequence-to-sequence recurrent neural networks
since has been used for tasks such as language trans-
lation (Sutskever et al., 2014) and generating image
descriptions (Karpathy and Fei-Fei, 2015).
3 SYNTHETIC MINORITY
INSTANCES GENERATION
USING A RECURRENT
NEURAL NETWORK
The overall process of the SIGRNN approach is com-
posed of four main steps - feature ordering, building
the corpus and input data for training the recurrent
neural network, model selection and training, and data
ICPRAM 2021 - 10th International Conference on Pattern Recognition Applications and Methods
350

instance generation using the trained model. These
steps are explained below.
3.1 Entropy based Feature Ordering
Text inputs in general RNN training follow the syntax
and semantics of the language. The same word can
be used at different positions in the input with/without
altering the meaning of the sentence; the RNN model
would automatically capture the semantics of the lan-
guage from the input sentences. In our case, the in-
put is not from a natural language; rather the input
sentences are records, the feature order is based on
the original dataset. The order of features from the
original dataset does not have any particular mean-
ing, they can be ordered in any way and used as input
to train our model. However, the order of features in
the input can be critical to the learning of the RNN
model. Some features can be easy to learn, only hav-
ing some specific range/list of values for our minority
class, while the model can get confused with other
features having a broader range of values. To handle
this, we used an entropy-based feature ordering for
our input training data.
We apply an entropy ordering method to gener-
ate new records. A parameter setting for the LSTM
model can encode the joint probability distribution
of all features. Having an ordered set of features
{X
1
, ..X
n
}, an LSTM model can encode the distribu-
tions of P
c
(X
i
|X
1
, .., X
i−1
)∀i ∈ [1, n] for a particular
class c. The joint distribution of all features can be
derived as the following.
P
c
(X
1
= x
1
, .., X
n
= x
n
) =
n
∏
i=1
P
c
(X
i
= x
i
|X
1
= x
1
, .., X
i−1
= x
i−1
)
(1)
Based on P
c
(X
1
, .., X
n
), denoted as P, we can gen-
erate random sequences of features for future train-
ing. It is obvious that the computation of feature joint
distribution depends on the ordering of features. If
the LSTM models can perfectly model the conditional
distributions, the ordering does not matter. However,
this assumption is usually unrealistic, especially when
the instance is imbalanced. Let ε be an upper bound
error associated with the conditional probability, as-
suming ε + p
i
< 1 and p
i
−ε > 0 ∀1 ≤i ≤n. We want
to minimize the error term in the final joint probability
distribution, denoted as ∆(X
1
, ..., X
n
). We use notation
p
i
= P
c
(X
i
|X
1
, ..., X
i−1
) for simplicity.
∆(X
1
, ..., X
n
) = |
n
∏
i=1
(p
i
±ε) −P| (2)
However, p
i
and p
j
are not independent of each
other, since they both depend on the choice of fea-
ture ordering. As a result, we cannot simply minimize
each of the p
i
terms. An exhaustive search for the fea-
ture ordering has a factorial complexity with respect
to the number of features, which is not feasible in re-
ality.
To solve this problem, we apply a greedy heuristic
search approach based on entropy. The entropy of p
i
,
denoted as H(p
i
), measures the degree of randomness
of a probability distribution. It has the following prop-
erty: If the probabilities of k random variables are all
close to
1
k
, the entropy approaches to the maximum
entropy log(k). Moreover, ∆(x
1
, ..., x
n
) is minimized
if all terms p
i
are as close to uniform distribution as
possible. Thus, maximizing
n
∑
i=1
H(p
i
) is equivalent
to minimizing ∆(X
1
, ..., X
n
). Hence we order the fea-
tures based on the conditional entropy p
i
using a De-
cision Tree method. This approach is equivalent to a
greedy search of n layers using entropy of p
i
∀i ∈[1, n]
as heuristics.
We trained a Decision Tree based on entropy as
the decision criterion on our original training data. In
a Decision Tree, the feature entropy decreases from
root to leaves; the features at the top have high en-
tropy while the leaves have an entropy of zero. We
use the entropy computed by a Decision Tree to sort
our input features from highest to lowest entropy. The
model is provided with features using this order dur-
ing training.
3.2 Building the Corpus and Input Data
We convert the minority class instances into a corpus
to train the SIGRNN. An instance R consists of X
features: categorical and numerical features. Each
value V in a feature is considered to be a word in
the vocabulary. To uniquely identify a feature based
on its value, the words are assigned tokens. For in-
stance, one of our features is GENDER, having two
categories- 1 for MALE and 2 for FEMALE, two to-
kens will be generated for the GENDER, these tokens
are: GENDER MALE and GENDER FEMALE. Af-
ter these tokens are generated we use them to convert
instances in the feature space to sentences in the lan-
guage space.
The final corpus is composed of sentences con-
taining X words (tokens) where each word repre-
sents a feature value and the sentence represents
an instance. The corpus generated consists of sen-
tences corresponding to the minority class instances
in the training dataset. Next, we build a vocabulary
to uniquely map each word in our training dataset
into embeddings and convert our input sentences into
word vectors. These word vectors are fed into the
SIGRNN for training.
SIGRNN: Synthetic Minority Instances Generation in Imbalanced Datasets using a Recurrent Neural Network
351

3.3 Model Training and Instance
Generation
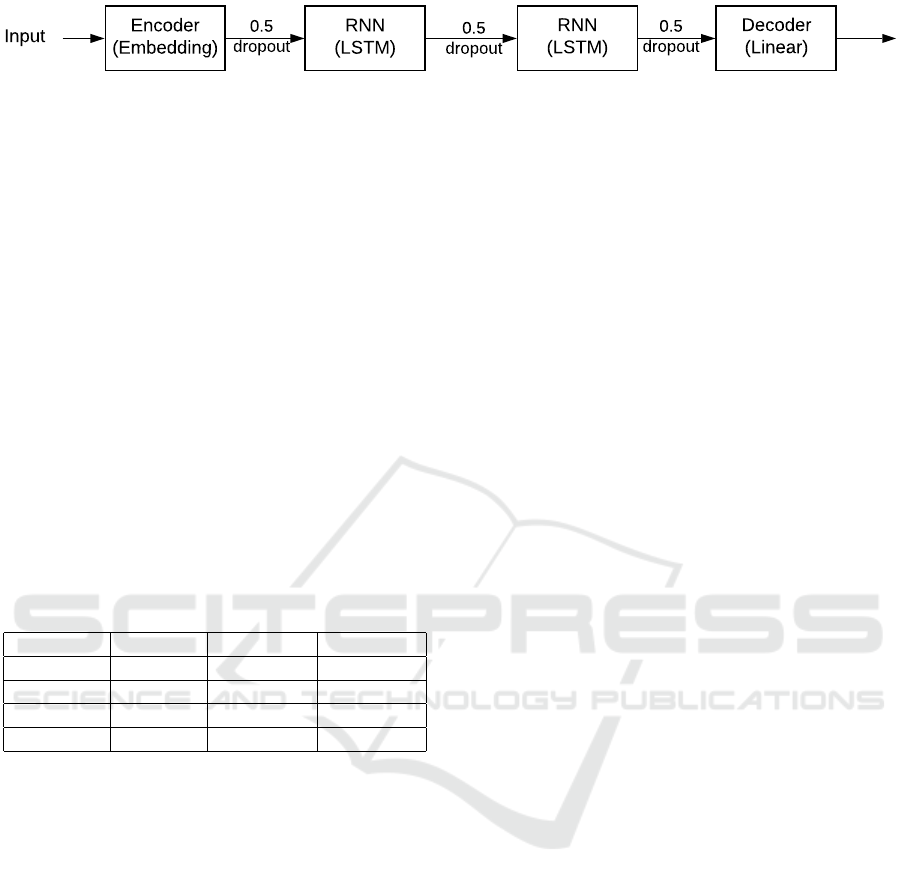
The SIGRNN is composed of an encoder-decoder
model using Long-short Term Memory (LSTM) cells
to predict the next feature based on the observed fea-
tures. The encoder is basically an embedding look-
up table for the input word vectors; it converts the
inputs from high dimension due to large size of vo-
cabulary to a reduced representation. A sequence to
sequence decoder is used on top of the encoder out-
put, and is composed of multiple LSTM layers. We
experimented with different number of LSTM cells in
different layers and different hyper-parameters to fine
tune our model; the experiments presented here used
a decoder layer, two layers of 512 or 1,024 LSTM
cells, and a decoder, with a mini batch size of 8 or
32 depending of the dataset size. A fully connected
layer with softmax activation is used on the decoder
output to get the probability of output words. The
model architecture is shown in Figure 1. The embed-
ding size used was the same size of the number of
tokens in the minority class of the training set. The
models were trained for 15 epochs. Once the models
were trained, sequences of tokens are then generated
using the network. Finally, the generated tokens are
converted back from the language space to the feature
space and the training datasets were augmented from
the generated instances.
3.4 Evaluation Approach
We trained Decision Tree models to evaluate and
compare the impact of data augmentation using the
SIGRNN against SMOTE, ADASYN, and SMOTE-
NC. The models are trained and selected through a
10-fold cross-validation; each experiment is run with
10 different random seeds. The results are an aver-
age over the 10 runs. This comparison is carried out
to evaluate the data generation and not the machine
learning algorithm itself. We use Decision Trees
as the baseline model and use it throughout evalua-
tion of datesets generated by SMOTE, ADASYN, and
SMOTE-NC, and our proposed recurrent neural net-
work approach.
The network is coded using PyTorch (Paszke
et al., 2017) and is trained using an Nvidia GPU (GTX
TitanX). To build the Decesion Tree models h2o plat-
form (Candel et al., 2016) has been used, and to bal-
ance using SMOTE, ADASYN, and SMOTE-NC we
used the implementation of (Lema
ˆ
ıtre et al., 2017).
4 RESULTS
In this section, we evaluate the efficiency of our pro-
posed approach by analyzing two factors. First, we
compare the quality of the generated data compared to
the original minority class data. Second, we evaluate
SIGRNN against SMOTE, and ADASYN by compar-
ing Decision Tree performance across different per-
formance metrics. Also, we compare SIGRNN and
SMOTE-NC on datasets that contain nominal fea-
tures.
4.1 Performance Metrics
Decision Trees were used as the baseline model in all
experiments. The built models were evaluated on the
following performance metrics:
1. Accuracy: It is the fraction of correctly classified
examples in the test set.
Accuracy =
correct predictions
totalnumbero f predictions
(3)
2. Area under the Receiver Operating Character-
istic Curve: The ROC curve is created by plotting
the true positive rate (TPR) against the false posi-
tive rate (FPR) at various threshold settings.
3. F1-score: It is a measure of a test’s accuracy. It
considers both precision and recall of the test to
compute the score. The F1 score is the harmonic
average of the precision and recall.
F
1
= 2 ×
precision ×recall
precision + recall
(4)
4. Geometric Mean of Class Accuracy: It com-
bines the positive class accuracy (PA) and the neg-
ative class accuracy (NA).(Kubat et al., 1997a)
Gmean =
√
PA ×NA (5)
4.2 Datasets
We present results for three different datasets, these
datasets are publicly available (Dua and Graff, 2017).
Table 1 describes the datasets used in our experiments
as below.
1. SATIMAGE: This database consists of t values
of pixels in 3 by 3 neighbourhoods in a satellite
image, and the classification associated with the
central pixel in each neighbourhood. The goal is
to classify the pixel, given the multi-spectral val-
ues. To generate an imbalanced dataset all classes
were collapsed except for class 4.
ICPRAM 2021 - 10th International Conference on Pattern Recognition Applications and Methods
352
Encoder
(Embedding)
RNN
(LSTM)
RNN
(LSTM)
0.5
dropout
Decoder
(Linear)
Input
0.5
dropout
0.5
dropout
Figure 1: An overview of the recurrent neural network architecture used to generate synthetic minority class instances.
2. HABERMAN: This dataset contains breast can-
cer cases from the Billings Hospital at the Uni-
versity of Chicago. The two classes present in
the dataset indicate survival of 5 years of patients
who had undergone surgery for breast cancer be-
tween 1958 and 1970. The data consists of four
attributes: age of patient at time of operation, year
of operation, number of positive axillary nodes
detected, and survival status.
3. ADULT: The Adult dataset consists of Census In-
come information and is used to predict if an in-
dividual’s income is greater than $50K/yr. The
information was extracted from the 1994 census
bureau database. It contains information of work-
ing adults between the ages of 16 and 100. The
dataset contains 48,842 records, each record con-
taining five numerical and eight categorical fea-
tures.
Table 1: Description of the datasets used in our experi-
ments.
Train Test
Name Types Maj/Min Maj/Min
Satimage Num 4k/415 1.7k/211
Haberman Num 179/65 46/16
Adult Num/Cat 24.7k/7.8k 12.4k/3.8k
4.3 Quality of Generated Data
We compare the quality of the generated instances by
comparing their distribution with the original minor-
ity class instances. We took two features from the
ADULT dataset and generated histogram diagrams.
The blue histograms are for SMOTE-NC, red for
SIGRNN, and black is the original data. In Figure 2
the original minority class and the generated minority
class instances are overlayed to compare the distribu-
tion of the two features. In both features SIGRNN
generates data that spans the whole set of bins, while
SMOTE-NC struggles to generate values in the under-
represented bins i.e. the bins on the two tails of the
distribution.
4.4 Performance Improvement
We compared the performance improvements by
training Decision Tree models on the augmented
dataset. For this, we train the Decision Tree models
on training datasets created using different amount of
synthetic instances (from 100% to 900% depending
on the dataset size). We compare the performance of
our models trained on data augmented using recurrent
neural network to the same models trained on the data
augmented using SMOTE, ADASYN, and SMOTE-
NC.
We performed a 10-fold cross validation with
hyper-parameter tuning. The best model from 10-
fold cross validation was selected. The final model
is then used to generate performance metrics on the
test set. This process was repeated at every increment
in the minority class. First, Table 2 shows the com-
parison of SIGRNN and SMOTE-NC on the Adult
dataset. SIGRNN performs well on datasets contain-
ing nominal data. We suspected that there will be
a performance gap between SIGRNN and SMOTE-
NC, since SMOTE-NC selects the value occurring
the most in the k-nearest neighbors for nominal val-
ues while SIGRNN produces a value based on the
sequence of prior features while generating the in-
stance. Second, in Table 3 and 4 we compare the per-
formace of the two datasets consisting of only con-
tinuous features over multiple performance metrics.
Looking at the Gmean metric our proposed method
outperforms SMOTE and ADASYN in most cases.
Area under the ROC also shows improvement over
other algorithms in most increments. In the case of
Accuracy and F1 score, SIGRNN either matches or
slightly trails SMOTE and ADASYN. SIGRNN per-
formance can be compared to SMOTE even in cases
where the training minority class is small.
5 CONCLUSION AND FUTURE
WORK
We formalize a method to handle imbalance in
datasets utilizing a language model approach by con-
verting a dataset to a corpus and then applying a
sequence-to-sequence generative neural network to
generate new sentences in the corpus. The gener-
ated corpus is then converted back to the original fea-
ture space. The transformation from feature space
to corpus and back again to feature space produces
promising results to tackle imbalanced datasets. We
evaluated this method using multiple datasets of dif-
SIGRNN: Synthetic Minority Instances Generation in Imbalanced Datasets using a Recurrent Neural Network
353
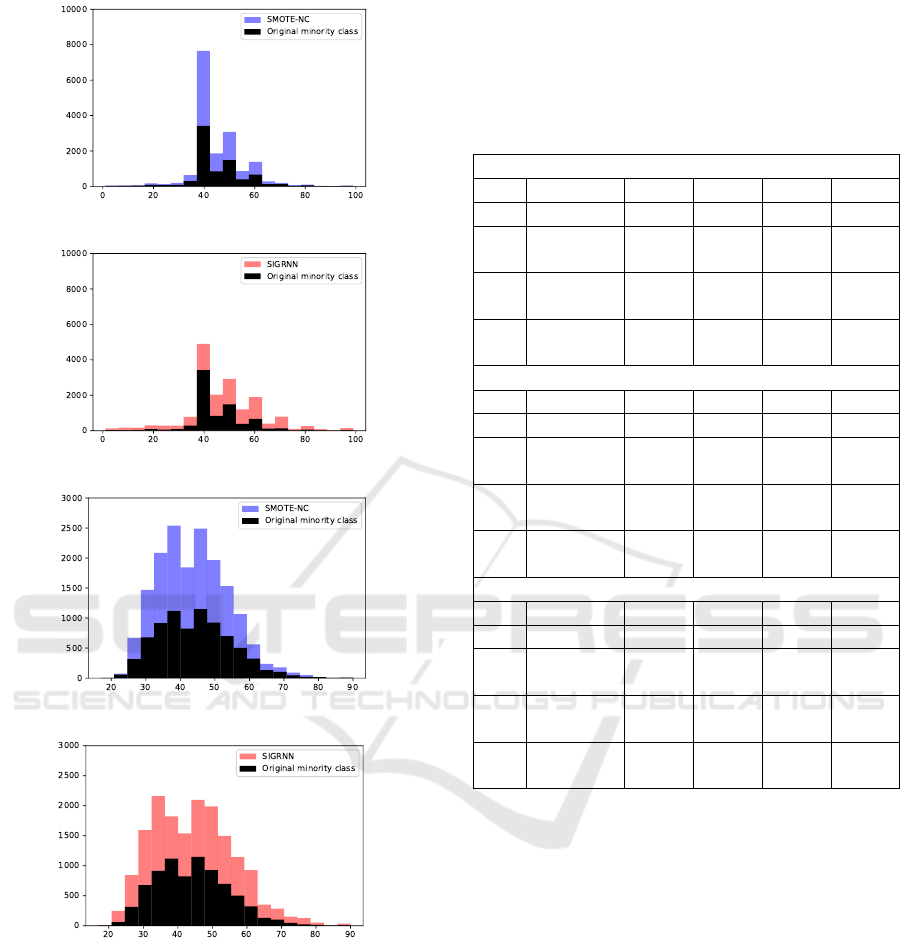
(a) ADULT histogram of hours per week
(b) ADULT histogram of hours per week
(c) ADULT histogram of age
(d) ADULT histogram of age
Figure 2: Histograms showing distribution of the actual mi-
nority class vs. the synthetic generated instances for two
features from the ADULT dataset. The blue histograms are
for SMOTE-NC, red for SIGRNN, and black is the origi-
nal data. This overly is to compare the distribution of the
two features. In both features SIGRNN generates data that
spans the whole set of bins, while SMOTE-NC struggles to
generate values in the under-represented bins.
ferent sizes, and features types. We demonstrated
that the approach works well compared to SMOTE,
ADASYN, and SMOTE-NC. Although, we handle
numerical attributes in our proposed implementa-
Table 2: The adult dataset consists of a mixture of continu-
ous and nominal features. Adult-1 is the original form of the
dataset while Adult-2, and Adult-3 are created by remov-
ing continuous and nominal features respectively. Features
were removed to demonstrate the behaviour of SMOTE-NC
(S-NC) compared to SIGRNN in handling nominal features.
Where * is present the variance is ±0.01.
Adult-1
% Method Acc AUC F1 Gm
0 - 0.83 0.81* 0.89 0.75*
100 SIGRNN 0.81 0.82 0.87 0.78*
S-NC 0.81 0.82 0.87 0.78
200 SIGRNN 0.8 0.83 0.86 0.79
S-NC 0.81 0.82 0.87 0.79
300 SIGRNN 0.8 0.83 0.86 0.79
S-NC 0.8 0.82 0.86 0.79
Adult-2
% Method Acc AUC F1 Gm
0 - 0.8 0.77 0.87 0.68*
100 SIGRNN 0.79 0.79* 0.86 0.71*
S-NC 0.78 0.78 0.85 0.72
200 SIGRNN 0.77 0.79 0.84 0.72
S-NC 0.75* 0.78 0.82* 0.73
300 SIGRNN 0.77 0.8 0.84 0.72
S-NC 0.75* 0.78 0.82* 0.74
Adult-3
% Method Acc AUC F1 Gm
0 - 0.82 0.8 0.88 0.74
100 SIGRNN 0.81 0.82 0.87 0.76
S-NC 0.8 0.8 0.86 0.77
200 SIGRNN 0.79 0.82 0.86 0.78
S-NC 0.79 0.81 0.85 0.78
300 SIGRNN 0.79 0.82* 0.85 0.78
S-NC 0.78 0.81 0.85 0.78
tion, this approach can be improved by adopting a
branched recurrent neural network where each data
type is handled by a branch to avoid converting nu-
merical values to tokens before training the SIGRNN.
We plan to experiment with adversarial training in fu-
ture and train on both classes to generate better mi-
nority class instances.
ACKNOWLEDGMENT
This work is supported in part by the U.S. Department
of Energy award numbers DE-SC0014330 and DE-
SC0019358 and National Institute of Standards and
Technology award number 70NANB19H005.
ICPRAM 2021 - 10th International Conference on Pattern Recognition Applications and Methods
354

Table 3: Results for the decision tree on the Haberman dataset. Each result presents is the average of 10 different runs and the
associated standard deviation. We can ovserve that SIGRNN performs well on the AUC ROC, and Gmean metrics in earlier
increments. SIGRNN performs well as good as the other balancing methods on the F1 metric.
Haberman
% Method Acc AUC F1 Gmean
0 - 0.69 ±0.05 0.61 ±0.05 0.79 ±0.04 0.57 ±0.06
100 SIGRNN 0.65 ±0.03 0.59 ±0.04 0.76 ±0.03 0.56 ±0.06
SMOTE 0.65 ±0.04 0.58 ±0.04 0.76 ±0.03 0.55 ±0.05
ADASYN 0.65 ±0.06 0.58 ±0.07 0.75 ±0.05 0.55 ±0.08
Table 4: Results for the decision tree on the Satimage dataset. Each result presents is the average of 10 different runs and the
associated standard deviation. We can ovserve that SIGRNN performs well on the AUC ROC, and Gmean metrics in earlier
increments. SIGRNN performs well as good as the other balancing methods on the F1 metric.
Satimage
% Method Acc AUC F1 Gmean
0 - 0.9±0.01 0.74±0.01 0.95±0.0 0.71±0.02
100 SIGRNN 0.9±0.01 0.77±0.02 0.94±0.0 0.75±0.03
SMOTE 0.9±0.01 0.77±0.01 0.94±0.0 0.75±0.02
ADASYN 0.9±0.01 0.76±0.02 0.94±0.0 0.74±0.03
200 SIGRNN 0.89±0.01 0.78±0.02 0.94±0.0 0.76±0.02
SMOTE 0.9±0.01 0.77±0.02 0.94±0.0 0.76±0.02
ADASYN 0.9±0.01 0.77±0.01 0.95±0.0 0.75±0.01
300 SIGRNN 0.89±0.01 0.79±0.01 0.94±0.0 0.79±0.02
SMOTE 0.89±0.01 0.78±0.02 0.94±0.0 0.77±0.02
ADASYN 0.89±0.01 0.77±0.02 0.94±0.0 0.76±0.03
400 SIGRNN 0.88±0.01 0.79±0.01 0.93±0.0 0.79±0.01
SMOTE 0.9±0.01 0.79±0.01 0.94±0.0 0.78±0.02
ADASYN 0.89±0.01 0.78±0.01 0.94±0.0 0.77±0.02
500 SIGRNN 0.88±0.01 0.8±0.02 0.93±0.0 0.8±0.02
SMOTE 0.89±0.01 0.78±0.01 0.94±0.0 0.79±0.01
ADASYN 0.88±0.0 0.8±0.01 0.93±0.0 0.79±0.01
600 SIGRNN 0.88±0.01 0.8±0.02 0.93±0.01 0.8±0.01
SMOTE 0.89±0.01 0.79±0.01 0.94±0.0 0.8±0.02
ADASYN 0.87±0.01 0.8±0.01 0.93±0.01 0.79±0.01
700 SIGRNN 0.88±0.01 0.8±0.01 0.93±0.0 0.81±0.01
SMOTE 0.88±0.01 0.8±0.01 0.93±0.0 0.8±0.01
ADASYN 0.88±0.01 0.81±0.02 0.93±0.0 0.8±0.02
800 SIGRNN 0.88±0.0 0.81±0.01 0.93±0.0 0.81±0.01
SMOTE 0.88±0.01 0.8±0.01 0.93±0.0 0.8±0.01
ADASYN 0.88±0.01 0.82±0.01 0.93±0.0 0.83±0.01
900 SIGRNN 0.87±0.01 0.8±0.02 0.93±0.0 0.81±0.02
SMOTE 0.88±0.01 0.81±0.01 0.93±0.0 0.81±0.01
ADASYN 0.88±0.01 0.83±0.01 0.93±0.0 0.84±0.01
REFERENCES
Beck, J. R. and Shultz, E. K. (1986). The use of rela-
tive operating characteristic (roc) curves in test perfor-
mance evaluation. Archives of pathology & laboratory
medicine, 110(1):13–20.
Bengio, Y., Ducharme, R., Vincent, P., and Jauvin, C.
(2003). A neural probabilistic language model. Jour-
nal of machine learning research, 3(Feb):1137–1155.
Candel, A., Parmar, V., LeDell, E., and Arora, A. (2016).
H2o.ai. H2O. ai Inc.
Chan, P. K. and Stolfo, S. J. (1998). Toward scalable learn-
ing with non-uniform class and cost distributions: A
case study in credit card fraud detection. In KDD, vol-
ume 98, pages 164–168.
Chawla, N. V., Bowyer, K. W., Hall, L. O., and Kegelmeyer,
W. P. (2002). Smote: synthetic minority over-
sampling technique. Journal of artificial intelligence
SIGRNN: Synthetic Minority Instances Generation in Imbalanced Datasets using a Recurrent Neural Network
355

research, 16:321–357.
Cho, K., Van Merri
¨
enboer, B., Gulcehre, C., Bahdanau, D.,
Bougares, F., Schwenk, H., and Bengio, Y. (2014).
Learning phrase representations using rnn encoder-
decoder for statistical machine translation. arXiv
preprint arXiv:1406.1078.
Drummond, C., Holte, R. C., et al. (2003). C4. 5, class
imbalance, and cost sensitivity: why under-sampling
beats over-sampling. In Workshop on learning from
imbalanced datasets II, volume 11, pages 1–8. Cite-
seer.
Dua, D. and Graff, C. (2017). UCI machine learning repos-
itory.
Estabrooks, A., Jo, T., and Japkowicz, N. (2004). A multi-
ple resampling method for learning from imbalanced
data sets. Computational intelligence, 20(1):18–36.
Fawcett, T. and Provost, F. (1997). Adaptive fraud de-
tection. Data mining and knowledge discovery,
1(3):291–316.
Han, H., Wang, W.-Y., and Mao, B.-H. (2005). Borderline-
smote: a new over-sampling method in imbalanced
data sets learning. In International conference on in-
telligent computing, pages 878–887. Springer.
He, H., Bai, Y., Garcia, E. A., and Li, S. (2008). Adasyn:
Adaptive synthetic sampling approach for imbal-
anced learning. In Neural Networks, 2008. IJCNN
2008.(IEEE World Congress on Computational In-
telligence). IEEE International Joint Conference on,
pages 1322–1328. IEEE.
Japkowicz, N. et al. (2000). Learning from imbalanced
data sets: a comparison of various strategies. In AAAI
workshop on learning from imbalanced data sets, vol-
ume 68, pages 10–15. Menlo Park, CA.
Japkowicz, N. and Stephen, S. (2002). The class imbalance
problem: A systematic study. Intelligent data analy-
sis, 6(5):429–449.
Karpathy, A. and Fei-Fei, L. (2015). Deep visual-semantic
alignments for generating image descriptions. In Pro-
ceedings of the IEEE conference on computer vision
and pattern recognition, pages 3128–3137.
Kubat, M., Holte, R., and Matwin, S. (1997a). Learning
when negative examples abound. In European Confer-
ence on Machine Learning, pages 146–153. Springer.
Kubat, M., Matwin, S., et al. (1997b). Addressing the curse
of imbalanced training sets: one-sided selection. In
ICML, volume 97, pages 179–186. Nashville, USA.
Lema
ˆ
ıtre, G., Nogueira, F., and Aridas, C. K. (2017).
Imbalanced-learn: A python toolbox to tackle the
curse of imbalanced datasets in machine learning.
Journal of Machine Learning Research, 18(17):1–5.
Maciejewski, T. and Stefanowski, J. (2011). Local neigh-
bourhood extension of smote for mining imbalanced
data. In 2011 IEEE Symposium on Computational In-
telligence and Data Mining (CIDM), pages 104–111.
IEEE.
Maloof, M. A. (2003). Learning when data sets are imbal-
anced and when costs are unequal and unknown. In
ICML-2003 workshop on learning from imbalanced
data sets II, volume 2, pages 2–1.
Nickerson, A., Japkowicz, N., and Milios, E. E. (2001). Us-
ing unsupervised learning to guide resampling in im-
balanced data sets. In AISTATS.
Paszke, A., Gross, S., Chintala, S., Chanan, G., Yang, E.,
DeVito, Z., Lin, Z., Desmaison, A., Antiga, L., and
Lerer, A. (2017). Automatic differentiation in pytorch.
xyz.
Ramentol, E., Caballero, Y., Bello, R., and Herrera, F.
(2012). Smote-rsb*: a hybrid preprocessing approach
based on oversampling and undersampling for high
imbalanced data-sets using smote and rough sets the-
ory. Knowledge and information systems, 33(2):245–
265.
Sutskever, I., Vinyals, O., and Le, Q. V. (2014). Se-
quence to sequence learning with neural networks. In
Advances in neural information processing systems,
pages 3104–3112.
Visa, S. and Ralescu, A. (2005). Issues in mining imbal-
anced data sets-a review paper. In Proceedings of
the sixteen midwest artificial intelligence and cogni-
tive science conference, volume 2005, pages 67–73.
sn.
Yap, B. W., Rani, K. A., Rahman, H. A. A., Fong, S.,
Khairudin, Z., and Abdullah, N. N. (2014). An appli-
cation of oversampling, undersampling, bagging and
boosting in handling imbalanced datasets. In Pro-
ceedings of the first international conference on ad-
vanced data and information engineering (DaEng-
2013), pages 13–22. Springer.
ICPRAM 2021 - 10th International Conference on Pattern Recognition Applications and Methods
356
