
Ultra-Wideband Radar Detection of Breathing Rate: A Comparative
Evaluation
Nicole Buckingham
a
and Denis Gra
ˇ
canin
b
Department of Computer Science, Virginia Tech, 2202 Kraft Drive, Blacksburg, VA 24060, U.S.A.
Keywords:
Biosensors, Breathing Rate, Human Computer Interaction, Remote Sensing.
Abstract:
The cost of a medical grade breathing rate monitors can be prohibitive. However, commodity ultra-wideband
(UWB) radar based device can be used to detect breathing rate for health monitoring applications in homes.
We identified several research challenges, including high cost and functional limitations based on the user’s
location, orientation, and movement, as well as dependency on system placement and vulnerabilities in signal
processing methods. We performed a comparative evaluation for a commodity UWB radar based device,
Walabot, to determine its feasibility for health monitoring applications. The data was processed using two
breathing rate derivation techniques: Fast Fourier Transformation (FFT) and Peak Detection. The results
support feasibility of Walabot as a commodity breathing rate monitor for health monitoring in homes.
1 INTRODUCTION
Human body produces a variety of physiological sig-
nals. Four important signals are the heart rate, breath-
ing rate, temperature and blood pressure. These sig-
nals are known as the vital signs because they provide
a well rounded indication of the overall state of the
body. Health monitoring focuses on measuring vari-
ous physiological signals and processing these signals
to determine health status.
Heart rate is controlled by the rate at which the
sinoatrial node creates electrical impulses. Resting
heart rate depends on age, gender and exercise level,
but an increase in resting heart rate can reveal declin-
ing heart health and increase in risk of heart attack.
The respiratory system is responsible for the
breathing mechanism. The rate at which breath-
ing occurs is specifically controlled by the respira-
tory pacemaker. Variation in breathing rate are com-
monly associated with conditions like asthma, anx-
iety, pneumonia, lung disease and congestive heart
failure (Cleveland Clinic, 2019).
Traditionally, heart rate is used to determine risk
of heart attack and failure. However, studies have
shown that breathing rate is a more accurate way to
detect or predict heart conditions, such as cardiac ar-
rest (Cretikos et al., 2008).
a
https://orcid.org/0000-0003-2558-5861
b
https://orcid.org/0000-0001-6831-2818
Contactless health monitoring systems use sen-
sor(s) placed in the vicinity of the user but without any
direct user contact. The goal is to provide the same ca-
pabilities of wearable technology, but with the added
benefits of increased comfort. This is significant for
health applications because the users may not always
be able to correctly use wearable devices.
The effectiveness of health monitoring systems is
affected by the environment in which they are used.
Contactless devices, in particular, can benefit from en-
vironments such as Smart Built Environments (SBE)
that provide data collection and analysis services in-
tegrated within a control infrastructure (Tasooji et al.,
2018). The cost of a medical grade breathing rate
monitors can be prohibitive for use in SBEs (e.g.,
smart homes). However, there are technologies that
can be used for contactless breathing rate monitors.
Ultra-wideband (UWB) devices use a wide spec-
trum of low energy radio frequency signals to de-
termine the chest displacement caused by breathing.
The measurements can be very accurate but also can
be sensitive to noise and limited by user location.
UWB devices have a potential to enable ubiquitous
breathing rate monitoring by continuously monitor-
ing users and predicting health events in real time.
UWB based system have limitations in terms of the
coverage area and the user’s position and orienta-
tion. However, with the availability of commod-
ity UWB devices such as Walabot (Walabot, 2020),
it is important to understand those limitations. We
Buckingham, N. and Gra
ˇ
canin, D.
Ultra-Wideband Radar Detection of Breathing Rate: A Comparative Evaluation.
DOI: 10.5220/0010346906770684
In Proceedings of the 14th International Joint Conference on Biomedical Engineering Systems and Technologies (BIOSTEC 2021) - Volume 5: HEALTHINF, pages 677-684
ISBN: 978-989-758-490-9
Copyright
c
2021 by SCITEPRESS – Science and Technology Publications, Lda. All rights reserved
677

have conducted a comparative evaluation of Walabot
and a medical grade contact breathing rate monitor
(MindWare Mobile Impedance Cardiograph (Mind-
Ware Technologies LTD, 2013)) using 4 procedures:
breathing rate variation, horizontal placement vari-
ation, vertical placement variation and user move-
ment variation. The results support feasibility of Wal-
abot as a commodity breathing rate monitor for health
monitoring in homes.
2 RELATED WORK
Breathing, or respiration, is a vital mechanism that all
humans perform subconsciously in which air circu-
lates in and out of the lungs, in order to provide oxy-
gen to the body. The rate and volume of air moved
is controlled by the respiratory pacemaker, which is
located in the medulla of the brainstem.
Tidal volume is the volume of air intake dur-
ing inspiration. Typical tidal volume is dependent
on the individual but a volume of 400–500 mL is
considered healthy (Hallett and Ashurst., 2019). In
healthy adults, tidal volume is quite consistent be-
tween breaths, but infrequent changes in air intake
due to yawns or signs are considered normal. Tidal
volume may also change in situations where breath-
ing rate changes, such as exercise (Braun, 1990).
Respiration devices typically measure breathing
rate and tidal volume. Breathing (respiration) rate is
number of breaths per minute (bpm). Typical resting
breathing rate varies per person but a rate of 12-20
bpm for an adult is considered normal, whereas a rest-
ing rate over 25 or under 12 is considered unhealthy.
Various health conditions affect resting breathing rate,
such as asthma, anxiety, pneumonia, congestive heart
failure and lung disease (Cleveland Clinic, 2019).
Changes in breathing rate in hospital patients is cor-
related with an increase in mortality rate.
One limitation of breathing rate is that the mea-
surement can be affected by the time over which is it
measured. Some studies extract breathing rate from a
shorter time, such as 15 seconds. However, this mea-
surement is subject to inaccuracy because breathing
rate can change between measurement periods due to
changes in air intake, as described in the last para-
graph. Studies have shown that the time period with
the least variability is one minute (Evans et al., 2001).
There are a variety of wearable medical devices on
the market and even more being developed and tested
currently. These devices appear as normal clothing or
accessory articles, but they consist of small sensors
that can read a variety of biometric data.
From a physiological perspective, breathing rate
offers a unique opportunity for wearable devices. In
contrast to heart rate, which is measured using inter-
nal signals, physical signals caused by breathing rate
can be recorded using audio, airflow or the low fre-
quency mechanical signal caused by small chest in-
flections (Furtak et al., 2013). These physical effects
have made breathing rate a popular subject of wear-
able device research.
Contactless monitoring of breathing rate is a novel
topic of research. Typical contactless methods use
thermal sensors, acoustic changes, lasers or radar.
Radar methods encompass techniques that utilize mi-
crowave or radio frequency (RF). Such methods rely
on the same idea: a stationary person’s breathing
rate matches the phase shifts of signals reflected off
the person (Lin, 1975). These methods are typically
categorized as continuous-wave (CW), frequency-
modulated continuous-wave (FMCW), impulse radar,
and ultra-wideband (UWB) (Br
¨
user et al., 2015).
3 METHODS
UWB radar emits a wide spectrum of low energy RF
that can be used to capture the low frequency mechan-
ical signal caused by small chest inflections during the
breathing cycle. Our goal is to investigate the follow-
ing question: “Can UWB radar be utilized to enable a
fully functional breathing rate monitoring system for
an active user in a confined SBE?”
For this work, we define a fully functional system
as one that derives accurate breathing rate data within
10% of the true breathing rate. Further, such a sys-
tem should maintain accuracy at all times in which the
user is present in the confined space and should not
be limited by user location, orientation or movement.
The specific area covered by the system is dependent
on the particular system but the minimum area should
cover a standard bedroom or living room. For the
scope of this work, the system will be restricted to
one user within range at a time.
The ideal system would collect breathing rate for
each user, detect distress events, alert the user’s con-
nected devices and even call for emergency help when
necessary. However, we focus on the breathing rate
detection system only. These potential functionalities
could be evaluated in future work on devices that are
deemed fully functional.
The reviewed UWB devices show promising re-
sults but are not considered fully functional because
they do not meet the requirements described above.
Specifically, these systems are vulnerable to noise or
limited by user. There are several important chal-
lenges to overcome. The details and severity of each
HEALTHINF 2021 - 14th International Conference on Health Informatics
678

Figure 1: Walabot coordinate systems: A)Walabot device
and its Cartesian coordinate system. B)Walabot antenna ar-
ray. C)Cartesian and spherical coordinate systems.
challenge is specific to the device and system design,
but the challenges for the current systems are:
1. Cost: They are expensive, thus not affordable for
an average household.
2. System Placement: Dependance on the place-
ment of the transmitter and receiver device(s).
3. Signal Processing: Deriving breathing rate from
the received signal is sensitive to noise.
4. User Location: The user has to be in particu-
lar locations relative to transmitter / receiver de-
vice(s).
5. User Orientation: The user has to be oriented
in particular angles relative to the transmitter and
receiver device(s).
6. User Movement: Increased sensitivity to noise or
inaccuracy when the user is moving.
3.1 Design
We conducted a comparative evaluation of Walabot
(Figure 1) and a medical grade contact breathing
rate monitor (MindWare Mobile Impedance Cardio-
graph (MindWare Technologies LTD, 2013)) to de-
termine feasibility of UWB devices for home health
monitoring systems. There are 6 design criteria.
1. Only one user can be in the designated space.
2. The user must use different breathing rates to test
the full range of possible breathing rates.
3. There must be at least one trial where the user
must remain still and there must be at least one
trial where the user must move.
4. The confined space should be approximately the
size of a standard living room or bedroom.
5. Walabot must be placed in a variety of locations
and orientations with respect to the user’s chest.
6. There must be at least one trial where the user sits,
stands and walks in place.
The main goal was to analyze the effectiveness
and limitations of a commodity UWB radar based de-
vice as a breathing rate monitoring system against a
medical grade wearable breathing rate monitor. The
secondary goal was to determine how well Walabot
meets the identified requirements. The steps are:
1. Analyze and discuss of the methodology used to
gather breathing rate provided by Walabot API.
2. Develop a breathing data acquisition for Walabot.
3. Develop a signal post processing script to com-
pute the breathing rate of data simultaneously
generated by Walabot and Mobile devices
4. Design a comparative evaluation to test the accu-
racy and limitations of Walabot.
5. Provide the comparative evaluation results and
discuss the accuracy and limitations of Walabot.
6. Discuss Walabot in the context of the posed re-
search question and challenges.
The research question and daily living emphasis
informed the first four design criteria. First: only one
user was involved in the data acquisition session due
to COVID-19 situation. Second: the user was told to
use the following breathing rates during different sets
of data acquisition: normal, deep and fast. To ensure
the deep and fast rates were within reason, the user
aimed to reach 8–12 bpm during deep breathing and
15–20 bpm during fast breathing. Third: the partic-
ipant was instructed to remain still for a set time and
to perform a predetermined movement for a set time
during the data acquisition session. The chosen posi-
tions and movement were specified in a later design
decision. Fourth: the participant and the device were
placed in a specified area, within the size of a stan-
dard living room or bedroom. This stems from the
assumption that the device would be placed in a com-
mon living area to be utilized frequently. A sketch
of the layout of the room can be seen in Figure 2 top
and a picture of the actual room is illustrated in Fig-
ure 2 bottom. The user was positioned 60 cm away
from Walabot along Z axis and the exact positioning
of Walabot was varied within this layout throughout
data acquisition.
4 EVALUATION RESULTS
The comparative evaluation was carefully designed in
such a way that allows for insight into both the re-
search question and the identified criteria. Addition-
ally, it was ensured that the testing setup should reflect
how the device would be theoretically used in a real
living space in order to make the data useful for real
world applications.
Ultra-Wideband Radar Detection of Breathing Rate: A Comparative Evaluation
679
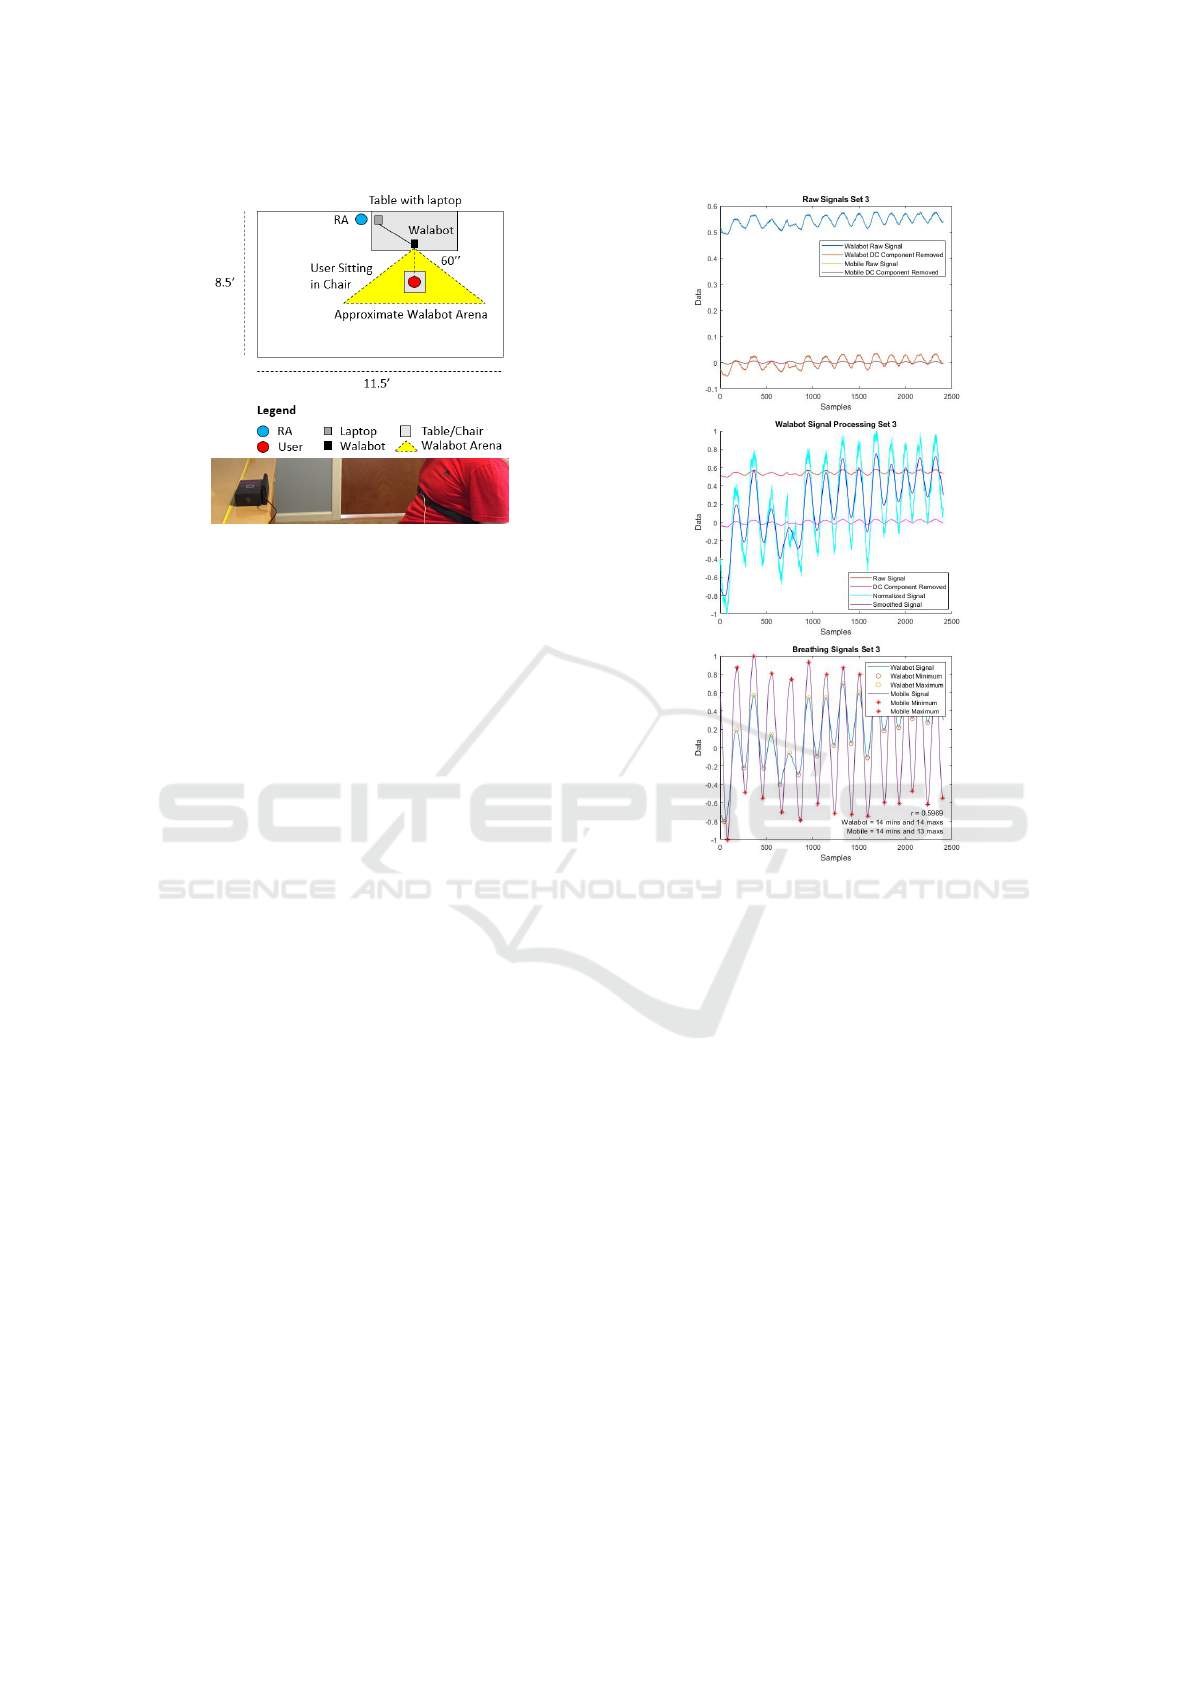
Figure 2: Top:A sketch of the testing setup. Bottom:A pic-
ture of the testing setup.
4.1 Raw Data Comparison
Walabot and Mobile data were aligned relative to set
number, time and frequency. However, there are two
important differences in Walabot and Mobile: magni-
tude and stability. The magnitude of the two signals
shouldn’t be directly compared. Mobile raw signal
does not have a significant DC component, whereas
Walabot has a large DC component (Figure 3 top).
Once the DC components are removed, the difference
in magnitude in the signals was clearly noticeable. To
eliminate the magnitude differences, the signals were
normalized signals between -1 and 1 for the best vi-
sual illustration of the signals. The shape should re-
semble the expected respiration sine wave form with
peaks and valleys according to inhaling and exhaling
respectively and the frequency should correspond to
the breathing rate.
With regards to stability, Walabot data is notice-
ably less stable than Mobile data. Kilani fixed this
issue by averaging the collected energy values over a
sliding window of 5 samples (Kilani, 2017). Instead,
this signal can be stabilized by smoothing. using a
sliding window. The effects of normalization and the
smoothing are shown in Figure 3 middle.
The simplest way to compare the data is to vi-
sually compare the shape of the graphs for each de-
vice. In an effort to quantify this comparison, we de-
termined the a correlation between the two signals.
However, the correlation coefficient is not a determi-
nation of signal accuracy because the concept of accu-
racy in this work is based on the breathing rate calcu-
lated from the signals. Further, the signals may have
a low correlation coefficient but both be highly ac-
curate. Instead, the number of extrema within each
signal is a good indication of what the breathing rate
calculation will be.
Figure 3: Top:An example of raw Walabot and Mobile sig-
nals. Middle:An example of the effects of normalization
and smoothing of Walabot signal. Bottom:An example of
processed Walabot and Mobile signals and their extrema
and their correlation coefficient.
An example of this signal comparison is shown in
Figure 3 bottom. The correlation coefficient is shown
in the bottom right hand corner of the graph. In this
example, the coefficient is 0.68. Visually, the signals
appear to have very similar frequencies and very sim-
ilar number of minimums and maximums between
Walabot and Mobile signals. The correlation coeffi-
cient is not 1 since the shapes of the two signals vary.
4.2 FFT Signal Analysis Technique
Extracting breathing rate from raw data is a complex
process that is still being researched today. In fact,
there are over 100 methods for extracting breathing
rate from ECG and PPG signals alone (Charlton et al.,
2016). Signal processing of radar data to find breath-
ing rate is a popular topic is research currently (Li
et al., 2016; Taheri and Sant’Anna, 2014). There
are many proposed extraction methods, but there is
no gold standard technique for Walabot at this point.
HEALTHINF 2021 - 14th International Conference on Health Informatics
680
As a starting point, we attempted to replicate the cal-
culation method used by Mobile. Specifically, Mo-
bile uses a low pass filter, then calculates a respiration
trend once per second using the FFT technique over a
sliding window of 5 seconds.
Next, the sliding window was defined. Initially,
the window was set as 5 times the f s value, or 5 sec-
onds, and also tested at 7 and 10 seconds.
During each iteration of the loop, a FFT was per-
formed on that window of the filtered data. Com-
monly, this is done in a sliding window to see
smaller time periods and to evaluate the changes over
time (Gunasekara, 2017).
The DFT was used to find the fundamental breath-
ing frequency. The data contains very few data points
which causes the resolution of the DFT to be very low
and the calculated breathing rate is not very accurate.
Spline interpolation was used to increase the resolu-
tion. The points before, on and after the max index
were cubically interpolated.
When the sliding window finishes, an extra filter-
ing step is performed to clean up the breathing rate
calculations. First, the first and last bpm calculations
are deleted. Then, any calculations below 6 or above
25 are deleted to disregard any values deemed unre-
alistic. These numbers were derived from the estima-
tion that the average breathing rate for a health adult
is between 12 and 20 bpm (Cleveland Clinic, 2019).
Then, the average breathing rate was
calculated throughout the set. The ac-
curacy of the average breathing rate is
100 ∗ (1 −
|Calculated bpm−User Reported bpm|
User Reported bpm
).
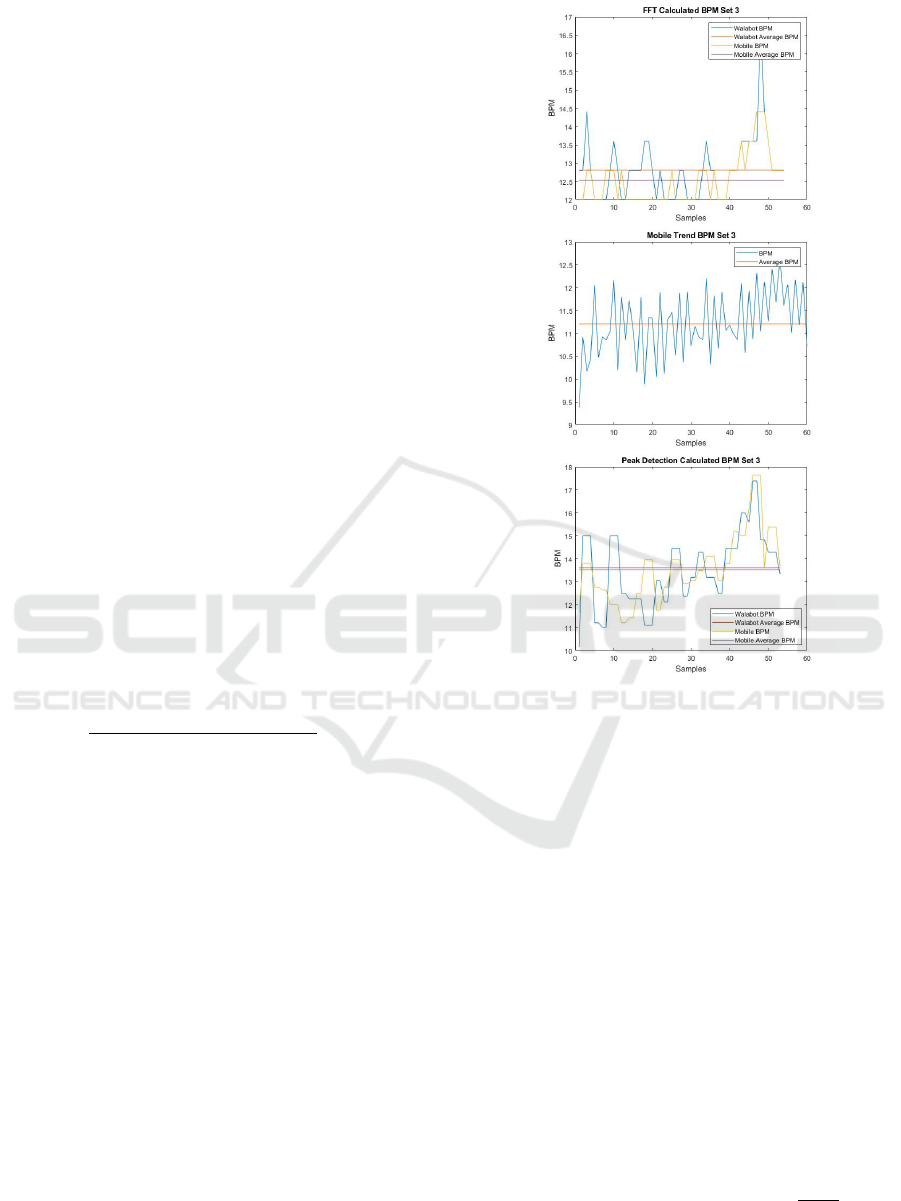
To illustrate the results, the calculated bpm and
the averages are shown (Figure 4 top). The average
breathing rate was 12.84 bpm for Walabot and 12.53
bpm for Mobile. The trends reported by Mobile for
the breathing rate is shown (Figure 4 middle). The
average reported breathing rate was 11.21 bpm.
The calculated average breathing rate for Mobile
data was 1.33 bpm above the reported average breath-
ing rate. The user counted roughly 13.5 bpm. The
reported breathing rate was not within 10%, while
the calculated breathing rates for Walabot and Mobile
were both within 10% (Figure 4 middle).
4.3 Peak Detection
We implemented a second breathing rate extraction
method. Yang et al. proposed the use of time-domain
peak detection in order to extract breathing rate within
a window of one breathing cycle, or 5 seconds. This
technique was tested with Doppler radar, an ECG and
a respiration band and yielded highly correlated re-
sults between the two contact sensors (Yang et al.,
Figure 4: Top: An example of bpm calculated from Wal-
abot and Mobile raw data using the FFT technique. Mid-
dle: An example of bpm provided by Mobile. Bottom: An
example of bpm calculated from Walabot and Mobile data
using the Peak Detection Technique.
2017). This test is quite similar to our work as it used
both radar and a respiration band. Additionally, this
technique was deemed a viable option based on visual
observation of our collected data.
We first implemented the same lowpass filter used
in the FFT technique. Yang et al. suggested the use
of a bandpass filter, but we used a lowpass filter to
maintain consistency between the post processing and
Mobile processing suggestions (Yang et al., 2017).
Next, the sliding window from the FFT technique
was implemented again. To fully test and compare
our processing techniques, windows with 5, 7 and 10
seconds were tested. For each window we located the
indices with the local minimum and maximum points.
The period was then calculated by doubling the time
between the minimum and maximum points. Finally,
the breathing rate was calculated as 60 ∗
f s
period
.
When the sliding window finishes, the extra filter-
ing step that was implemented in the FFT technique
Ultra-Wideband Radar Detection of Breathing Rate: A Comparative Evaluation
681
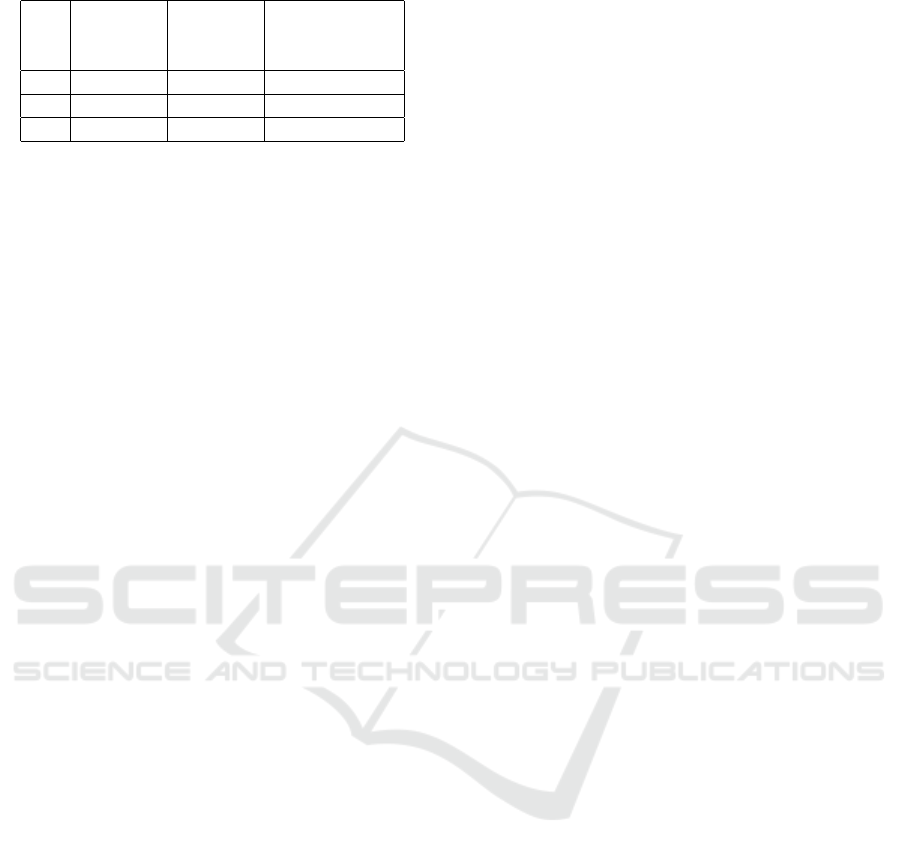
Table 1: Mobile reported bpm results.
Set User Mobile Mobile
Reported Reported Reported
bpm bpm bpm Accuracy
1 13 11.1502 85.77%
2 15 11.6261 77.51%
3 13.5 11.2050 83.00%
is used again here to clean up the breathing rate cal-
culations. Then the average breathing rate and cor-
responding accuracy’s are computed. This procedure
explained was used to calculate the breathing rate for
both Walabot and Mobile signals for each set. To il-
lustrate the results, the calculated bpms and the aver-
ages are shown (Figure 4 bottom). In this set, the aver-
age breathing rate for Walabot was found to be 13.38
bpm and the average breathing rate for Mobile was
13.68 bpm. With this extraction technique, the calcu-
lated breathing rate for Walabot and Mobile were both
correct within 10% of the user reported 13.5 breaths.
Further, this technique yielded breathing rate calcula-
tions with significantly higher accuracy than the FFT
calculations. Additionally, the trends reported for the
breathing rate of Mobile data are shown (Figure 4
middle). The average reported bpm is 11.21 bpm
for this data set which is not within 10% of the user
counted breaths of 13.5 bpm.
4.4 Accuracy Comparison
Three sets of data were taken on a 23 year old male.
During each set, the user was asked to breath nor-
mally. The user reported approximately 13, 15 and
13.5 bpm for sets 1, 2 and 3 respectively.
Another accuracy metric uses Mobile to Walabot
bpm ratio as percentage to compare the similarity of
the two calculations. When this value is within 10%
of 100%, the two calculations are considered statisti-
cally equivalent and this indicates high correlation of
signals and high stability of the associated breathing
rate derivation technique.
Table 1 shows the average Mobile reported breath-
ing rate and the respective accuracy’s. Prior to test-
ing, Mobile measured breathing rate was expected to
be the most accurate. However, the accuracy’s are
all significantly lower than 90%. Further, none of
the reported averages are within 10% of the expected
value. Due to this testing, Mobile reported breathing
rate values were not used in further testing.
Table 2 shows the FFT calculations using window
sizes of 5, 7 and 10. Calculations with a window size
of 5 seconds are within 10% of the expected value.
The calculations for Mobile data with a window size
of 7 and 10 seconds are within 10% of the expected
value. However, one calculation for Walabot with a
window size of 7 seconds and two calculations with
a window size of 10 seconds are not within 10% of
the expected value. The second set is only 55.24%
accurate when using a window size of 10 seconds.
This is an interesting observation given that increas-
ing the window size increases the resolution, which
was thought to improve the accuracy. The ratios are
within 10% for a window size of 5 seconds, but the
ratios are outside of the 10% bounds for larger win-
dows. Due to these results, a window size of 5 sec-
onds was used in further testing of the FFT technique.
Table 3 shows the Peak Detection technique results
using window sizes of 5, 7 and 10. All results are
within 10% of the expected value and the ratios are
all within 10%n. An interesting observation is that
the window size does not have a significant impact on
the accuracy of the calculation. In order to maintain
consistency with the FFT technique, a window size of
5 seconds was used in further testing.
5 DISCUSSION
The comparative evaluation is a necessary first step
to understand the accuracy and limitations of Walabot
breathing rate measurements. Six criteria were used:
cost, system placement, signal processing, user loca-
tion, user orientation, and user movement.
Cost: The least expensive version of Walabot is
less than $100 and is considered affordable for an av-
erage household as a health monitoring device.
System Placement: Walabot has an advantage
because the antennas are all located within the de-
vice (rather than having a separate transmitter and re-
ceiver), making it easy to deploy.
Signal Processing: Two breathing rate deriva-
tion techniques were used, FFT and Peak Detection.
The results were compared against the user reported
breathing rate (13, 15 and 13.5 bpm) to obtain an ac-
curacy measurement. A window size of 5 seconds
was chosen for both techniques because then all the
results were within 10%. During the breathing rate
variation procedure of the comparative evaluation, an
issue with the window size was uncovered. Essen-
tially, using a window size of 5 seconds is ideal for
breathing rates between 12 and 20 bpm, but this win-
dow size is too small for breathing rates lower than
12. This is caused by fact that the calculation tech-
niques require a window size of at least one breath to
accurately determine breathing rate, but less than one
breath is taken during a 5 second window when the
breathing rate is lower than 12 bpm.
When the window size was 10 seconds, the accu-
HEALTHINF 2021 - 14th International Conference on Health Informatics
682

Table 2: FFT technique results.
Set Window User Mobile Mobile Walabot Walabot Mobile to
Size Reported bpm bpm bpm bpm Walabot
bpm Calculation Accuracy Calculation Accuracy Ratio
1
5 13 12.37 95.16% 13.35 97.32% 92.66%
7 13 13.20 98.48% 11.70 90.03% 112.82%
10 13 12.06 92.75% 9.36 71.96% 128.85%
2
5 15 13.69 91.27% 13.99 93.28% 97.86%
7 15 16.49 90.04% 11.41 76.04% 144.52%
10 15 14.87 99.10% 8.29 55.24% 179.37%
3
5 13.5 12.53 92.84% 12.81 94.92% 97.81%
7 13.5 13.87 97.27% 13.74 98.25% 100.95%
10 13.5 12.85 95.18% 12.16 90.04% 105.67%
Table 3: Peak detection technique results.
Set Window User Mobile Mobile Walabot Walabot Mobile to
Size Reported bpm bpm bpm bpm Walabot
bpm Calculation Accuracy Calculation Accuracy Ratio
1
5 13 12.97 99.74% 13.26 97.97% 97.81%
7 13 12.99 99.91% 13.12 99.09% 99.01%
10 13 13.07 99.45% 13.27 97.93% 98.49%
2
5 15 15.05 99.68% 15.05 98.21% 100%
7 15 15.15 99.02% 14.89 99.25% 101.75%
10 15 15.25 98.33% 14.66 97.75% 104.02%
3
5 13.5 13.60 99.27% 13.51 99.94% 106.66%
7 13.5 13.59 99.36% 13.52 99.86% 100.52%
10 13.5 13.60 99.30% 13.51 99.96% 106.66%
racy for breathing rate lower than 12 bpm increased.
However, increasing the window size decreases the
accuracy of calculations during sets with breathing
rates above 12 bpm. The original window size of 5
seconds was used for the rest of testing during the
comparative evaluation. Adding a window size ad-
justment capability could improve the accuracy of the
calculations for any breathing rate.
User Location: Walabot is expected to be func-
tional whenever a user is within the Arena specified
within the data acquisition software by the values of
R, φ and θ. This allowed for the simplification of the
location challenge because the R range could simply
be set based on the user’s locations during the study.
Specifically, the range of R in the Arena was set as 20
to 80 cm because the user was always positioned 60
cm away from the device in Z direction. However, the
minimum value of R is 1 cm and the maximum value
is 1000 cm, which allows Z axis to be set such that it
covers a typical living room or bedroom.
User Orientation: The horizontal and verti-
cal placement variation procedures were followed.
Within each of these procedures, Walabot was an-
gled -45, -22.5, 0, 22.5 and 45 degrees away from the
user’s chest in the X or Y axis. The results showed
relatively high accuracy of breathing rate computed
by the FFT technique. The results for all locations
were all above 85% for both horizontal and vertical
testing when the reported breathing rate was above 12
bpm. The Peak Detection technique had quite low
accuracy. This suggest that the FFT technique can
provide a more accurate breathing rate when the user
is not located directly in front of Walabot. However,
these results were not all within 10% accuracy. Con-
sequently, Walabot coupled with the signal processing
techniques developed do not overcome the user orien-
tation challenge at this point. It is important to note
that the θ and φ values determine the cone shape of the
Arena in X and Y axes. For this work, the ranges for
both θ and φ were set as -1 to 1 because this allowed
for the highest sampling frequency. Further testing
should be done with higher θ and φ values to deter-
mine if the user orientation challenge is minimized
by a larger Arena size.
User Movement: The user stood against a wall,
in an open area and walked in place. Walabot signal
was very noisy during moving trials, which caused
the Peak Detection technique accuracy to drop below
90%. The FFT technique was able to accurately com-
pute breathing rate regardless of the user’s movement
Ultra-Wideband Radar Detection of Breathing Rate: A Comparative Evaluation
683

during the trials when the reported breathing rate was
above 12 bpm. This suggests that Walabot with the
FFT techniques overcomes the user movement chal-
lenge. Results from the horizontal, vertical and user
movement variation procedures revealed the high ac-
curacy and reliability of the FFT technique when the
reported breathing rate is above 12 bpm.
FFT technique yielded results with higher accu-
racy than the Peak Detection technique. The primary
reason for this is that the FFT method is not signifi-
cantly affected by the noise in the shape signal, while
the Peak Detection method is highly affected. For this
reason, the FFT method should be the primary focus
in future testing. However, the FFT technique is not
sufficiently robust at this point. An adjustable window
size can increase the accuracy of the FFT technique.
6 CONCLUSIONS
The development of a robust and fully functional
UWB radar based system has the potential to pro-
vide accurate monitoring of breathing rate. However,
current UWB radar based systems have issues which
hinder their accuracy or reliability. Six criteria were
identified: cost, user location, user orientation, user
movement, system placement and signal processing.
We designed and performed a comparative evaluation
in which data was collected by following four proce-
dures: breathing rate variation, horizontal placement
variation, vertical placement variation and user move-
ment variation. Results from this study were promis-
ing and suggested a high potential for Walabot cou-
pled with the FFT technique. Specifically, it was de-
termined that this system meets the cost, user loca-
tion, and system placement criteria. However, further
testing is required to determine if the system can fully
meet the user orientation, user movement and signal
processing criteria. The results support feasibility of
Walabot as a commodity breathing rate monitor for
health monitoring in homes.
REFERENCES
Braun, S. R. (1990). Respiratory rate and pattern. In Walker,
H. K., Hall, W. D., and Hurst, J. W., editors, Clinical
Methods: The History, Physical, and Laboratory Ex-
aminations, chapter 43, pages 226–230. Butterworths,
Boston, 3 edition.
Br
¨
user, C., Antink, C. H., Wartzek, T., Walter, M., and
Leonhardt, S. (2015). Ambient and unobtrusive car-
diorespiratory monitoring techniques. IEEE Reviews
in Biomedical Engineering, 8:30–43.
Charlton, P. H., Bonnici, T., Tarassenko, L., Clifton, D. A.,
Beale, R., and Watkinson, P. J. (2016). An assessment
of algorithms to estimate respiratory rate from the
electrocardiogram and photoplethysmogram. Physi-
ological Measurement, 37(4):610–626.
Cleveland Clinic (2019). Vital signs. https://my.cleve
landclinic.org/health/articles/10881-vital-signs. [last
accessed 17 December 2020].
Cretikos, M. A., Bellomo, R., Hillman, K., Chen, J., Finfer,
S., and Flabouris, A. (2008). Respiratory rate: the
neglected vital sign. The Medical Journal of Australia,
188:657–659.
Evans, D., Hodgkinson, B., and Berry, J. (2001). Vital signs
in hospital patients: a systematic review. International
Journal of Nursing Studies, 38(6):643–650.
Furtak, N. T., Skrzetuska, E., and Krucinska, I. (2013).
Development of screen-printed breathing rate sensors.
Fibres and Textiles in Eastern Europe, 21(6):84–88.
Gunasekara, A. (2017). Contactless estimation of breath-
ing rate using UWB radar. Master’s thesis, School of
Electrical Engineering and Computer Science Univer-
sity of Ottawa. [last accessed 17 December 2020].
Hallett, S. and Ashurst., J. V. (2019). Physiology, Tidal Vol-
ume. StatPearls Publishing, Treasure Island, FL.
Kilani, R. (2017). Testing the viability of Wal-
abot for breathing detection. https://www.
hackster.io/Ruleof2/testing-the-viability-of-walabot-
for-breathing-detection-b0a14f. [Last accessed 17
December 2020].
Li, W., Tan, B., and Piechocki, R. J. (2016). Non-contact
breathing detection using passive radar. In IEEE Inter-
national Conference on Communications, pages 1–6,
Kuala Lumpur, Malaysia.
Lin, J. C. (1975). Noninvasive microwave measurement of
respiration. Proceedings of the IEEE, 63(10):1530-
1530
MindWare Technologies LTD (2013). Mindware mobile
impedance cardiograph product manual. http://
downloads.mindwaretech.com/Hardware/MindWare
Mobile Impedance Cardiograph 1.0.0-1 Manual.pdf.
[Last accessed 17 December 2020].
Taheri, T. and Sant’Anna, A. (2014). Non-invasive breath-
ing rate detection using a very low power ultra-wide-
band radar. In IEEE International Conference on
Bioinformatics and Biomedicine, pages 78–83.
Tasooji, R., Dasgupta, A., Gra
ˇ
canin, D., LaGro, M., and
Matkovi
´
c, K. (2018). A multi-purpose IoT framework
for smart built environments. In Rabe, M., Juan, A. A.,
Mustafee, N., Skoogh, A., Jain, S., and Johansson,
B., editors, Proceedings of the 2018 Winter Simula-
tion Conference, pages 4240–4241.
Walabot (2020). Walabot DIY. https://walabot.com/diy.
[Last accessed 17 December 2020].
Yang, X., Sun, G., and Ishibashi, K. (2017). Non-contact
acquisition of respiration and heart rates using doppler
radar with time domain peak-detection algorithm. In
2017 39th Annual International Conference of the
IEEE Engineering in Medicine and Biology Society
(EMBC), pages 2847–2850.
HEALTHINF 2021 - 14th International Conference on Health Informatics
684
