
Front-end Design Optimization for Ionoacoustic 200 MeV Protons
Beam Monitoring with Sub-millimeter Precision for Hadron Therapy
Applications
Elia Arturo Vallicelli
1,2 a
, Mattia Oliver Cosmi
1
, Andrea Baschirotto
1,2 b
and
Marcello De Matteis
1,2 c
1
Department of Physics, University of Milano, Bicocca, Milan, Italy
2
Italian Institute for Nuclear Physics (INFN), Section of Milano, Bicocca, Milan, Italy
Keywords: Nuclear Imaging, Particle Accelerator, Particle Beam Measurements, Acoustic Waves, Analog Circuits,
Digital Circuits.
Abstract: This paper presents the design of a multichannel acoustic detector optimized for sensing proton induced
thermo-acoustic signals (ionoacoustic signals) in clinical scenarios experiments. Ionoacoustics is a promising
technique for real-time monitoring of proton beams with interesting possible applications in oncological
hadron therapy. However, clinical scenarios are characterized by very low signal amplitudes (few tens
millipascals). State-of-the-art experiments use general purpose acoustic sensors and heavily rely on averaging
(up to thousands beam shots) to detect a clear signal, at the cost of a significant extra-dose above clinical
limits. To overcome this limit, this paper presents the design of a dedicated acoustic sensor that exploits spatial
correlation (multichannel sensor) to increase the SNR with no extra-dose and localize the maximum energy
deposition of a 200 MeV proton beam in clinical scenarios (35 mGy/shot dose, 25 mPa signal amplitude).
The results are validated by a complete cross-domain simulation of the physical (proton beam), acoustic (wave
propagation) and electrical (sensor and electronics frequency response and noise) environments. The
presented detector achieves a clear 20.5 dB single-shot SNR (35 mGy total dose) and can localize the
maximum energy deposition with 0.5 mm precision (<1% w.r.t. the particle range) with ~1/100 dose reduction
compared to state-of-the-art.
1 INTRODUCTION
Charged particles interact with matter by depositing
energy along their path until they fully stop at the end
of their range (Knoll, 2000). However, the energy
deposition is not homogeneous, but it follows the so-
called Bragg curve (shown in Fig. 1), with the highest
dose deposition (defined as deposited energy per unit
mass of the absorber) occurring at a certain depth
within the target material corresponding to the Bragg
Peak (BP). Moreover, very limited doses are
deposited in the pre-Bragg and post-Bragg region.
This particular feature is exploited in hadron therapy,
an oncological treatment that uses beams of charged
particles (mainly protons and carbon ions) to deliver
high radiation doses in very specific volumes inside a
a
https://orcid.org/0000-0003-0905-151X
b
https://orcid.org/0000-0002-8844-5754
c
https://orcid.org/0000-0003-1061-1262
patient, corresponding to the tumor location (Parodi,
2018; Min, 2006; Hueso-González, 2018; Mirandola,
2015). This allows to damage the tumor cells while
preserving the surrounding healthy tissue, with a
much-localized dose deposition compared to
traditional X-ray based radiation therapy. Given the
high selectivity of the dose deposition, measurement
techniques are required to verify during or just after
the treatment that the dose has been deposited within
the target volume and thus all the tumor tissue has
been treated. This is usually done by means of nuclear
imaging techniques (Position Emission Tomography
or prompt gamma ray imaging) that however require
bulky and expensive detectors and have intrinsically
limited precision of new millimeters.
Vallicelli, E., Cosmi, M., Baschirotto, A. and De Matteis, M.
Front-end Design Optimization for Ionoacoustic 200 MeV Protons Beam Monitoring with Sub-millimeter Precision for Hadron Therapy Applications.
DOI: 10.5220/0010346600770087
In Proceedings of the 14th International Joint Conference on Biomedical Engineering Systems and Technologies (BIOSTEC 2021) - Volume 1: BIODEVICES, pages 77-87
ISBN: 978-989-758-490-9
Copyright
c
2021 by SCITEPRESS – Science and Technology Publications, Lda. All rights reserved
77
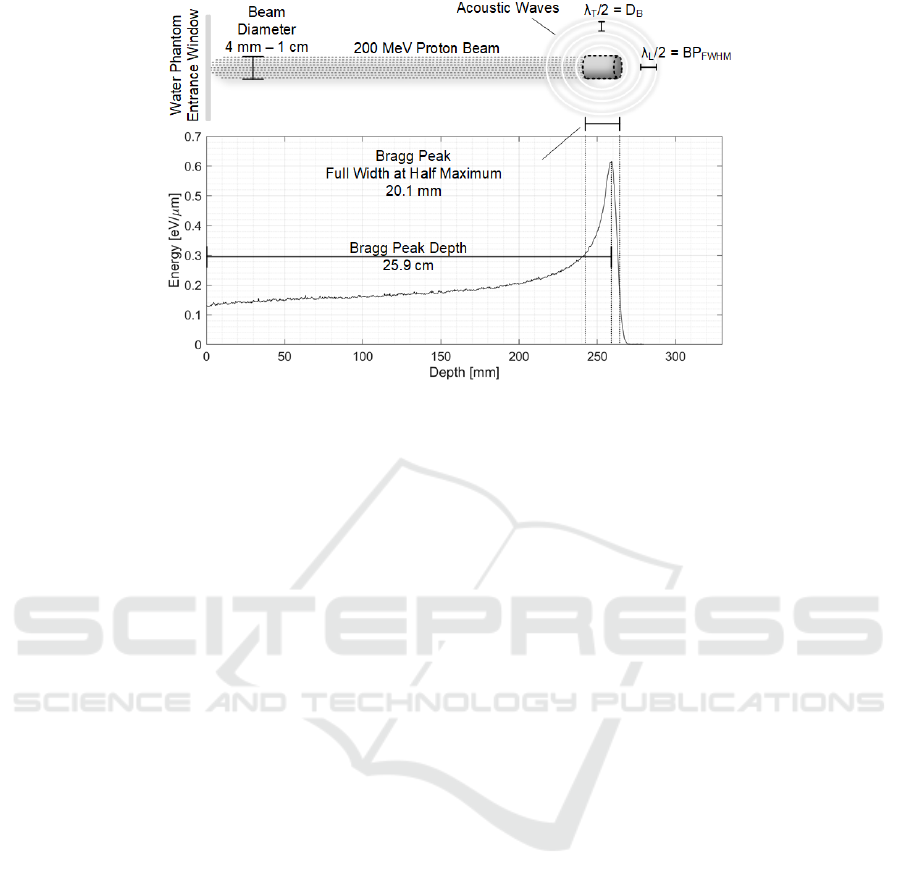
Figure 1: Bragg curve for 200 MeV Protons and ionoacoustic signal source at the Bragg Peak.
An interesting alternative Bragg Peak localization
technique based on the ionoacoustic effect has been
proposed by Sulak in 1979 (Sulak, 1979). The
ionoacoustic effect is the generation of an acoustic
wave from the fast and localized energy deposition
occurring at the BP. Such acoustic wave can be
acquired by a set of acoustic sensors (AS) to precisely
localize the BP in space. The Time of Flight (ToF) of
the acoustic wave travelling from the BP to the AS
can be measured and thus the distance between the
BP and the AS can be calculated, localizing the BP in
space. Such technique requires a simpler detector and
has proved sub-mm precision at pre-clinical and
clinical energies. Hayakawa acquired a clear acoustic
signal during an hepatic cancer treatment in 1995,
whereas more recently sub-mm precision has been
achieved using water phantoms by various
experiments at clinical energies (Hayakawa, 1995;
Assmann, 2015; Lehrack, 2020; Patch, 2016; Jones,
2016).
However, state of the art experiments use off-the-
shelf general purpose detectors (acoustic sensors and
electronics) that limit the measurement performance,
as shown in (Riva, 2018; Vallicelli, 2019; Vallicelli,
2020; Samir, 1979). To improve the Signal-to-Noise
Ratio (SNR), state of the art heavily relies on post-
processing (in the form of averaging up to 1000
different beam shots). However, this SNR
improvement comes at the cost of an extra-dose (that
would be delivered to the patient in clinical
applications) that exceed clinical limits, effectively
preventing this technique to be applied in clinical
scenarios (Vallicelli, 2020).
To overcome this limitation, this work proposes a
different approach to improve the SNR without
introducing extra-dose. Instead of temporal averaging
(i.e. averaging of multiple beam shots), the concept of
spatial averaging is presented, in the form of
averaging the signals acquired by different acoustic
sensors. Multichannel acoustic sensors (MAS) are
composed by N
ch
independent acoustic sensors
(channels), whose outputs are sensed simultaneously
by N
ch
different acoustic sensors. Effectively, for each
beam shots, N
ch
different signals are acquired and can
be averaged to improve the SNR without any extra
dose compared to a single-channel AS approach, that
would require Nch different beam shots (and thus N
ch
times the dose) to achieve the same SNR increase.
Nevertheless, this multichannel approach requires
a dedicated sensor and analog front-end design and
cannot rely on off-the-shelf components. For this
reason, this paper presents the design and
characterization of a detector (called High-Energy
Proton Sound Detector, HE-ProSD) that can localize
the BP in space with sub-mm precision in a clinical
scenario characterized by a 200 MeV proton beam
delivering 10 mGy/shot dose at the BP and generating
a 1 Pa acoustic signal at the BP and 23 mPa amplitude
at the sensor surface, located 7.5 cm away from the
BP. Such characteristics are typical of ionoacoustic
experiments at clinical energies such as (Assmann,
2015) and (Jones, 2016).
This work is organized as follows. Section II presents
the main characteristics of the 200 MeV experimental
scenario. Section III presents the AS and AFE design
that will be characterized by extensive cross-domain
simulations whose results are presented in Section IV.
Finally, in Section V these results will be discussed,
and conclusions will be drawn.
BIODEVICES 2021 - 14th International Conference on Biomedical Electronics and Devices
78
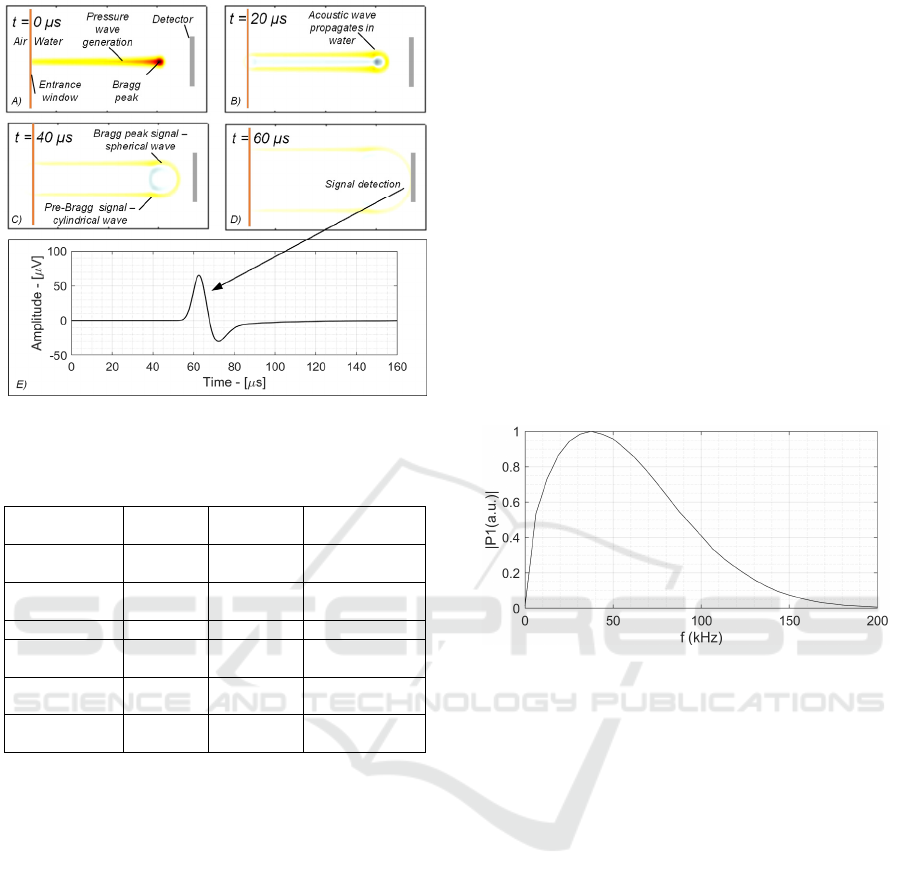
Figure 2: Ionoacoustic signal propagation and sensing.
Table 1: Characteristics of pre-clinical and clinical
scenarios.
Proton
Energy
20 MeV 65 MeV 200 MeV
Protons per
shot
10
6
10
6
10
6
Beam range
in water
4.1 mm 38 mm 259 mm
BP
FWHM
0.3 mm 2.9 mm 19.2 mm
Dose/shot at
BP
800
mGy/sho
t
100
mGy/sho
t
35 mGy/shot
Pressure at
BP
80 Pa 10 Pa 3.5 Pa
Pressure at
AS
5 Pa 300 mPa 25 Pa
2 200 MeV PROTONS
EXPERIMENTAL SCENARIO
Ionoacoustic experiments become more critical when
the beam energy increases because the dose deposited
at the BP will be increasingly lower and this results in
a weaker pressure signal.
Whereas sub-clinical experiments at 20 MeV
energy are characterized by tens or hundreds of Pa at
the BP, this value decreases to around 5 Pa at 65 MeV
(lowest energy for clinical applications) and around 1
Pa for 200 MeV (highest energy for clinical
applications). A brief comparison between pre-
clinical and clinical scenarios is presented in Table 1.
In this work a 200 MeV proton beam scenario has
been chosen because it represents the most critical
scenario for ionoacoustic signal sensing and is
therefore the most interesting to show the capability
of the spatial averaging approach. 200 MeV protons
are characterized by a high penetration and a low
dose, which gives rise to a weak and low frequency
acoustic signal, two characteristics that make it
difficult to use them for localization of the Bragg
peak. More precisely, the BP is at 25.9 cm depth in a
water phantom and the ionoacoustic signal (at 7.5 cm
from the BP in the axial direction) has an amplitude
of 25 mPa and a frequency spectrum that peaks at 40
kHz, as reported in (Assmann, 2015) and (Jones,
2016). Fig. 2 shows the typical ionoacoustic
experimental setup. The proton beam enters in the
water tank passing through a Kapton entrance
window and deposits energy following the Bragg
curve, that generates a correspondingly increase in
pressure (acoustic source) highlighted in yellow-red
in Fig. 2.A, where red indicates a higher dose and
pressure, whereas yellow indicates a lower dose and
pressure variation.
Figure 3: 200 MeV protons ionoacoustic signal spectrum.
The pressure wave propagates in water (Fig. 2.B
and C shown 20 μs and 40 μs after the beam shot
respectively) and reaches the detector surface after
around 60 μs, as shown in Fig. 2.D, where it is
transduced in voltage domain, as represented in Fig.
2.E. With reference to Fig. 2.C, two different acoustic
signals can be observed, one originated in the BP that
propagates spherically and can be used for BP
localization and one other in the pre-Bragg region,
that propagates as a cylindrical wave mostly
perpendicular to the beam axis.
This scenario has been completely modelled using
Geant4 to estimate the energy deposition profile, k-
Wave to simulate the pressure wave propagation in
space (Fig. 2) and Matlab to model the AS and AFE
in terms of frequency response and noise power.
The acoustic signal spectrum is shown in Fig. 3
and peaks below 40 kHz, as shown in (Assmann,
2015) and (Jones, 2016).
Front-end Design Optimization for Ionoacoustic 200 MeV Protons Beam Monitoring with Sub-millimeter Precision for Hadron Therapy
Applications
79
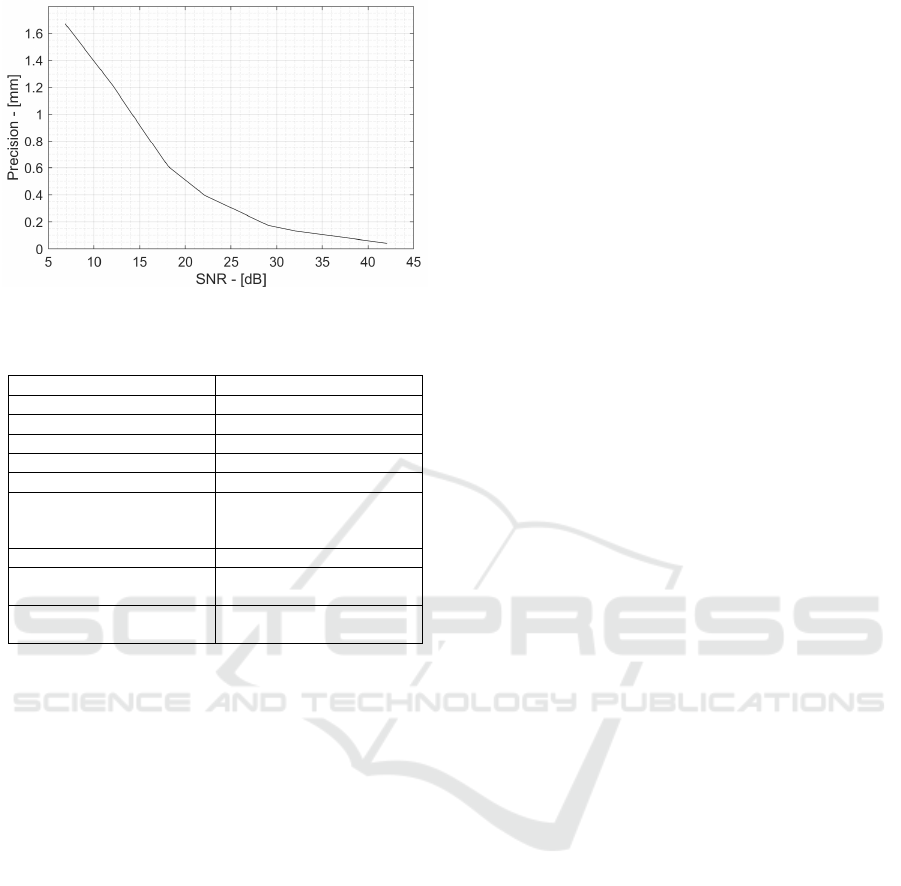
Figure 4: Precision vs SNR.
Table 2: HE-ProSD Performance Requirements.
Parameter Value
Beam Energy 200 MeV protons
Dose/shot @ Bragg peak 35 mGy
Acoustic Signal Bandwidth 40 kHz
Signal amplitude 25 mPa
0-
p
ea
k
Desired Precision 0.5 mm
Required HE-ProSD SNR
(SNR
HE-ProSD
) for 0.5 mm
precision
20 dB
AFE Noise Figure (NF
AFE
) 1 dB
Directivity Noise Figure
(NF
DIR
)
1 dB
Acoustic Sensor SNR
(SNR
AS
)
22 dB
Finally, the BP-AS distance (d
BP-AS
) can be
calculated by measuring the acoustic wave time of
flight (ToF) and applying equation (1), where c
w
is
the sound speed in water, equal to 1498 m/s at 23°C.
𝑑
=𝑇𝑜𝐹∙𝑐
(1)
To determine the localization precision, the
distance d
BP-AS
has been repeatedly measured 1000
times with different noise realizations. Random noise
fluctuations shift the measured position in space, thus
introducing a random error with a standard deviation
equal to the localization precision. Repeating the
measurements 1000 times (with the same SNR but
different noise realization) guarantees a good statistic
and an accurate measurement precision evaluation.
3 HIGH-ENERGY PROTON
SOUND DETECTOR DESIGN
3.1 HE-ProSD Design Requirements
The first step in the HE-ProSD design is to define the
specifications to be met. The desired localization
precision has been set to 0.5 mm.
The relationship between SNR and measurement
precision was obtained by measuring the precision as
described in Section II, obtaining the d
BP-AS
precision
at different SNR values. The results are shown in Fig.
4. To achieve sub-mm precision a minimum 14 dB
SNR is required, whereas to obtain the desired 0.5 mm
precision the detector SNR needs to be as high as 20
dB. However, this SNR value has to be achieved at the
detector output, including AS and AFE noise power
and acoustic sensor non-idealities that will be
described in the next section. For this reason, the
acoustic sensor SNR (SNR
AS
) must be larger than the
final required detector SNR (SNR
HE-ProSD
, 22 dB)
because it degrades due to the analog front-end noise
power and acoustic sensor BP-AS misalignments
(caused by non-ideal AS directivity). These factors
cause an SNR loss that require the the SNR
AS
to be
higher than the final SNR
HE-ProSD
by an amount equal
to the AFE Noise Figure (NF
AFE
) and the AS directivity
Noise Figure (NF
DIR
), following equation (2).
𝑆𝑁𝑅
=𝑆𝑁𝑅
−𝑁𝐹
−𝑁𝐹
(2)
At this point, a NF
AFE
and NF
DIR
budget can be
assigned to the AFE, equal to 1 dB each, thus bringing
the final SNR
AS
requirement to 22 dB. Considering a
25 mPa signal amplitude, such SNR
AS
value
corresponds to an input referred sensor noise power
of 1.4 mPa
RMS
.
Effectively, this first design step determines the
performance requirements for the AS, which are
listed in Table 2.
Each channel of the MAS needs to fulfill different
requirements:
The AS resonance frequency needs to match the
40 kHz signal bandwidth;
The single-channel Output-Referred Noise Power
(ORN) must be high enough so that the AFE noise
requirements imposed by the 1 dB NFAFE can be
met;
The single channel sensor must be able to acquire
signals coming from different directions limiting
their attenuation to that imposed by the NF.
The design of a single channel that meets the
requirements of bandwidth, noise and directivity will
be presented first. Then the number of channels
necessary to obtain the required SNR
AS
value (22 dB)
through spatial averaging will be determined.
BIODEVICES 2021 - 14th International Conference on Biomedical Electronics and Devices
80
Figure 5: Acoustic Sensor frequency response.
Figure 6: Single element acoustic sensor scheme.
Table 3: PIC255 PZT piezoelectric parameters.
Parameter Symbol Value
Frequency Coefficient Nf 40 kHz
Relative permittivity ε
0
1750
Piezoelectric voltage
coefficient
g
33
25·10
-3
V/(Pa·m)
Piezoelectric thickness Th 51 mm
PIC255 Acoustic
Impedance
Z
2
33 MRayl
Matching Layer
acoustic impedance
Z
1
7 MRayl
3.2 Frequency Response and
Sensitivity
Ionoacoustic signals are typically sensed by
piezoelectric sensors that transduce pressure
variations into voltage variations. Piezoelectric
sensors have a frequency response characterized by a
passband and a resonance frequency, as shown in Fig.
5. The sensor has its maximum sensitivity at the
resonant frequency, and it decreases by about 10 dB
in the linear part of the frequency response. Lead-
Zirconate-Titanate are among the most performing
materials commercially available for such
applications.
Figure 7: Acoustic impedance mismatch effects.
This section will refer to the PIC255 PZT
produced by PiCeramics, whose characteristic
parameters are listed in Table 3. The resonance
frequency depends on the frequency coefficient N
(2000 Hz·m) and on the thickness TH of the
piezoelectric according to equation (n) and as shown
in Figure 6.
𝑓
=
𝑁
𝑇ℎ
(3)
A resonant frequency of 40 kHz has been chosen in
this case to match the signal frequency. This sets the
piezoelectric thickness to 51 mm and allows to
calculate the sensitivity at resonance frequency using
equation (n), where g
33
is the piezoelectric voltage
coefficient, equal to 25 mV/(Pa·m):
𝑆
=𝑔
∙𝑇𝐻
(4)
Considering the 51 mm piezoelectric thickness,
the PZT sensitivity is 1.3 mV/Pa. However, this
sensitivity value is usually reduced to about 60-80%
due to the impedance mismatch between the water
(acoustic signal propagation medium) and the
piezoelectric material itself (Vallicelli, 2020; Samir,
1979). In fact, whenever an acoustic wave traveling
in one medium encounters another medium with
different mechanical properties, it is partly
transmitted and partly reflected, as shown
qualitatively in Figure 7. The transmission coefficient
ηT depends on the acoustic impedances of the
materials (defined as the product between density and
speed of sound in the medium) and is equal to:
𝜂
=
2𝑍
𝑍
𝑍
(5)
Water has an acoustic impedance of 1.5 MRayl,
very different from the 33 MRayl of the PZT, and
therefore in a direct interface between the two
materials only 40% is transmitted, causing a
corresponding loss of sensitivity.
Front-end Design Optimization for Ionoacoustic 200 MeV Protons Beam Monitoring with Sub-millimeter Precision for Hadron Therapy
Applications
81
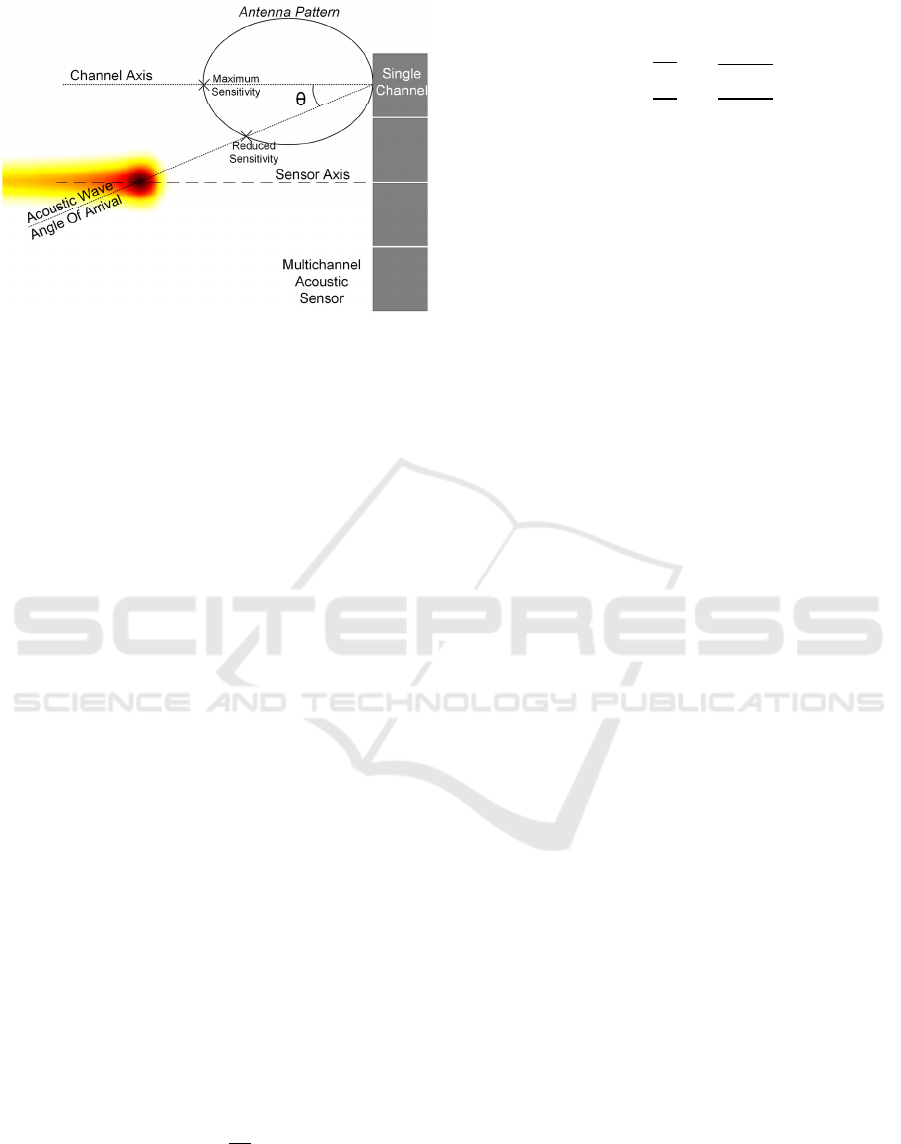
Figure 8: Sensitivity loss due to sensor directivity.
For this reason, an intermediate layer (called
matching layer) is placed between the water and the
piezoelectric to act as an impedance matching and
increase the amplitude of the transmitted wave. A
60% transmission coefficient can be achieved with a
matching material that have an acoustic impedance
equal to 7 MRayl. Typical materials with 7 MRayl are
silicone rubbers or araldite. Using multiple matching
layers of different materials, even higher transmission
coefficients can be obtained (Samir, 1979; Vallicelli,
2020). The overall sensitivity S (including
piezoelectric sensitivity S
PZT
and matching layer
effects) is therefore equal to:
𝑆=𝜂
∙𝑔
∙𝑇𝐻 (6)
The matching layer usually has a thickness equal
to a quarter-wavelength to further minimize the
reflected component of the acoustic wave. This leads
to a final AS sensitivity of 770 μV/Pa.
3.3 Sensor Capacitance and Noise
Power
Piezoelectrics are capacitive sensors and thus their
output referred noise power can be estimated equal to
kT/C. Their capacitance, and thus output referred
noise power, can be estimated from the formula for a
parallel-faced capacitor, where A is the piezoelectric
area, ε
0
and ε
r
are respectively the dielectric constants
of the vacuum (value) and relative dielectric constant
of the piezoelectric material (value):
𝐶=𝜀
𝜀
𝐴
𝑇ℎ
(7)
Thus, the output-referred noise power of the
sensor channel is:
𝑂𝑅𝑁=
𝑘𝑇
𝐶
=
𝑘 𝑇 𝑇ℎ
𝜀
𝜀
𝐴
(8)
Effectively, all parameters of this equation are
determined except the sensor area, that can be sized
to fulfill the NF
AFE
requirement. In fact, the larger the
sensor area, the smaller its ORN will be and this will
force the AFE to have increasingly stringent noise
specifications to meet the NF
AFE
requirement. Ultra-
low noise AFE performances (<1 nV/√Hz Power
Spectral Density, PSD) can be reached using
monolithic transistors in JFET technology (Vallicelli,
2020), which however cannot be integrated into
standard CMOS technologies and therefore do not
meet the miniaturization requirements needed for
multi-channel sensors. On the other hand, standard
CMOS processes allow high miniaturization
(opening the possibility of multichannel sensor and
spatial averaging) while still achieving good noise
performances. An input-referred noise power spectral
density of 10 nV/Hz was assigned to the AFE,
corresponding to an integrated noise power in the
signal bandwidth equal to 2.5 uV
RMS
. Such AFE IRN
PSD is well within the possibilities of standard
CMOS processes.
Finally, to comply with the 1 dB NF
AFE
requirements, the ORN of the MAS single channel
must be equal to 5 μV
RMS
, corresponding to a 5.4 cm2
single channel area, or a square sensor with a side
length L of 2.3 cm. This sets the maximum area that
fulfills the NF
AFE
requirements.
3.4 Single Channel Directivity
Ideal acoustic sensors are omnidirectional, i.e. they
can acquire a signal regardless of its direction of
arrival. However, real acoustic sensors are
characterized by a certain amount of directivity, that
is, they attenuate signals arriving from directions
other than their axis, as shown in Figure 8. This
characteristic, for a given frequency of the acoustic
signal, depends on the difference between the width
of the acoustic sensor (L) and the wavelength. In
particular, if the acoustic sensor is small compared to
the wavelength it will behave almost ideally
(omnidirectional), while as its size increases it will
become more and more directive. Since the position
of the Bragg peak is not known a priori, each channel
cannot be previously oriented towards the BP.
BIODEVICES 2021 - 14th International Conference on Biomedical Electronics and Devices
82
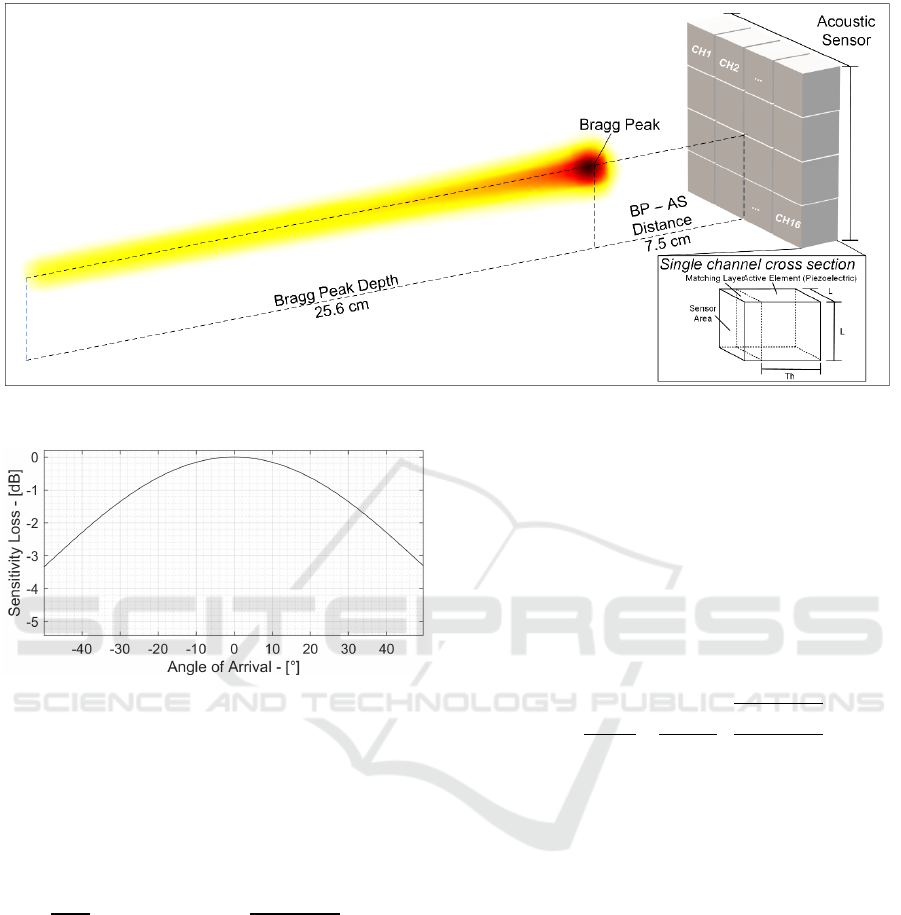
Figure 10: High-Energy Proton Sound Detector Scheme.
Figure 9: Single channel sensitivity loss due to its
directivity.
If the single channel element is very directive, it
will attenuate off-axis signals a lot, effectively
lowering the AS sensitivity and final SNR. The
directivity of a single channel element can be
determined using the Fraunhofer laws of diffraction.
𝑆
𝜃
𝑆
=𝑑𝑖𝑟
𝜃
=𝑠𝑖𝑛𝑐
𝜋𝑓𝐿𝑠𝑖𝑛
𝜃
𝑐
(9)
Considering a sensor with L = 2.3 cm, the overall
sensitivity loss due to directivity is shown in Figure
9. In particular, considering the 7.5 cm AS-BP
distance, the maximum angle to fulfil the 1 dB NF
DIR
specification is 25°, corresponding to a 3.5 cm off-
axis shift of the BP location w.r.t. the channel
element. This directivity loss is particularly relevant
in the case of multichannel sensors, because the
presence of different channels implies that some
channels are not perfectly aligned with the BP, thus
experiencing some loss due to their directivity. In this
case the 2.3 cm single channel size meets the
directivity requirement.
3.5 Multichannel Acoustic Sensor
Design
The single channel equivalent input referred noise
power can be calculated dividing the ORN by the AS
sensitivity:
𝐼𝑅𝑁
=
𝑂𝑅𝑁
𝑆
=
1
𝜂
∙𝑔
𝑘𝑇
𝜀
𝜀
∙𝐴∙𝑇ℎ
(10)
Substituting the parameters found in the previous
sections, the single channel capacitance is 167 pF and
its input-referred noise power IRN
AS
is equal to 6.6
mPa
RMS
. Thus, the single channel SNR
1Ch
is 8.5 dB.
To achieve the desired 20 dB SNR, the spatial
averaging technique exploits signals sensed by N
ch
channels to improve the final SNR
Nch
as in Equation
11.
𝑆𝑁𝑅
ℎ
=𝑆𝑁𝑅
+10log
𝑁
(11)
Thus, 16 channels are necessary to meet the 20 dB
SNR
AS
requirement, achieving a total 12 dB increase
and a final 20.5 dB SNR
Nch
. These channels are
arranged in a 4x4 matrix to compose the HE-ProSD
as shown in Figure 10.
Front-end Design Optimization for Ionoacoustic 200 MeV Protons Beam Monitoring with Sub-millimeter Precision for Hadron Therapy
Applications
83
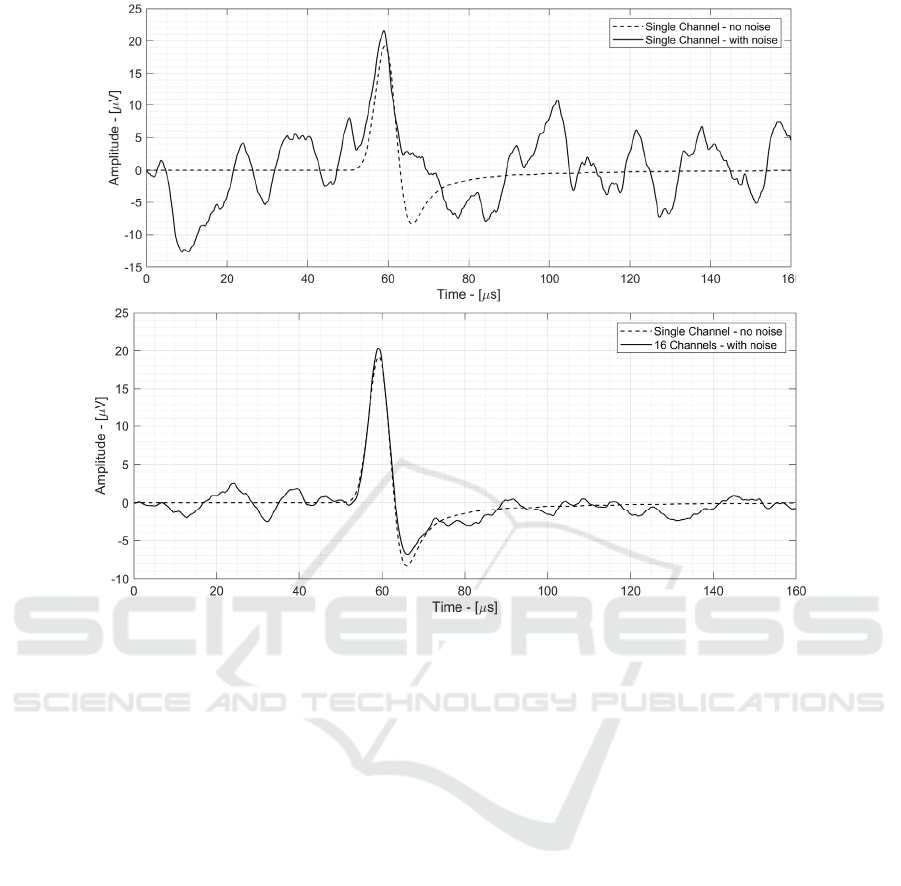
Figure 11: Top: Single channel signal including sensor and AFE noise power. Bottom: 16-channels spatial average signal
including sensors and AFE noise power.
4 HE-PROSD VALIDATION AND
SIMULATION RESULTS
To validate the design procedure presented in Section
III and to show how a dedicated sensor can improve
the localization performances, a sensor has been
designed for a specific experimental scenario present
in literature, represented by a 200 MeV proton beam
with a 35 mGy dose deposition per shot and 7.5 cm
sensor-BP distance, in a scenario equivalent to what
is found in literature.
The physical environment has been simulated
using Geant4 to extract the 3D dose deposition profile
and thus calculate the pressure increase spatial
distribution. k-Wave has then been used to simulate
the pressure wave propagation in space and to
determine the signal sensed by each channel of the
sensor. The pressure domain signals have been
transformed into voltage domain by multiplying for
the sensor sensitivity of 770 uV/Pa. Then the signal
has been band-passed to represent the sensor
frequency response (60 kHz -3dB frequency) and a
band-shaped thermal noise has been added. The
single channel SNR ranges from 0.4 dB (central
channels, closer to the BP) and 0.4 dB (external
channels, further away from the BP).
Two different HE-ProSD results are presented:
Single channel ToF measurement
16-channels ToF measurement
4.1 Single Channel Time of Flight
Measurement
Fig. 11 shows the single-channel signal including
sensor and AFE noise power, overlapped with the
same signal not including noise (dotted line). The
measured SNR is 8.7 dB, including sensor and AFE
noise power. Although the SNR is relatively low, the
ionoacoustic signal is recognizable and can be used to
calculate a ToF and thus localize the BP in space. By
repeating the ToF measurement with different noise
realization (with the same SNR value), a 1.5 mm
precision has been found.
BIODEVICES 2021 - 14th International Conference on Biomedical Electronics and Devices
84
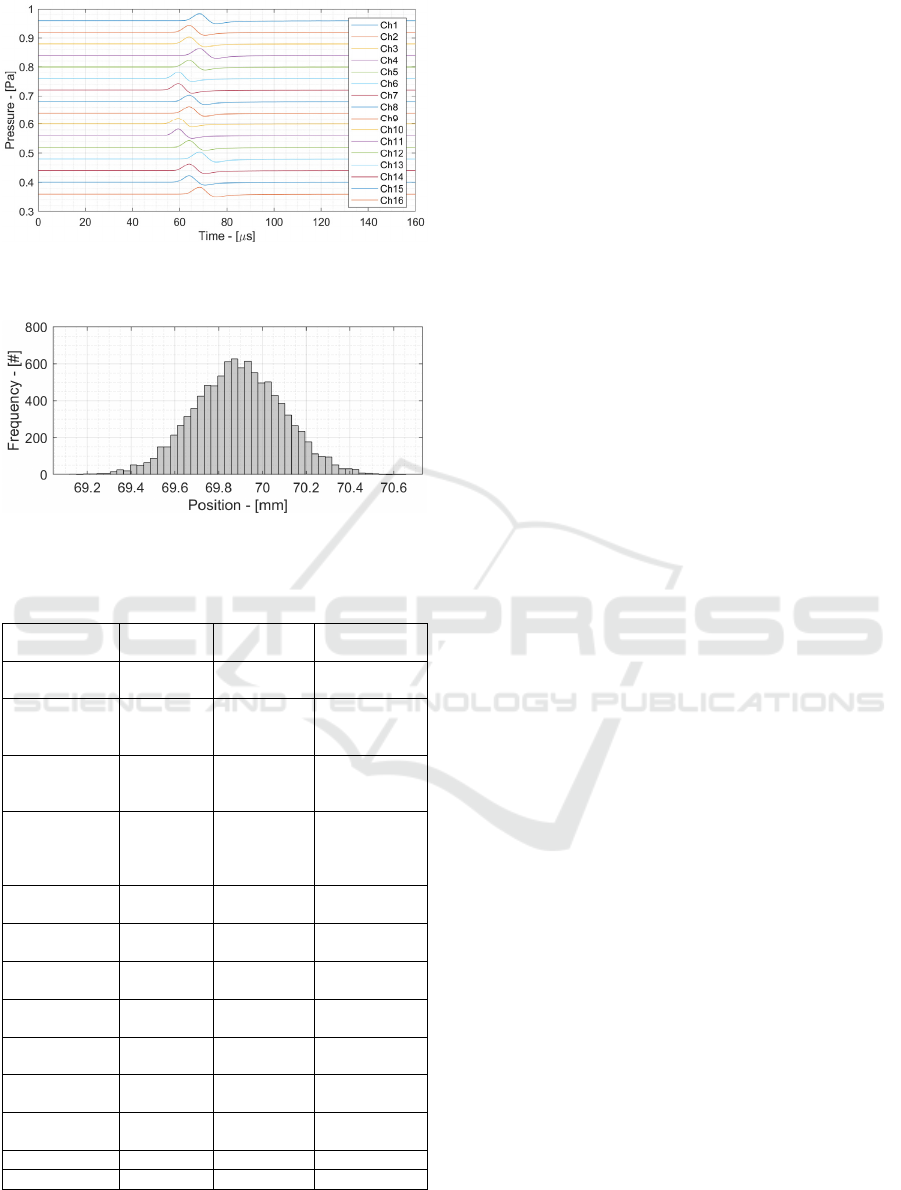
Figure 12: 16 Channels signals of HE-ProSD (without
noise).
Figure 13: Measured BP position (10k repetitions) obtained
by the 16-channels spatial average of the HE-ProSD.
Table 4: Comparison with state of the art.
This work Assmann,
2015
Jones, 2016
Proton
energy
200 MeV 200 MeV 200 MeV
Acoustic
Sensor
16-
channels
array
1 channel
hydrophone
1 channel
hydrophone
Acoustic
Sensor
Bandwidth
40 kHz 200 kHz 200 kHz
Analog
Front-End
Dedicated
Analog
Front-End
General
purpose
LNA and
oscilloscope
General
purpose LNA
and
oscilloscope
Detector
distance
7.5 cm 7.5 cm 5 cm
Detector
noise floor
1.8
mPa
RMS
n.a. 27 mPa
RMS
Signal
amplitude
25 mPa
0-
p
ea
k
2 mPa
0-peak
30 mPa
0-peak
SNR – single
shot
20.5 dB n.a. -2 dB
Precision –
single shot
0.5 mm n.a. n.a.
Dose - single
shot
35 mGy n.a. 35 mGy
Final
Precision
0.5 mm 0.34 mm 2.2 mm
Total Shots 1 1000 ~60
Total Dose 35 mGy 10 Gy 2 Gy
4.2 HE-ProSD Time of Flight
Measurement
Fig. 12 shows the 16 different signals acquired by the
16 channels of the HE-ProSD. A different offset has
been applied to each channel and noise has been
removed for ease of representation. Each channel
signal has a slightly different phase because the
distance between the acoustic source (BP) and the
channels are different, and consequently the ToF. To
apply the space-domain average, the 16 channels
have to be re-phased. A Delay and Sum (DAS)
algorithm has been applied and the output is shown in
Fig. 12. Compared to Fig. 11, the SNR has improved
thanks to spatial averaging, and is equal to 20.7 dB. It
is important to highlight that such SNR improvement
has been achieved with the same dose deposition as
the single-channel SNR.
To determine the localization precision, ToF
measurements have been performed with different
noise realization and the resulting BP position has
been shown in Fig. 14. The corresponding
localization precision is 0.5 mm, obtained with a total
35 mGy dose.
4.3 HE-ProSD Performance
Comparison with State of the Art
Table 4 shows a comparison between HE-ProSD
performance and state of the art experiments at 200
MeV protons. Although the HE-ProSD results are
obtained by simulations, all the most relevant noise
and non-idealities are included and the results show a
clear trend, that is that a dedicated detector design is
fundamental to significantly reduce the dose
necessary to achieve a given precision.
In fact, state of the art uses commercial single-
channel hydrophones, general-purpose amplifiers and
oscilloscopes, with the result of not optimizing SNR
performance (eg integrating noise on a much higher
band than that of the signal) in the digital domain and
of having to compensate by resorting to averages in
the digital domain. However, averaging is not an
efficient tool in increasing SNR as it reduces the noise
power according to sqrt (N
sh
), thus requiring a large
number of averages (and therefore extra-dose) to
significantly improve SNR. Indeed, while the noise
power decreases as sqrt (N
sh
), the dose increases
linearly with Nsh, resulting in a large extra-dose. In
comparison, using the spatial mean results in an
increase in SNR equal to sqrt (N
ch
) but without using
extra-dose. If the single channel of HE-ProSD were
used to obtain 0.5 mm of precision using the time
domain average, 16 shots of the beam would be
Front-end Design Optimization for Ionoacoustic 200 MeV Protons Beam Monitoring with Sub-millimeter Precision for Hadron Therapy
Applications
85

needed (instead of 16 channels), for a total dose of
about 0.5 Gy, of the same order of magnitude. of
(Assmann, 2015) and (Jones, 2016). Thanks to the
dedicated design, HE-ProSD allows to obtain 0.5 mm
of precision using a dose of 35 mGy, using
respectively 0.35% and 1.75% dose compared to
(Assmann, 2015) and (Jones, 2016).
5 DISCUSSION AND
CONCLUSIONS
This paper presents the design of a multi-channel
acoustic sensor that allows to locate with sub-
millimeter precision a beam of protons at 200 MeV at
doses compatible with those of clinical treatments.
Compared to the state of the art, this detector uses a
different approach, that is, it moves the SNR increase
from the digital domain (post-processing) to the
analog domain (detector improvement). This
approach exploits a dedicated design of a
multichannel acoustic sensor that allows to use the
average in the space domain instead of the time
domain, obtaining an increase of SNR without any
extra-dose. This detector, called High-Energy Proton
Sound Detector (HE-ProSD), has been validated with
cross domain simulations that include 3D deposition
of energy in space (Geant4), generation and
propagation of the acoustic signal up to the sensor.
Then, the sensor was fully modelled in mechanical
(resonant frequency, physical size), acoustic
(acoustic impedance and diffraction / directivity
matching) and electrical (sensor capacity, input and
output noise power) terms. Finally, an analog front-
end was modeled in terms of frequency response and
noise power and used to process the signal generated
by the multi-channel acoustic sensor. To evaluate the
performance of the HE-ProSD, the Bragg peak of a
proton beam at 200 MeV was localized and the
measurement was repeated with different noise
realizations (including both acoustic sensor and
electronics noise) and is An accuracy of 0.5 mm was
found for an acoustic signal of 25 mPa amplitude and
35 mGy of dose deposited at the Bragg peak. By
comparing these results with what has been obtained
from the state of the art (Assmann, 2015; Jones,
2016), a significant dose reduction was obtained with
the same localization precision. Although this work
includes only simulation results and an experimental
validation of the performance obtained is necessary,
it is clear that for a possible application of the
ionacoustic technique in clinical scenarios it is
necessary to move from off-the-shelf and general
purpose detectors to a dedicated design that exploits
the potential of multichannel sensors through the
development of integrated circuits front-ends to
achieve high SNR in the particularly critical clinical
scenarios (Baschirotto, 2009; De Matteis, 2006).
ACKNOWLEDGMENT
This work has been supported by the Proton Sound
Detector (ProSD) project funded by the Italian
Institute for Nuclear Physics (INFN).
REFERENCES
Glenn F. Knoll, “Radiation Sources,” in Radiation
detection and measurement, John Wiley & Sons, 2000,
ch. 1, pp. 1–28.
Parodi, Katia, and Jerimy C. Polf. "In vivo range
verification in particle therapy." Medical physics 45.11
(2018): e1036-e1050.
C. H. Min, C. H. Kim, M. Y. Youn, and J. W. Kim, “Prompt
gamma measurements for locating the dose falloff
region in the proton therapy,” Applied Physics Letters,
Vol. 89, no. 18, pp: 1-3, November 2006.
Hueso-González, F., Rabe, M., Ruggieri, T. A., Bortfeld,
T., & Verburg, J. M. (2018). A full-scale clinical
prototype for proton range verification using prompt
gamma-ray spectroscopy. Physics in Medicine &
Biology, 63(18), 185019.
A. Mirandola, S. Molinelli, G. Vilches Freixas, et al.,
“Dosimetric commissioning and quality assurance of
scanned ion beams at the Italian National Center for
Oncological Hadrontherapy,” Radiation measurement
physics, vol. 42, no. 9, pp. 5287-5300, September.
2015.
L. Sulak, T. Armstrong, H. Baranger, at al., "Experimental
studies of the acoustic signature of proton beams
traversing fluid media," Nuclear Instruments and
Methods Vol. 161, no. 2, Pages 203-217, May 1979.
Y. Hayakawa, J. Tada, N. Arai, et al. "Acoustic pulse
generated in a patient during treatment by pulsed proton
radiation beam." Radiation Oncology Investigations
Vol. 3, no.1, pp. 42-45, Jan. 1995.
W. Assmann, S. Kellnberger, S. Reinhardt, et al.,
“Ionoacoustic characterization of the proton Bragg
peak with sub-millimeter accuracy,” Medical Physics,
Vol. 42, no. 2, pp. 567-574, Feb 2015.
Lehrack, Sebastian, et al. "Ionoacoustic detection of swift
heavy ions." Nuclear Instruments and Methods in
Physics Research Section A: Accelerators,
Spectrometers, Detectors and Associated Equipment
950 (2020): 162935.
Patch, S. K., et al. "Thermoacoustic range verification using
a clinical ultrasound array provides perfectly co-
registered overlay of the Bragg peak onto an ultrasound
BIODEVICES 2021 - 14th International Conference on Biomedical Electronics and Devices
86

image." Physics in Medicine & Biology 61.15 (2016):
5621.
Jones, K. C., Vander Stappen, F., Sehgal, C. M., & Avery,
S. (2016). Acoustic time‐of‐flight for proton range
verification in water. Medical physics, 43(9), 5213-
5224.
M. Riva, E. A. Vallicelli, A. Baschirotto, and M. De
Matteis, “Acoustic Analog Front End for Proton Range
Detection in Hadron Therapy,” IEEE Transactions on
Biomedical Circuits and Systems, Vol. 12, no. 4, pp.
954-962, April 2018.
Vallicelli, Elia A., et al. "Mixed-Signal Ionoacoustic
Analog Front-End for Proton Range Verification with
24 μm Precision at 0.8 Gy Bragg Peak Dose." 2019 26th
IEEE International Conference on Electronics, Circuits
and Systems (ICECS). IEEE, 2019.
Vallicelli, E. A., Turossi, D., Gelmi, L., Baù, A., Bertoni,
R., Fulgione, W., ... & De Matteis, M. (2020). A 0.3
nV/√ Hz input-referred-noise analog front-end for
radiation-induced thermo-acoustic pulses. Integration.
M.A. Samir, E. Dardiry, A Theory for Optimization in the
Use of Acoustic Emission Transducers, vol. 1, Roger
Hill, 1979
Vallicelli, Elia Arturo, et al. "22 dB Signal-to-Noise Ratio
Real-Time Proton Sound Detector for Experimental
Beam Range Verification." IEEE Transactions on
Circuits and Systems I: Regular Papers (2020).
Baschirotto, A., Delizia, P., D’Amico, S., Chironi, V.,
Cocciolo, G., & De Matteis, M. (2009). “Low power
analog design in scaled technologies”. Proceedings of
the Topical Workshop on Electronics for Particle
Physics, TWEPP 2009, Pages 103-109. Paris; France;
21 September 2009
De Matteis, M., D'Amico, S., & Baschirotto, A. (2006,
June). Power-minimization design procedure for Rauch
biquadratic cells. In 2006 Ph. D. Research in
Microelectronics and Electronics (pp. 141-144). IEEE.
Front-end Design Optimization for Ionoacoustic 200 MeV Protons Beam Monitoring with Sub-millimeter Precision for Hadron Therapy
Applications
87
