
Machine Learning based Voice Analysis in Spasmodic Dysphonia: An
Investigation of Most Relevant Features from Specific Vocal Tasks
Giovanni Costantini
1a
, Pietro Di Leo
1b
, Francesco Asci
2c
, Zakarya Zarezadeh
1
, Luca Marsili
4
,
Vito Errico
1
, Antonio Suppa
2,3 d
and Giovanni Saggio
1e
1
Department of Electronic Engineering, University of Rome Tor Vergata, 00133 Rome, Italy
2
Department of Human Neurosciences, Sapienza University of Rome, 00185 Rome, Italy
3
IRCCS Neuromed, 86077 Pozzilli (IS), Italy
4
Gardner Family Center for Parkinson's Disease and Movement Disorders, Department of Neurology,
University of Cincinnati, Cincinnati, OH, U.S.A.
Keywords: Adductor-type Spasmodic Dysphonia, Botulinum Neurotoxin, Voice Analysis, Cepstral Analysis, Feature
Extraction, Feature Selection, Machine Learning.
Abstract: Adductor-type spasmodic dysphonia (ASD) is a task-specific speech disorder characterized by a strangled
and strained voice. We have previously demonstrated that advanced voice analysis, performed with support
vector machine, can objectively quantify voice impairment in dysphonic patients, also evidencing results of
voice improvements due to symptomatic treatment with botulinum neurotoxin type-A injections into the vocal
cords. Here, we expanded the analysis by means of three different machine learning algorithms (Support
Vector Machine, Naïve Bayes and Multilayer Percept), on a cohort of 60 ASD patients, some of them also
treated with botulinum neurotoxin type A therapy, and 60 age and gender-matched healthy subjects. Our
analysis was based on sounds produced by speakers during the emission of /a/ and /e/ sustained vowels and a
standardized sentence. As a conclusion, we report the main features with discriminatory capabilities to
distinguish untreated vs. treated ASD patients vs. healthy subjects, and a comparison of the three classifiers
with respect to their discriminating accuracy.
1 INTRODUCTION
Adductor-type spasmodic dysphonia (ASD) is a task-
specific focal dystonia, characterized by involuntary
laryngeal muscle spasms during speech production,
which mainly occurs for females, with a ratio with
respect to male ranging from 2/1 to 8/1 (Jinnah et al.,
2013). Clinically, ASD manifests with a strained and
strangled voice, speech arrest and intermittent
phonatory breaks.
Among task-specific focal dystonia, ASD is a rare
and challenging entity (Albert and Knoefel, 2011;
Casper and Leonard, 2006; Murry, 2014). Patients
with ASD may manifest a clinically overt voice
tremor. Currently, the diagnosis of ASD is based on
neurologic examination and the evaluation of voice
a
https://orcid.org/0000-0001-8675-5532
b
https://orcid.org/0000-0002-0253-559X
c
https://orcid.org/0000-0003-0717-3521
d
https://orcid.org/0000-0001-9903-5550
e
https://orcid.org/0000-0002-9034-9921
impairment, which relies on perceptual assessment,
according to validated clinical rating scales that are a
fundamental support, but can be prone to examiner’s
bias and experience. Conveniently, the sound of the
voice can be analyzed through technological means
too, which can help in rating objectification (Saggio
& Costantini, 2020).
Recently, we applied voice analysis aimed at
examining voice impairment in patients with ASD
(Antonio Suppa et al., 2020). In particular, the
cepstral peak prominence (CPP) and its smoothed
variant (CPPs) were found inversely proportional to
the degree of patients’ voice impairment, accordingly
to previous observations (Heman-Ackah et al., 2014;
Hillenbrand and Houde, 1996; Lowell et al., 2011;
Peterson et al., 2013; Suppa et al., 2015).
Costantini, G., Di Leo, P., Asci, F., Zarezadeh, Z., Marsili, L., Errico, V., Suppa, A. and Saggio, G.
Machine Learning based Voice Analysis in Spasmodic Dysphonia: An Investigation of Most Relevant Features from Specific Vocal Tasks.
DOI: 10.5220/0010344601030113
In Proceedings of the 14th International Joint Conference on Biomedical Engineering Systems and Technologies (BIOSTEC 2021) - Volume 4: BIOSIGNALS, pages 103-113
ISBN: 978-989-758-490-9
Copyright
c
2021 by SCITEPRESS – Science and Technology Publications, Lda. All rights reserved
103

In our study, we performed voice analysis by
means of machine learning algorithms too, comparing
patients’ vocal tasks with respect to healthy subjects’
ones (HS). Specifically, a machine learning model
applied to a large dataset of vocal samples, was able
to discriminate patients vs. control by means of
specific selected features (Asci et al., 2020; Parada-
Cabaleiro et al., 2018; Alessandrini et al., 2017;
Antonio Suppa et al., 2020). In such a way, we
demonstrated how, and to what extent, voice analysis
based on a machine learning approach, by means of
an artificial neural network (ANN) algorithm, gains
in accuracy classification with respect to traditional
means.
Furthermore, this approach was usefully adopted
to evidence improvements, in voices of patients
treated with botulinum neurotoxin type-A (BoNT-A)
injection into the vocal cords (Benninger et al., 2001;
Bhattacharyya and Tarsy, 2001; Schlotthauer et al.,
2010; Suppa et al., 2020).
Here, firstly we aimed at extending the
aforementioned analysis in ASD by applying
different machine learning algorithms, such as
Support Vector Machine (SVM), Naïve Bayes (NB),
and Multilayer Perceptron (MP), to evidence the best
performing one in differencing patients before and
after BoNT-A treatment, vs. healthy control group.
To this purpose, we asked subjects to perform
sustained /a/ and /e/ vowels, and to say a standardized
sentence. In this way, as a second aim, we determined
whether the performances of adopted algorithms
could be affected or depended by the specific vocal
task.
Finally, our third aim was to evidence which were
the families of low-level descriptors (LLDs) and
functionalities with the most relevant information
content with respect to our purposes.
2 MATERIALS AND METHODS
2.1 Subjects
Our patients’ cohort included 60 subjects with ASD
(9 men, 60.44yo±10.73SD; 51 women,
64.69yo±13.37SD), and a group of age- and gender-
matched healthy subjects (15 men,
60.73yo±12.79SD; 45 women, 57.76yo±11.9SD), for
comparison purposes. They were enrolled in the
Movement Disorders Clinic at the Department of
Human Neurosciences, Sapienza University of Rome
(Italy) (Antonio Suppa et al., 2020).
Patients were diagnosed with ASD according to
standard criteria (Johnson et al., 1997; Ludlow et al.,
2018; Schindler et al., 2010). All participants were
native Italian speakers, non-smokers, not suffering
from bilateral / unilateral hearing loss or any
respiratory disorders.
A patient’s subgroup of 35 subjects (8 men;
61.75yo±10.67SD; 27 women, 65.93yo±11.29SD)
was treated with BoNT-A injections. For them, voices
were recorded at starting time (e.g. before BoNT-A
injections) and one month after BoNT-A injections
(Antonio Suppa et al., 2020).
Patients’ groups were differentiated in order to
both evidence the vocal features that can discriminate
the pathological status (with respect to the healthy
subjects), and assess the effectiveness of the therapy
by means of data comparisons.
All participants gave their written informed
consent to the study, which was approved by the
institutional review board in accordance with the
Declaration of Helsinki.
2.2 Voice Recordings and Analysis
Details regarding the experimental setting and voice
recording procedures were already reported (Suppa et
al., 2020). In particular, all participants were upright
seated while three times repeated vocal tasks in a
sound-proof room. The voices were acquired by
means of a Shure WH20 dynamic headset
microphone (Shure Incorporated, USA), 5 cm from
the mouth, and recorded in “.wav” format by means
of a high definition audio-recorder Zoom H4n (Zoom
Corporation, Tokyo, Japan), sampled at 44.1 kHz,
with 16-bit resolution.
Vocal tasks were sustained emission of the vowels
/a/ and /e/, and the Italian-sound standardized
sentence “Nella casa in riva al mare maria vide tre
cani bianchi e neri”, at subject’s normal voice
intensity and pitch (Lowell et al., 2013; Peterson et
al., 2013).
The analysis included the extraction of more than
6000 voice features, by means of OpenSMILE
(software by audEERING GmbH, Germany) (Eyben
et al., 2010), in accordance to the INTERSPEECH
2016 Computational Paralinguistics Challenge
(ComParE) feature set (Schuller et al., 2016). We
added CPPs, extracted via SpeechTool software
(Heman-Ackah et al., 2014; Antonio Suppa et al.,
2020) to the feature set too, being CPPs relevant in
ASD
.
Each one of the extracted features is characterized
by its low-level descriptor (LLD), LLD family, and
LLD functional.
All features were imported in the Weka software
(Waikato Environment for Knowledge Analysis,
BIOSIGNALS 2021 - 14th International Conference on Bio-inspired Systems and Signal Processing
104

University of Waikato, New Zealand) (Hall et al.,
2009) in order to perform selection and ranking, as
detailed in the following.
Again, the Weka software was adopted for
classifying purposes too.
2.3 Data Pre-processing
Data pre-processing consisted of extraction and
selection of features.
Feature extraction is aimed at determining the
most relevant features in differentiating classes of
untreated patients, BoNT-A treated patients, and HS
(Barandas et al., 2020).
Feature selection is aimed at identifying the
optimal subset of features that maximizes information
content. Through feature selection, highly
intercorrelated or irrelevant features were removed to
improve classification performances, reducing data
storage, computational time and classifier’s
complexity. To perform feature selection, we adopted
a supervised filter made of an evaluator, which
measures the significance of a subset of features and
returns a numerical value of merit that guides the
search for the optimal subset, and a searching method,
that explores the features space, considering different
combinations of features in the dataset, in order to
find the feature subset with maximum information
content. As an evaluator, we adopted the correlation-
based feature selection (CFS) algorithm (Hall, 2000),
that prefers subsets of features with low
intercorrelation and high correlation with the target
class (i.e. untreated patients, BoNT-A treated patients
and HS), whilst as a searching method we adopted the
Greedy Stepwise algorithm. Furthermore, we ranked
the selected features on the basis of their Information
Gain with respect to the target class. This was
particularly aimed at determining the more relevant
features in evaluating the BoNT-A therapy
effectiveness.
2.4 Statistical Analysis
Kolmogorov-Smirnov test was used to demonstrate
the normality of the demographic and anthropometric
parameters of the subjects, in terms of age, gender,
height and weight, obtaining result of p > 0.05.
Mann-Whitney U test was used to compare the
demographic and clinical scores of ASD patients and
HS. Results obtained guaranteed the possibility of a
demographic and clinical scores comparison between
the patients vs. healthy groups (p > 0.05).
The assessed comparative statistical analysis
included the sensitivity, specificity, positive and
negative predictive values, as well as the accuracy
and the Youden’s index of the classification.
ROC analysis was also performed and the Area
Under Curve (AUC) value was calculated for all the
ROC curves. Classification’s performances obtained
for different vocal tasks were compared by
considering the differences among ROC curves
(DeLong et al., 1988).
2.5 Classification
For classification purposes, we adopted three
different machine learning models, such as Support
Vector Machine (SVM) with linear kernel, Naïve
Bayes (NB) and Multilayer Perceptron (MP). This
was to evidence the best performing classifier.
SVM model allows building a linear, binary and
non-probabilistic classifier, which considers training
examples as points in an N-dimensional space (where
N is the number of the features) and aims at separating
the two classes of subjects with a hyperplane in the
N-dimensional space. We trained the SVM using the
sequential minimal optimization (SMO) method
(Platt, 1999).
Naïve Bayes model allows building a supervised
probabilistic classifier based on Bayes’ theorem, with
the assumption of the independence between the
features (John and Langley, 1995).
Multilayer Perceptron is a class of artificial neural
network with at least three layers of neurons, that use
supervised backpropagation techniques for training
(Van Der Malsburg, 1986). We used a network with
N-neuron input layer, where N is equal to the number
of selected features, (N/2+1)-neuron hidden layer and
two-neuron output layer, trained through 500 epochs.
All three classifiers were trained through Weka
software using the features selected by CFS. All the
classification were made using a 10-folds cross-
validation. The three classifiers were used to perform
three different classification tests: HS vs. untreated
ASD, HS vs. ASD after treatment, untreated vs. the
same group of patients after subjected to BoNT-A
treatment.
3 RESULTS
3.1 HS vs. Untreated ASD
Table 1 shows comparison results of HS vs. untreated
ASD patients.
Among all the vocal tasks, we achieved the
highest accuracy (95%) for the vowel /e/, regardless
the adoption of Multilayer Perceptron or SVM.
Machine Learning based Voice Analysis in Spasmodic Dysphonia: An Investigation of Most Relevant Features from Specific Vocal Tasks
105
The vowel /a/, the vowel /e/ and the sentence
achieved similar performances according to the ROC
curves comparison (Figure 1 A, B).
Tables 2 and 3 evidence the top 10 most relevant
features, when ranked through the Information Gain
algorithm. In particular, for both vowels the most
relevant ranked features are the ones related to the
fundamental frequency, to the Mel-Frequency
Cepstral Coefficients (MFCC) and to the RASTA
coefficients (Hermansky and Morgan, 1994).
Conversely, for the sentence the most relevant
features are CPPs, and those related to jitter and
RASTA coefficients.
3.2 HS vs. Treated ASD
Table 4 shows comparison results related to HSs vs.
BoNT-A treated patients.
Among all the vocal tasks, we achieved the
highest accuracy (98.57%) for the vowel /e/,
regardless of the adoption of Multilayer Perceptron or
SVM.
Both vowel /e/ and the sentence achieved similar
performances according to comparisons of the ROC
curves (Figure 1 C). We found that the top 10 most
relevant features, when ranked through the
Information Gain algorithm, are similar to those
found in comparison of the previous section 3.1. In
particular, the LLDs’ families are the same for the
two cases.
3.3 ASD before and after BoNT-A
Table 4 shows comparison results related to untreated
patients vs. BoNT-A treated ones.
Among all the vocal tasks, we achieved the
highest accuracy (81.43%) for the sentence and SVM.
Both vowel /e/ and the sentence achieved similar
performances according to their ROC curves (Figure
1 D).
Table 5 evidences the top 10 most relevant
features, when ranked through the Information Gain
algorithm. In particular, for all the vocal tasks the
most relevant ranked features are the ones related to
the spectrum, to the Mel-Frequency Cepstral
Coefficients (MFCC) and to the RASTA coefficients.
3.4 The Most Relevant Features
Vocal features with high discriminatory power can be
found directly from comparing vocal samples of
treated and untreated patients from those of HS.
We examined the most relevant features (Tables
2, 3, 5) and found those capable of better
differentiating ASD patients from HS, and better
discriminating the clinical effects of BoNT-A therapy
on patients’ voice.
Figure 2 shows the distributions of the values of
HS and ASD patients, treated and untreated, for two
of those vocal features, found for the sentence by
means of ranking algorithms, compared to CPPs
distribution. Features found through our analysis are
comparable to CPPs, in terms of discriminatory
capabilities.
Figure 3 shows the mean values of that
parameters where the values of treated ASD patients
are more near to that of the HS rather than that of
untreated ASD. Those features could be biological
markers useful to evaluate the improvement in
patients’ voices after the treatment.
Table 1: Machine learning’s performance in discriminating HS from untreated ASD patients for all the vocal tasks with 10-
folds cross-validation. Sens: Sensitivity; Spec: Specificity; PPV: Positive Predictive Value; NPV: Negative Predictive Value;
Acc: Accuracy; AUC: Area Under the (ROC) Curve.
Classifier Vocal
Tasks
Features’
Number
Youden
Index
Sens
(%)
Spec
(%)
PPV
(%)
NPV
(%)
Acc
(%)
AUC
Healthy
vs.
ASD
before
BoNT-A
Naïve
Bayes
Vowel /a/ 93 0.85 94.74 90.48 90.00 95.00 92.5 0.955
Vowel /e/ 131 0.86 98.11 88.06 86.67 98.33 92.5 0.978
Sentence 85 0.77 95.91 81.69 78.3 96.67 87.5 0.975
Multilayer
Perceptron
Vowel /a/ 93 0.88 93.44 94.91 95 93.3 94.17 0.972
Vowel /e/ 131 0.9 95 95 95 95 95 0.985
Sentence 85 0.82 94.55 87.69 86.67 95.00 90.83 0.975
SVM
Vowel /a/ 93 0.87 93.33 93.33 93.33 93.33 93.33 0.971
Vowel /e/ 131 0.9 95 95 95 95 95 0.948
Sentence 85 0.82 94.55 87.69 86.67 95.00 90.83 0.908
BIOSIGNALS 2021 - 14th International Conference on Bio-inspired Systems and Signal Processing
106

Table 2: Ranking of the first 10 selected features for the vowels, obtained by means of Information Gain algorithm, when
discriminating HS from untreated ASD; LLD: Low Level Descriptor; MFCC: Mel Frequency Cepstral Coefficient. The suffix
“de” indicates that the current feature is a 1st order delta coefficient (differential) of the smoothed low-level descriptor (delta
regression coefficients computed from the feature).
HS vs. untreated ASD
Vowel /a/ Vowel /e/
№
Families of
LLDs
LLDs Functionals
Families of
LLDs
LLDs Functionals
1
RASTA
coefficients
Coefficient of
band 10 (de)
3
rd
Quartile MFCC
6
th
Mel
Coefficient(de)
Inter-quartile 1-3
2
Voicing
Related
Fundamental
Frequency (fo)
Inter-quartile 1-2
MFCC
1
st
Mel
Coefficient(de)
3
rd
Quartile
3
Voicing
Relate
d
Fundamental
Fre
q
uenc
y
(
fo
)
Inter-quartile 1-3
Voicing
Relate
d
Fundamental
Fre
q
uenc
y
(
fo
)
Inter-quartile 1-2
4
RASTA
coefficients
Coefficient of
b
and 2 (de)
Inter-quartile 1-3
Voicing
Relate
d
Fundamental
Frequency (fo)
3
rd
Quartile
5
MFCC
1
st
Mel
Coefficient(de)
3
rd
Quartile MFCC
5
th
Mel
Coefficient(de)
Position of
arithmetic mean
6
RASTA
coefficients
Coefficient of
b
and 3
(
de
)
3
rd
Quartile
RASTA
coefficients
Coefficient of
b
and 6
(
de
)
Inter-quartile 1-3
7
Voicing
Relate
d
Fundamental
Fre
q
uenc
y
(
fo
)
Inter-quartile 2-3
Voicing
Relate
d
Fundamental
Fre
q
uenc
y
(
fo
)
Inter-quartile 2-3
8
RASTA
coefficients
Coefficient of
band 2 (de)
3
rd
Quartile MFCC
5
th
Mel
Coefficient(de)
Inter-quartile 2-3
9
MFCC
3
rd
Mel
Coefficient(de)
3
rd
Quartile MFCC
6
th
Mel
Coefficient(de)
Inter-quartile 2-3
10
MFCC
6
th
Mel
Coefficient(de)
1
st
Quartile
RASTA
coefficients
Coefficient of
band 5 (de)
3
rd
Quartile
Table 3: Ranking of the first 10 selected features for the sentence, obtained by means of Information Gain algorithm, when
discriminating HS from untreated ASD; CPPs: Cepstral Peak Prominence smoothed; LLD: Low Level Descriptor; MFCC:
Mel Frequency Cepstral Coefficient. The suffix “de” indicates that the current feature is a 1st order delta coefficient
(differential) of the smoothed low-level descriptor (delta regression coefficients computed from the feature).
HS vs. untreated ASD
Sentence
№ Families of LLDs LLDs Functionals
1 Cepstral LLD CPPs Pure Value
2 Sound Quality Jitter Arithmetic mean
3 Sound Quality Jitter Inter-quartile 2-3
4 Sound Quality Jitter
3
rd
Quartile
5 Sound Quality Jitter Inter-quartile 1-3
6 Sound Quality Jitter Root quadratic mean
7 Sound Quality Shimmer
1%Percentile
8
EnergyRelated RMSEnergy
Relative peak mean
9 Sound Quality Jitter Standard deviation
10 Sound Quality Jitter
2
nd
coefficient of the linear regression
Machine Learning based Voice Analysis in Spasmodic Dysphonia: An Investigation of Most Relevant Features from Specific Vocal Tasks
107

Table 4: Machine learning’s performance in discriminating treated ASD patients from HS and from ASD patients before
BoNT-A therapy, for the sentence and the vowel /e/, with 10-folds cross-validation. Sens: Sensitivity; Spec: Specificity; PPV:
Positive Predictive Value; NPV: Negative Predictive Value; Acc: Accuracy; AUC: Area Under the (ROC) Curve. Please note
that for these comparisons, since the vowels got comparable performance, we reported, for simplicity, only results related to
the vowel /e/.
Classifier Vocal
Tasks
Features’
Number
Youden
Index
Sens
(%)
Spec
(%)
PPV
(%)
NPV
(%)
Acc
(%)
AUC
Healthy
vs.
treated
ASD
Naïve Bayes
Vowel /e/ 84 0.84 96.77 87.18 85.71 97.14 91.43 0.964
Sentence 65 0.89 96.97 91.89 91.43 97.14 94.28 0.964
Multilayer
Perceptron
Vowel /e/ 84 0.97 100.0 97.22 97.14 100.0 98.57 1
Sentence 65 0.86 94.12 91.67 91.43 94.29 92.85 0.988
SVM
Vowel /e/ 84 0.97 100.0 97.22 97.14 100.0 98.57 0.986
Sentence 65 0.80 91.18 88.89 88.57 91.43 90 0.976
ASD
before
BoNT-A
vs.
after
BoNT-A
Naïve Bayes
Vowel /e/ 21 0.49 74.29 74.29 74.29 74.29 74.28 0.793
Sentence 23 0.67 75.00 92.31 94.29 68.57 80 0.865
Multilayer
Perceptron
Vowel /e/ 21 0.54 78.79 75.68 74.29 80.00 77.14 0.802
Sentence 23 0.58 76.32 81.25 82.86 74.29 78.57 0.824
SVM
Vowel /e/ 21 0.46 73.53 72.22 71.43 74.29 72.86 0.767
Sentence 23 0.60 81.82 78.38 77.14 82.86 81.43 0.931
Table 5: Ranking of the first 10 selected features for the vowel /e/ and for the sentence, obtained by means of Information
Gain algorithm, when discriminating ASD before and after BoNT-A therapy; LLD: Low Level Descriptor; MFCC: Mel
Frequency Cepstral Coefficient. The suffix “de” indicates that the current feature is a 1st order delta coefficient (differential)
of the smoothed low-level descriptor (delta regression coefficients computed from the feature). Please note that since for the
vowels were selected similar features we reported, for simplicity, only those related to the vowel /e/.
ASD before vs. after BoNT-A
Vowel /e/ Sentence
№
Families of
LLDs
LLDs Functionals
Families of
LLDs
LLDs Functionals
1 Spectral LLD
Spectral
Variance
(
de
)
Relative duration
LLD is above 75%
Spectral LLD
Spectral Flux
(
de
)
1
st
coefficient of
linear
p
rediction
2
RASTA
coefficients
Coefficient of
b
and 19 (de)
Position of
minimu
m
Spectral LLD
Spectral
Variance (de)
Relative duration
left curvature
3 Spectral LLD
Spectral
Skewness (de)
Mean segment
length
Spectral LLD Spectral Slope
Position of
maximum
4
RASTA
coefficients
Coefficient of
band 20 (de)
Standard segment
length
Prosodic
LLD
Sum of auditory
spectrum
Coefficient 0 of
linear prediction
5 MFCC
3
rd
Mel
Coefficient
(
de
)
3
rd
Quartile
Sound
Qualit
y
Jitter
2
nd
coefficient of
linear re
g
ression
6 MFCC
3
rd
Mel
Coefficient (de)
Inter-quartile 2-3
RASTA
coefficients
Coefficient of
band 23 (de)
Mean of falling
slope
7 Spectral LLD
Spectral
Harmonicity
Mean of peak
distances
MFCC
9
th
Mel
Coefficient (de)
Relative peak
mean
8
RASTA
coefficients
Coefficient of
band 6 (de)
Mean segment
length
MFCC
2
nd
Mel
Coefficient (de)
4
th
coefficient of
linear prediction
9
Voicing Related
LLD
Fundamental
Frequency (fo)
2
nd
Quartile
Energy
Related LLD
RMS Energy
Position of
minimum
10 Spectral LLD Spectral Slope
3
rd
coefficient of the
linear prediction
MFCC
7
th
Mel
Coefficient (de)
Relative duration
left curvature
BIOSIGNALS 2021 - 14th International Conference on Bio-inspired Systems and Signal Processing
108
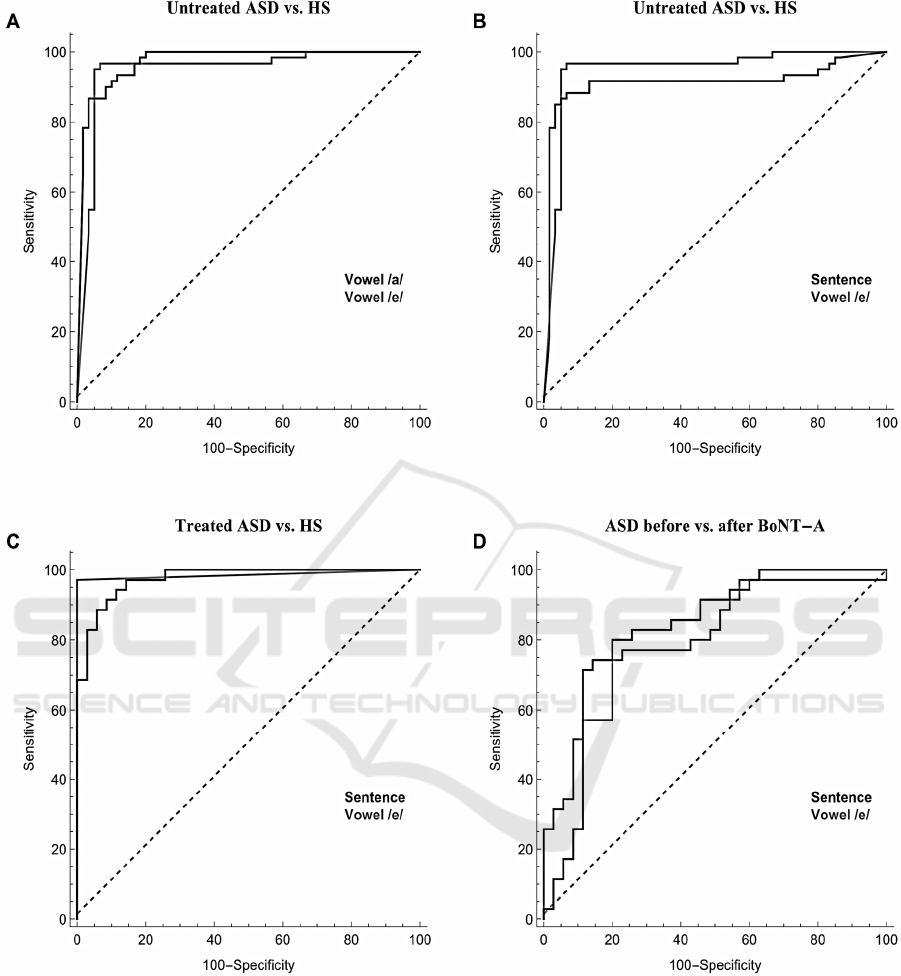
Figure 1: ROC curves comparison for the results obtained when differentiating untreated ASD patients from HS with two
different vowels (panels A) and with a sentence and a vowel (panel B), when differentiating treated ASD patients from HS
with a sentence and a vowel (panel C) and when differentiating ASD patients after and before BoNT-A with a sentence and
a vowel (panel D). Please note that since all the classifiers achieve similar results, we reported, for simplicity, only the ROC
curves related to SVM classifier. ROC analysis evidences that through a machine learning-based analysis is possible to
accurately discriminate between HS and ASD, both treated and untreated. Moreover, performances obtained with different
vocal tasks are comparable. Lowest results are obtained for panel D, suggesting that, although BoNT-A partially rehabilitates
the voices of treated patients, those does not result as the ones of the healthy counterpart.
Machine Learning based Voice Analysis in Spasmodic Dysphonia: An Investigation of Most Relevant Features from Specific Vocal Tasks
109
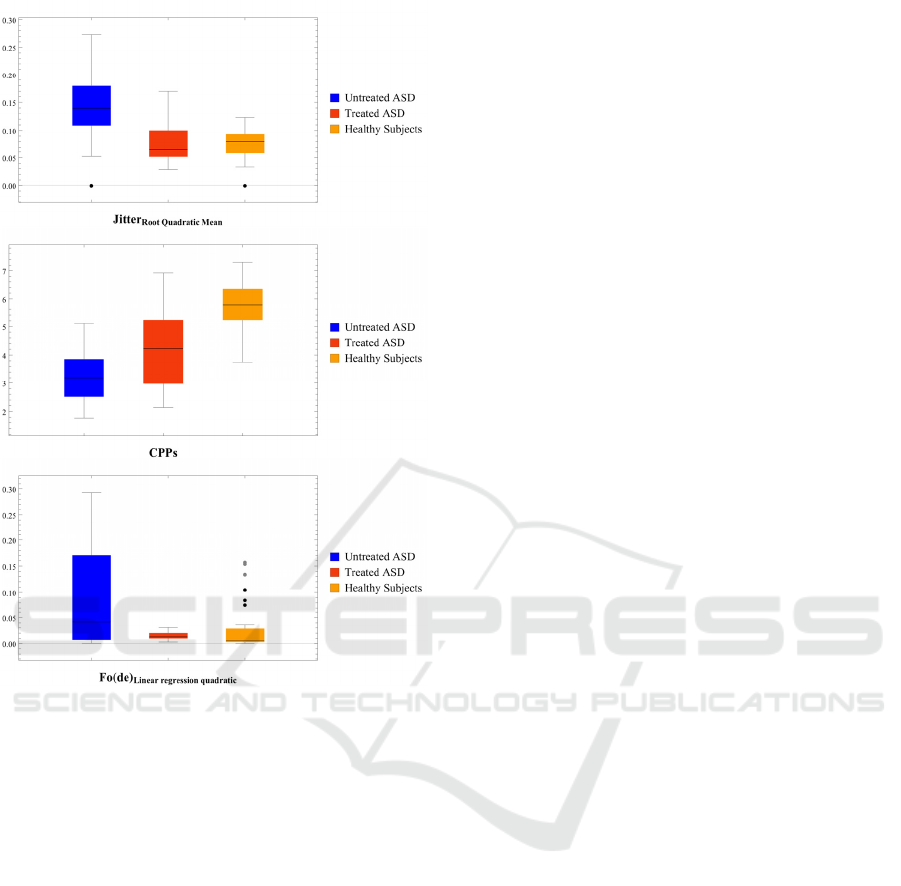
Figure 2: Comparison between the distributions of the
values of some of the most relevant vocal features for the
sentence, found by means of ranking algorithms, and CPPs’
distribution. Features found through our analysis are
comparable to CPPs, in terms of discriminatory
capabilities.
4 DISCUSSION
In our study we analyzed three different vocal tasks,
including the vowel /a/ and /e/ and an Italian-sound
sentence, by means of three different machine
learning algorithms. All the algorithms distinguished
ASD patients, both treated and untreated, from HS,
and also patients before and after BoNT-A.
Generally, we obtained slightly better performance
through SVM classifier according to the results
showed in Table 1.
Moreover, comparable performances were
obtained by means of all the vocal tasks. To better
quantify the symptomatic effects of BoNT-A, we
analyzed the most relevant features by means of the
Information Gain ranking algorithm.
We obtained several features that could be useful
to objectively evaluate the effects of BoNT-A therapy
through all the vocal tests.
Wolfe et al. (1995) reported that the sound
analysis of sustained vowels may not be adequate to
evidence ASD or vocal disorders in general,
preferring a speech-based analysis. Differently,
Maryn & Roy (2012) reported that both sounds of
sustained vowels and speech should be considered in
rating ASD severity. Furthermore, studies involving
cepstral analysis considered only sentences for vocal
tasks (Heman-Ackah et al., 2014; Lowell et al., 2013),
finding only a moderate correlation between the
CPPs values calculated from sustained vowels and
clinical parameters (Hernández et al., 2018).
Because of this discrepancy, here we preferred to
analyze the information content both of vowels /a/
and /e/ and of an Italian-sound standardized sentence,
by means of a machine learning approach, to evidence
differences among groups of untreated ASD patients,
BoNT-A treated ASD patients, and age- and gender-
matched healthy subjects.
According to our results, the subject under vocal
tasks can be correctly assigned to the belonging
group, with comparable accuracy, sensitivity and
specificity scores (Table 1), regardless the adopted
vocal tasks, involving sustained vowels or sentence.
Moreover, we compared the performances of
three different classifiers, with the result that in
general SVM slightly outperform with respect Naïve
Bayes (NB) and Multilayer Perceptron (MP), as in
general it occurs for classifying complex variables
obtained from large audio and medical datasets (G.
Costantini, D. Casali, M. Todisco, 2010; Giovanni
Costantini et al., 2010; Saggio et al., 2011).
The adopted procedure successfully performed in
discriminating HS vs. untreated vs. treated ASD
patients (Table 4). The latter discrimination confirms
how, although BoNT-A therapy meaningfully
improves ASD symptoms, the voice of treated
patients does not result as the one of the healthy
counterpart (A. Suppa et al., 2015; Antonio Suppa et
al., 2020).
The Information Gain ranking algorithm allowed
identifying the most relevant features among those
selected by CFS. Those features were almost the same
from analysis of sounds from both /a/ and /e/ vowels,
but different from the extracted one from the sentence
(Tables 2 and 3). As a result, sustained vowels and
sentence have a different information content, so that
it can be convenient to consider both of them to get a
complete view of patient’s voice conditions.
BIOSIGNALS 2021 - 14th International Conference on Bio-inspired Systems and Signal Processing
110
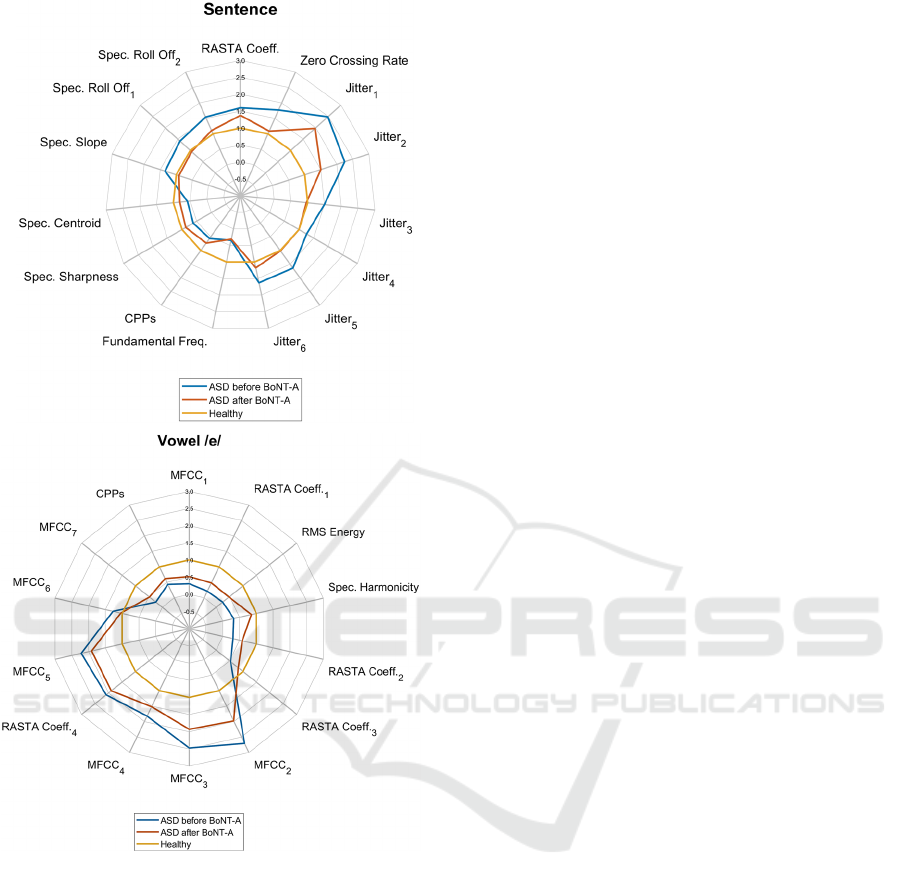
Figure 3: Mean values of the selected features that can
discriminate more effectively vocal samples of ASD
patients after BoNT-A therapy from samples of the same
patients before the therapy. For each feature the mean value
is normalized to the mean value of the HS, that represents a
reference of the normal vocal behavior (yellow circle).
Features’ labels are relative to the LLDs of the features, two
features with the same LLD are reported with the same label
but with a different subscript, indicating they are related to
a different functional applied to the same LLD. Please note
that since the features of the vowels are similar, we
reported, for simplicity, only the radar charts of the
sentence and vowel /e/.
As depicted in Figure 2, showing a comparative
boxplot between CPPs and a pair of the selected
features, these features are able to differentiate
between HS and ASD (treated and untreated)
populations, also more effectively than CPPs.
Figure 3 shows two radar charts representing the
mean value of the distributions of the features we
considered the most effective in discriminating ASD
after BoNT-A from ASD before BoNT-A. These
plots highlight that the mean values of the parameters
of treated ASD patients are more near to that of the
HS rather than that of untreated ASD, and could be
useful to objectively evaluate the clinical effects of
BoNT-A therapy on patients’ voices.
5 CONCLUSIONS
Previous studies recognized CPPs as the most
relevant feature to identify and quantify ASD
(Heman-Ackah et al., 2014; Hillenbrand & Houde,
1996) and found low CPPs values in dysphonic
patients while speaking (Heman-Ackah et al., 2014;
Hillenbrand & Houde, 1996; A. Suppa et al., 2015) or
sustaining a vowel (Hernández et al., 2018).
Here, we performed a voice sound analysis,
extracting a large set of vocal features, selecting the
most relevant features with respect to the class, and
training three classifiers through machine learning
techniques.
In a previous study, we demonstrated the
possibility of discriminating ASD patients from HS,
by adopting a machine learning approach to a selected
group of vocal features, which better performed with
respect considering CPPs only (Antonio Suppa et al.,
2020).
In this study, we compared three machine learning
algorithms, obtaining high accuracy performances
with all of them, SVM slightly better outperforming
with respect to NB and MP.
In addition, according to our results, both the
emission of a vowel or the continuous speech allow
achieving comparable results in terms of accuracy,
sensitivity and specificity, even if analyzing the LLDs
related to sustained vowels and sentence present a
different information content. Through the analysis of
LLDs, it is possible to find new parameters that could
objectively evaluate ASD symptoms and the effects
of BoNT-A therapy.
According to the obtained results, this work can
represent a step towards future research aimed at
classifying other voice disorders due to neurologic or
non-neurologic disorders.
Machine Learning based Voice Analysis in Spasmodic Dysphonia: An Investigation of Most Relevant Features from Specific Vocal Tasks
111

REFERENCES
Albert, M. L., & Knoefel, J. E. (2011). Clinical Neurology
of Aging. Clinical Neurology of Aging. https://
oxfordmedicine.com/view/10.1093/med/97801953692
98.001.0001/med-9780195369298
Alessandrini, M., Micarelli, A., Viziano, A., Pavone, I.,
Costantini, G., Casali, D., Paolizzo, F., & Saggio, G.
(2017). Body-worn triaxial accelerometer coherence
and reliability related to static posturography in
unilateral vestibular failure. Acta Otorhino-
laryngologica Italica: Organo Ufficiale Della Societa
Italiana di Otorinolaringologia e Chirurgia Cervico-
Facciale, 37(3), 231–236. https://doi.org/10.14639/
0392-100X-1334
Asci, F., Costantini, G., Di Leo, P., Zampogna, A.,
Ruoppolo, G., Berardelli, A., Saggio, G., & Suppa, A.
(2020). Machine-Learning Analysis of Voice Samples
Recorded through Smartphones: The Combined Effect
of Ageing and Gender. Sensors, 20(18), 5022.
https://doi.org/10.3390/s20185022
Barandas, M., Folgado, D., Fernandes, L., Santos, S.,
Abreu, M., Bota, P., Liu, H., Schultz, T., & Gamboa, H.
(2020). TSFEL: Time Series Feature Extraction
Library. SoftwareX, 11, 100456.
Benninger, M. S., Gardner, G., & Grywalski, C. (2001).
Outcomes of botulinum toxin treatment for patients
with spasmodic dysphonia. Archives of Otolaryngology-
-Head & Neck Surgery, 127(9), 1083–1085.
Bhattacharyya, N., & Tarsy, D. (2001). Impact on quality
of life of botulinum toxin treatments for spasmodic
dysphonia and oromandibular dystonia. Archives of
Otolaryngology--Head & Neck Surgery, 127(4), 389–
392.
Casper, J. K., & Leonard, R. (2006). Understanding Voice
Problems: A Physiological Perspective for Diagnosis
and Treatment. Lippincott Williams & Wilkins.
Costantini, G., Todisco, M., Perfetti, R., Basili, R., &
Casali, D. (2010). SVM Based Transcription System
with Short-Term Memory Oriented to Polyphonic Piano
Music (pag. 201). https://doi.org/10.1109/MEL
CON.2010.5476305
Costantini, Giovanni, Casali, D., & Todisco, M. (2010). An
SVM based classification method for EEG signals.
Proceedings of the 14th WSEAS International Conf. on
Circuits, 107–109.
DeLong, E. R., DeLong, D. M., & Clarke-Pearson, D. L.
(1988). Comparing the areas under two or more
correlated receiver operating characteristic curves: A
nonparametric approach. Biometrics, 44(3), 837–845.
Eyben, F., Wöllmer, M., & Schuller, B. (2010).
OpenSMILE -- The Munich Versatile and Fast Open-
Source Audio Feature Extractor. In MM’10—
Proceedings of the ACM Multimedia 2010
International Conference (pag. 1462).
Hall, M. (2000). Correlation-Based Feature Selection for
Machine Learning. Department of Computer Science,
19.
Hall, M., Frank, E., Holmes, G., Pfahringer, B., Reutemann,
P., & Witten, I. H. (2009). The WEKA data mining
software: An update. ACM SIGKDD Explorations
Newsletter, 11(1), 10–18.
Heman-Ackah, Y. D., Sataloff, R. T., Laureyns, G., Lurie,
D., Michael, D. D., Heuer, R., Rubin, A., Eller, R.,
Chandran, S., Abaza, M., Lyons, K., Divi, V., Lott, J.,
Johnson, J., & Hillenbrand, J. (2014). Quantifying the
cepstral peak prominence, a measure of dysphonia.
Journal of Voice: Official Journal of the Voice
Foundation, 28(6), 783–788.
Hermansky, H., & Morgan, N. (1994). RASTA processing
of speech. Speech and Audio Processing, IEEE
Transactions on, 2, 578–589. https://doi.org/10.
1109/89.326616
Hernández, J., León, N., Arteaga, L., & Fumero, Y. (2018).
Cepstral Analysis of Normal and Pathological Voice in
Spanish Adults. Smoothed Cepstral Peak Prominence
in Sustained Vowels Versus Connected Speech. Acta
Otorrinolaringológica Española, 69, 134–140.
Hillenbrand, J., & Houde, R. (1996). Acoustic correlates of
breathy vocal quality: Dysphonic voices and
continuous speech. Journal of Speech and Hearing
Research, 39, 311–321.
Jinnah, H. A., Berardelli, A., Comella, C., DeFazio, G.,
DeLong, M. R., Factor, S., Galpern, W. R., Hallett, M.,
Ludlow, C. L., Perlmutter, J. S., & Rosen, A. R. (2013).
The focal dystonias: Current views and challenges for
future research. Movement Disorders, 28(7), 926–943.
John, G., & Langley, P. (1995). Estimating Continuous
Distributions in Bayesian Classifiers. Proceedings of
the 11th Conference on Uncertainty in Artificial
Intelligence, 1.
Johnson, A., Jacobson, B., Grywalski, C., Silbergleit, A.,
Jacobson, G., & Benninger, M. (1997). The Voice
Handicap Index (VHI): Development and Validation.
American Journal of Speech-Language Pathology, 6,
66–70.
Lowell, S. Y., Colton, R. H., Kelley, R. T., & Hahn, Y. C.
(2011). Spectral- and cepstral-based measures during
continuous speech: Capacity to distinguish dysphonia
and consistency within a speaker. Journal of Voice:
Official Journal of the Voice Foundation, 25(5), e223-
232.
Lowell, S. Y., Colton, R. H., Kelley, R. T., & Mizia, S. A.
(2013). Predictive value and discriminant capacity of
cepstral- and spectral-based measures during
continuous speech. Journal of Voice: Official Journal
of the Voice Foundation, 27(4), 393–400.
Ludlow, C. L., Domangue, R., Sharma, D., Jinnah, H. A.,
Perlmutter, J. S., Berke, G., Sapienza, C., Smith, M. E.,
Blumin, J. H., Kalata, C. E., Blindauer, K., Johns, M.,
Hapner, E., Harmon, A., Paniello, R., Adler, C. H.,
Crujido, L., Lott, D. G., Bansberg, S. F., … Stebbins,
G. (2018). Consensus-Based Attributes for Identifying
Patients with Spasmodic Dysphonia and Other Voice
Disorders. JAMA Otolaryngology-- Head & Neck
Surgery, 144(8), 657–665.
Maryn, Y., & Roy, N. (2012). Sustained vowels and
continuous speech in the auditory-perceptual evaluation
of dysphonia severity. Jornal Da Sociedade Brasileira
de Fonoaudiologia, 24(2), 107–112.
BIOSIGNALS 2021 - 14th International Conference on Bio-inspired Systems and Signal Processing
112

Murry, T. (2014). Spasmodic Dysphonia: Let’s Look at
That Again. Journal of Voice, 28(6), 694–699.
Parada-Cabaleiro, E., Costantini, G., Batliner, A., Baird, A.,
& Schuller, B. (2018). Categorical vs Dimensional
Perception of Italian Emotional Speech. INTER-
SPEECH. https://doi.org/10.21437/Interspeech. 2018-47
Peterson, E. A., Roy, N., Awan, S. N., Merrill, R. M.,
Banks, R., & Tanner, K. (2013). Toward validation of
the cepstral spectral index of dysphonia (CSID) as an
objective treatment outcomes measure. Journal of
Voice: Official Journal of the Voice Foundation, 27(4),
401–410.
Platt, J. (1999). Fast Training of Support Vector Machines
Using Sequential Minimal Optimization. Advances in
Kernel Methods: Support Vector Learning, 185–208.
Saggio, G., & Costantini, G. (2020). Worldwide Healthy
Adult Voice Baseline Parameters: A Comprehensive
Review. Journal of Voice, 0(0). https://doi.org/
10.1016/j.jvoice.2020.08.028
Saggio, G., Giannini, F., Todisco, M., & Costantini, G.
(2011). A data glove based sensor interface to
expressively control musical processes (pag. 195).
https://doi.org/10.1109/IWASI.2011.6004715
Schindler, A., Ottaviani, F., Mozzanica, F., Bachmann, C.,
Favero, E., Schettino, I., & Ruoppolo, G. (2010). Cross-
cultural Adaptation and Validation of the Voice
Handicap Index Into Italian. Journal of Voice, 24(6),
708–714.
Schlotthauer, G., Torres, M. E., & Jackson-Menaldi, M. C.
(2010). A pattern recognition approach to spasmodic
dysphonia and muscle tension dysphonia automatic
classification. Journal of Voice: Official Journal of the
Voice Foundation, 24(3), 346–353.
Schuller, B., Steidl, S., Batliner, A., Hirschberg, J.,
Burgoon, J., Baird, A., Elkins, A., Zhang, Y., Coutinho,
E., & Evanini, K. (2016). The INTERSPEECH 2016
Computational Paralinguistics Challenge: Deception,
Sincerity and Native Language (pag. 2005).
Suppa, A., Marsili, L., Giovannelli, F., Di Stasio, F.,
Rocchi, L., Upadhyay, N., Ruoppolo, G., Cincotta, M.,
& Berardelli, A. (2015). Abnormal motor cortex
excitability during linguistic tasks in adductor-type
spasmodic dysphonia. The European Journal of
Neuroscience, 42(4), 2051–2060. https://doi.org/10.
1111/ejn.12977
Suppa, Antonio, Asci, F., Saggio, G., Marsili, L., Casali, D.,
Zarezadeh, Z., Ruoppolo, G., Berardelli, A., &
Costantini, G. (2020). Voice analysis in adductor spas-
modic dysphonia: Objective diagnosis and response to
botulinum toxin. Parkinsonism & Related Disorders, 73,
23–30. https://doi.org/10.1016/j.parkreldis.2020.03.012
Van Der Malsburg, C. (1986). Frank Rosenblatt: Principles
of Neurodynamics: Perceptrons and the Theory of
Brain Mechanisms. In G. Palm & A. Aertsen (A c. Di),
Brain Theory (pagg. 245–248). Springer Berlin
Heidelberg.
Wolfe, V., Cornell, R., & Fitch, J. (1995). Sentence/vowel
correlation in the evaluation of dysphonia. Journal of
Voice: Official Journal of the Voice Foundation, 9(3),
297–303.
Machine Learning based Voice Analysis in Spasmodic Dysphonia: An Investigation of Most Relevant Features from Specific Vocal Tasks
113
