
A Linear, Pixel-specific Color Normalization Algorithm for Hematology
Imaging
Rachel Lou
1,2
and Thanh Le
1
1
Moichor Inc., Oakland, CA, U.S.A.
2
Molecular and Cell Biology/Computer Science at the University of California, Berkeley CA, U.S.A.
Keywords:
Computer-aided Diagnostics, Hematology, Imaging, Machine Learning.
Abstract:
The automated cell recognition of hematology microscope images provides crucial information for the qual-
itative description of cell morphology and other quantitative applications in analyzing blood pathology.
Computer-aided diagnostics and cell segmentation are invaluable tools to help reduce the cost of human labor
and time. However, discrepancies in stain protocol and imaging hardware pose challenges to automated cell
recognition; noise, blur, lighting contrast, and irregular coloration confound cell differentiation. In this study,
we describe a linear pre-processing algorithm that addresses the color variation in hematology images. We
qualitatively examine the image outputs and quantitatively assess the efficacy of the proposed algorithm by
studying the performance of a cell detection model.
1 INTRODUCTION
Automatic imaging and computer processing are be-
coming integral parts of computer-aided pathology
analysis. Automated digital processes facilitate the
analysis of cell types and morphologies more quickly
and less subjectively than traditional manual pro-
cesses for blood smears. Despite attempts to stan-
dardize stain protocols and evaluation, current tech-
nology limits the complete standardization of blood
smear preparation. Variations in the chemical binding
of the stain and hardware (i.e. LED light unit, the dis-
tance from the light to the slide, etc.) may alter the
image viewed by the technician or computer. There-
fore, pre-processing steps that standardize the color
and contrast of images are valuable tools for improv-
ing cell identification results. Henceforth, we refer
to an unprocessed image that may vary in color con-
stancy as a “source image”, an ideal image as a “target
image”, and a processed source image as a “resulting
image”. In this study, we describe the development
of an efficient color correction algorithm, which we
will refer to as the ”LinPICT” (Linear, Pixel-Specific
Color Transfer). The primary goal of the proposed
algorithm is to efficiently standardize the coloration
of blood smear images to a target image while retain-
ing the details of the original image. The main fo-
cus of the LinPICT is on a data set of avian blood
smears. This dataset allowed us to identify the short-
comings of current histopathology color correction al-
gorithms. The new method is designed to be robust to
hematology images. In order to both improve the per-
formance of cell identification and drive down com-
puting cost, factors such as computational complex-
ity and time/memory usage were considered. We as-
sessed the robustness of the proposed algorithm with
a machine learning pipeline for blood cell identifica-
tion. The results show that the LinPICT increases
the detection mean average precision (mAP) of rarer
blood cell types.
2 BACKGROUND
2.1 Machine Learning in the Avian
Hematology Field
There is a lack of resources that address automated
blood cell identification. This is in part because
the standard method for counting blood cells in
mammals—flow cytometry—does not require whole-
slide image analysis. Therefore, while many digi-
tal pathology pre-processing algorithms are optimized
towards improving the quality of tissue sample im-
ages, few of these algorithms address blood cell im-
ages. Furthermore, because avian red blood cells
are nucleated, automated count machines cannot ac-
Lou, R. and Le, T.
A Linear, Pixel-specific Color Normalization Algorithm for Hematology Imaging.
DOI: 10.5220/0010344302010208
In Proceedings of the 14th International Joint Conference on Biomedical Engineering Systems and Technologies (BIOSTEC 2021) - Volume 2: BIOIMAGING, pages 201-208
ISBN: 978-989-758-490-9
Copyright
c
2021 by SCITEPRESS – Science and Technology Publications, Lda. All rights reserved
201

curately perform the blood cell estimates on avian
species. The standard procedure for processing avian
blood samples relies on a technician to manually in-
spect or count stained cells via hemocytometer. Cur-
rent practices are limited to physical quality-control
methods, and they do not allow for accurate cell dif-
ferentiation (Tavares-dias et al., 2008).
With advances in high-resolution image acqui-
sition and machine learning algorithms, computer-
aided medical image analysis has become a method
of choice for technicians and clinicians (Litjens et al.,
2017). In order to automate the process of cell differ-
entiation and estimation, measurable characteristics
of the peripheral blood smear must be defined.
The color distribution of a cell type is commonly
used as a parameter for identification and morphology
analysis (Khashman, 2008). For the avian data set,
object localization and classification methods may
misidentify rare white blood cell types due to their
physical similarities. Therefore, a color normalization
pre-processing technique that is specific to blood cells
is needed to improve the performance of the identifi-
cation pipeline.
2.2 Common Color Normalization
Algorithms
A robust technique for color correction involves the
derivation of image properties to acquire a stain nor-
malization object that maps from one color space
to another. Then, the stain normalization object
transforms the input image to the target. More
specifically, a heterogeneous group of unprocessed
images are used as standards to map a variety of
inputs to a target image. A color space refers
to the representation of the entire sum of colors
within a medium, of which the three main color
spaces are Grayscale, RGB (red/green/blue), and
CMYK (cyan/magenta/yellow/black) (Joblove and
Greenberg, 1978).
Existing algorithms differ mainly in the color nor-
malization technique used to incorporate color space
information. (Sun et al., 2010) (Anghel et al., 2019)
(Macenko et al., 2009). Reinhard et al. proposed a
method that maps the mean and standard deviation of
each color channel of the source images to the tar-
get image (Reinhard et al., 2001). This method ap-
plies a color transformation to each image, making it
possible to address distinct color variations between
images. Macenko et al. proposed a color deconvo-
lution method utilizing the characteristic staining of
hematoxylin and eosin to form a stain vector. The
Macenko et al. method employs a Single Value De-
composition (SVD) approach to estimate the values
Figure 1: Example Target Image. Stained with a modified
Wright-Giemsa stain. Image scanned at 40x objective on a
CFI Plan Apo camera model.
in the stain matrix. These methods can fail if the stain
matrix is calibrated incorrectly.
In order to overcome the limitations of color stan-
dardization, Khan et al. proposed the use of a stain
color descriptor (SCD) instead of a stain matrix to
quantify the relative amount of stain in an image
(Khan et al., 2014). The method also applies a ker-
nelized classifier that uses both the color and the SCD
to calculate image-specific stain matrices. Then, B-
splines create a non-linear mapping between the ideal
image and the input image.
Many of the challenges that tissue-imaging faces
are the same as those in hematology imaging. While
the aforementioned methods are efficacious in im-
proving segmentation for complicated tumor and
histopathology images, few methods perform well in
the hematology samples. Using data visualization
techniques, we found that the image data from hema-
tology images can be separated into components. We
developed a linear processing algorithm that is intu-
itive, efficient, and less likely to overfit.
3 METHODS
Samples were stained with a modification of the
Wright-Giemsa stain, dried, and cover-slipped. An
ideal target image (Figure 1) was selected from a bank
of images acquired by an automated microscope. Us-
ing the target image as a benchmark, a data set of 14
images that varied in appearance from the target im-
age was collected. These variations included color
tints (i.e. pink, purple, blue, yellow), hazy, and dirty
images. Image dimensions were 5472 x 3648 (total
19,961,856) pixels. Images were handled in the RGB
color space. Each of the source images was processed
using the LinPICT algorithm, described as follows:
Steps 1-3 are performed on both the target image
BIOIMAGING 2021 - 8th International Conference on Bioimaging
202
[ ]
[ ]
Ideal Image
(Target)
Input Image
(Source)
Create color
scheme for
each image
(Step 1, 2, 3)
Result
(transformed
image)
Classified
Pixels
Cluster
centers
Use spline
interpolation
to create
mapping
(Step 4)
Matrices
Apply mapping
to RGB values
of pixels of
input image
(Step 5)
Mapping
functions
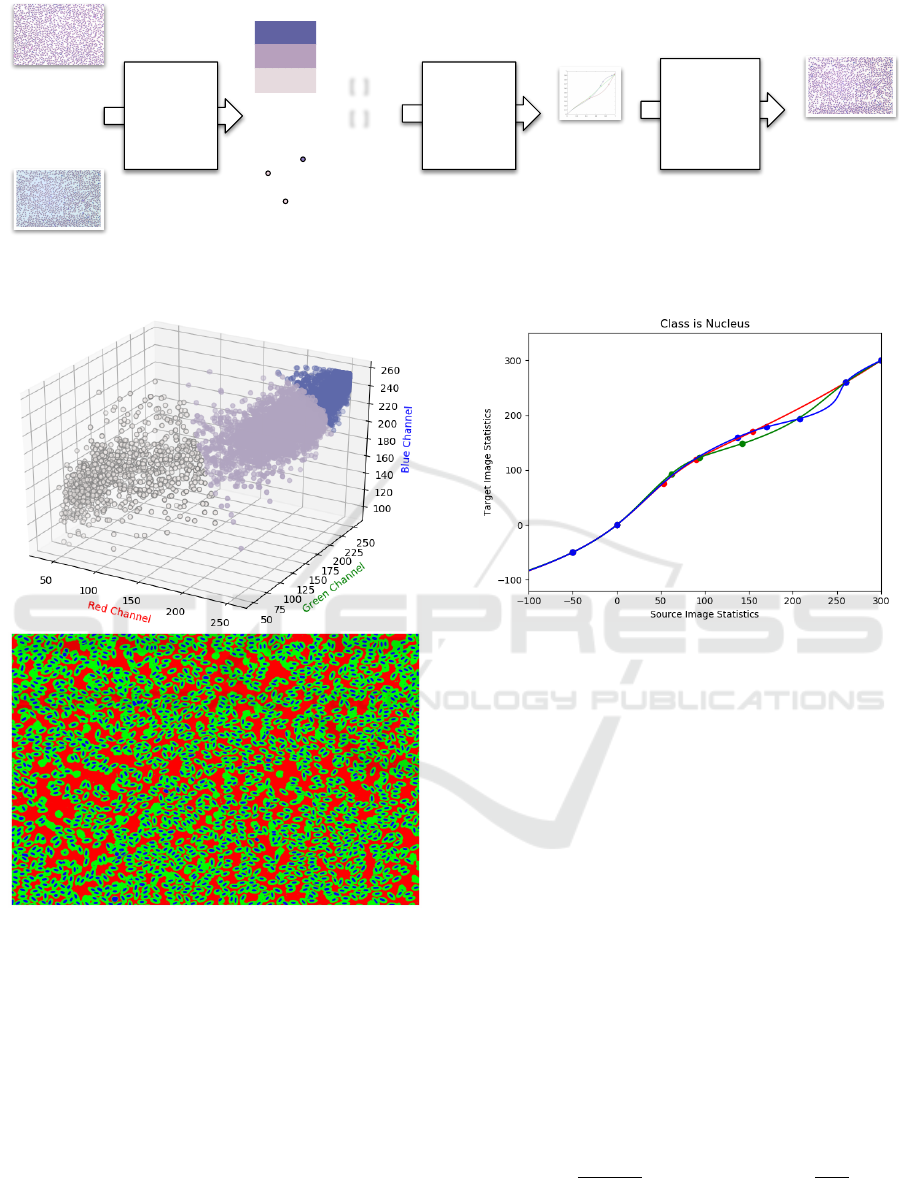
Figure 2: A graphical representation of the LinPICT color correction procedure.
Figure 3: Visualization of the clustering algorithm. A 3D
scatter plot of 10,000 randomly sampled pixels (Top). The
three axes are the RGB values, each point is a pixel. A
representation of a blood cell image after pixel-clustering
in Step 1 (Bottom). There is distinct separation between
the three clusters that represent the nucleus, cell body, and
background components.
and the source image. The information collected
from both images is then processed in steps 4-5.
1. Perform a Mini-Batch K-Means (Sculley, 2010)
clustering on 10,000 randomly-sampled pixels. K
is a pre-determined number of pixel clusters.
Consider (R, G,B) intensity values for each pixel
Figure 4: B-spline continuous linear mapping from source
image statistics to target image statistics for one cluster (nu-
cleus). The fixed points at the extremes of the inputs ensure
that the saturated and unsaturated pixels are not altered. The
data points are of the form (-50, 0, 0.5-quantile, mean, 0.95-
quantile, 260, 300, 400). The red, green, and blue curves
correspond to the R, G, and B data points, respectively.
p = (p
r
, p
g
, p
b
) ∈ P, where P is a sampled sub-
set of I, all the pixels in the image. p
j
represents
the intensity of one channel. The K-means algo-
rithm (Hartigan and Wong, 1979) minimizes the
squared Euclidean distance within K clusters of
pixels with cluster centroids m
k
.
P
∑
i
K
∑
k=1
||p
i, j
− m
k
||
2
(1)
2. The cluster contribution weight w
j,k
of the color
channel of each pixel is calculated using the soft-
max function on the Euclidean distance d
j,k
=
||p
i, j
− m
k
||
2
between the pixel intensity p
j
and
the cluster center m
k
, k ∈ K.
w
j,k
=
z
j,k
∑
K
i=1
z
j,i
, where z
j,k
= exp(−
d
j,k
d
min
) (2)
3. For each cluster k, compute the distributional
statistics of the clustered pixels (mean, 5%, and
A Linear, Pixel-specific Color Normalization Algorithm for Hematology Imaging
203

95% quantiles) to create a 3 × K matrix corre-
sponding to pixel (R,G,B) values for the cluster
statistic.
4. Map each color channel for each cluster from the
target image to the source image using B-spline
interpolation. Let N = {x
0
, . . . , x
m
} be a set of
given knots with a = x
0
< x
1
... < x
m
= b pixel
values.
Function S : x ∈ M → y ∈ M
0
is a cubic interpolat-
ing B-spline on [a, b] if S
i
is a cubic polynomial in
each interval [x
i
, x
i+1
] of N, is continuous every-
where and on the knots, and s(x
i
) = y
i
for given
values of y
i
(de Boor, 1980). The interpolation
produces a mapping y = S(x) where y is an array
of pixel intensities of the target image M
0
, and x
is an array of pixel intensities of the source image
M.
The interpolation points are an array of the clus-
ter color channel’s statistics (mean, 0.5-quantile,
and .95-quantile) and fixed points at the extremes
of the distribution (-50, 0, 260, 300, 400). RGB
pixel values range from 0 to 255. The fixed points
at the beginning and end of the data values en-
sure that saturated pixels of the input images black
(0, 0, 0) and white (255, 255, 255) remain largely
unchanged.
5. For each pixel p
i
in the source image I
S
, trans-
form the RGB channels with the corresponding S
j
color channel B-spline functions according to the
cluster k that p
i
belongs to. Linearly combine the
correction from the B-spline with the computed
weight (2). The RGB channels are corrected inde-
pendently for each pixel p
i
. The following func-
tion is for one color channel of a single pixel.
p
i
→ p
i0
=
∑
k∈K
S
j,k
(p
i, j
) ∗ w
j,k
(3)
p
i
∈ I
S
, the set of all pixels of the source image.
p
i
0 ∈ I
R
, the set of all pixels in the resulting image.
Figure 2 is a flowchart with a graphical descrip-
tion of the LinPICT algorithm. We found that for the
19,961,856 pixel images, a random sample of 10,000
pixels allowed for fast computing times while still
capturing the shape of the original distribution (Fig-
ure 3).
In the avian sample set, the nucleus tends to stain a
dark purple, and the cell body stains light purple/pink.
The background is usually a light color or white. The
distinct separation of colors between classes C where
C ∈ [NUCLEUS, CELL BODY, BACKGROUND],
as seen in Figure 3, allows definition of class mem-
bership by the RGB value of a pixel. Therefore, seg-
menting pixels by color into K = 3, via the red channel
in this case, effectively separates pixels by class.
For each color channel of each class, we mapped
the statistics of the source color distribution to the tar-
get color distribution with a B-spline-based continu-
ous smooth mapping. The principles of mapping dis-
tribution statistics using a B-spline and fixing the end-
points are inspired by Khan et al. (Khan et al., 2014).
Figure 4 illustrates this process.
4 EXPERIMENTS
Table 1: Average computational time (in seconds) for each
color normalization algorithm on one 19,961,856 pixel im-
age.
Algorithm Macenko Reinhard LinPICT
Time (s) 6.4 307.2 19.6
Table 2: SSIM index for an image compared to a trans-
formed version of itself. The image was distorted with a
red filter and then corrected with a color normalization al-
gorithm.
Transformation SSIM
Red filter .93
Red filter + Macenko .95
Red filter + Reinhard .98
Red filter + LinPICT .99
In order to test the robustness of the LinPICT, we em-
ployed a machine learning cell detection pipeline on
a data set of 1,894 labeled images. The images of the
data set were previously annotated and verified by a
trained pathologist.
To compare normalization algorithms, we also ap-
plied the Macenko et al. normalization color algo-
rithm and the Reinhard et al. color transfer algorithm
on the data set, both of which are publicly available on
GitHub. All programs were written in Python and run
on a Windows 10 i5-469K CPU with 32 GB RAM.
Table 1 describes the average processing times of
the Macenko et al., Reinhard et al., and the LinPICT
algorithms, including the time to read input and save
the output image. The Macenko transformation was
the fastest at 6.4 seconds, and it produced images nor-
malized to a hematoxylin and eosin stain. The Rein-
hard et al. transformation was the slowest at 307.2
seconds and produced images that were visually sim-
ilar to the target image (Figure 1). The proposed algo-
rithm performed at an intermediate time of 19.6 sec-
onds and produced images visually similar to the tar-
get image, which was verified by a high SSIM index
(>.96).
BIOIMAGING 2021 - 8th International Conference on Bioimaging
204
Figure 5: Comparison of color correction algorithm performance on hematology slide images (rows 1-11). Original photo
(column a), Macenko et al. transformation (column b), Reinhard et al. transformation (column c), and proposed algorithm
LinPICT (column d).
A Linear, Pixel-specific Color Normalization Algorithm for Hematology Imaging
205
(a) (b)
(c) (d)
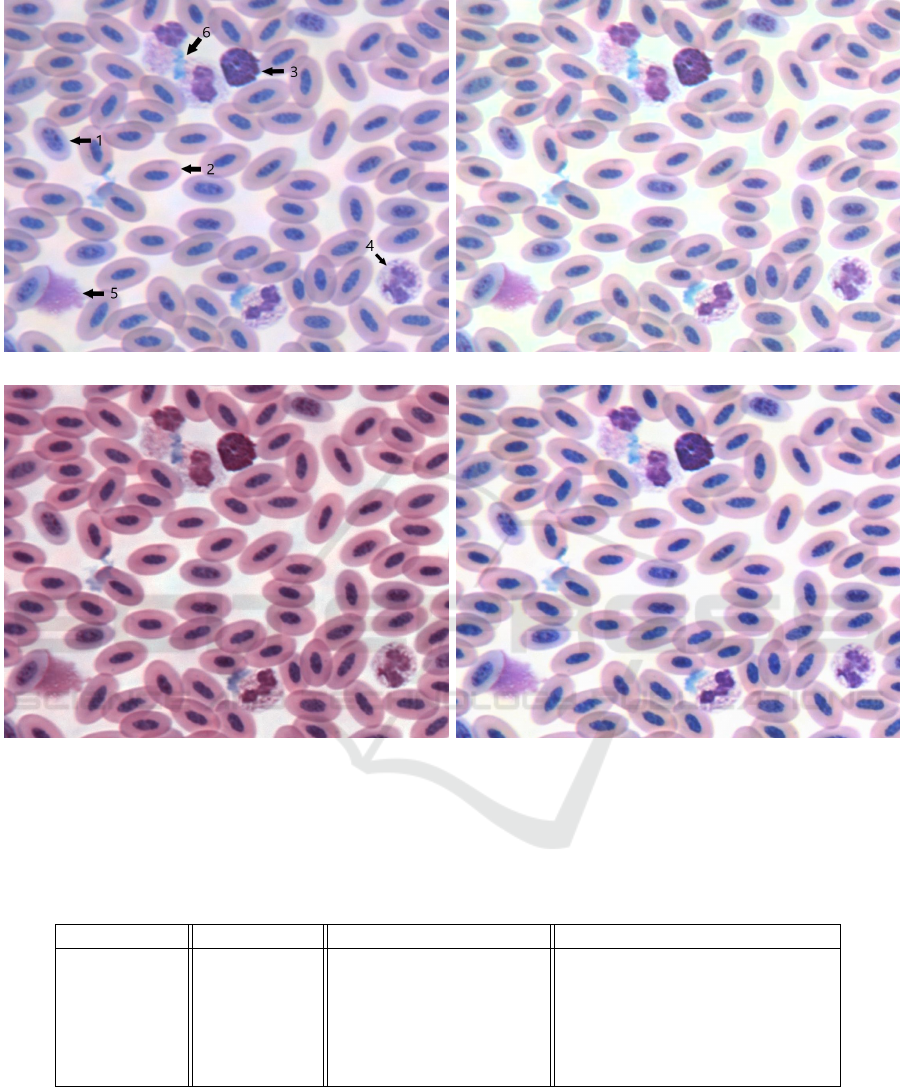
Figure 6: Four versions of a section of blood smear from Ara ararauna (blue-and-gold macaw). Image taken at 40X objective
and enlarged x4 for detail. Specific features of the smear: (1) immature erythrocyte (2) mature erythrocyte (3) basophil
(4) heterophil (5) smudge cell (6) staining artifact are labelled with arrows on the original photo (a) for ease of comparison
between the correction algorithms (b) Reinhard algorithm (c) Macenko algorithm (d) LinPICT algorithm. The target color
palette is that of Figure 1.
Table 3: Comparison of LinPICT performance on detection of labeled cell data.
# of instances Cell Class mAP of Original Dataset mAP of Color-Corrected Dataset
671 Heterophil 0.98 0.99
427 Lymphocyte 0.98 0.98
86 Monocyte 0.85 0.86
56 Basophil 0.95 0.94
56 Eosinophil 0.31 0.38
598 Thrombocyte 0.97 0.96
Table 2 shows the SSIM index (between 0 and 1),
a method for measuring the similarity between two
images (Wang et al., 2004). The two images com-
pared are the original image and the original image
transformed with a color normalization algorithm fol-
lowing distortion with a red filter.
Table 3 describes the performance of a machine
learning cell identification pipeline. The performance
of the object detection task is measured by the mAP
metric. The results show that when the input dataset
is normalized with the LinPICT, the mAP score in-
creases 7 percentage points (from .31 to .38) in the
BIOIMAGING 2021 - 8th International Conference on Bioimaging
206

eosinophil, a rare blood cell type. There is a slight de-
crease (< -1 percentage point) in the score of throm-
bocyte and a slight increase (≤ +1 percentage point)
in the scores of the heterophil, lymphocyte, mono-
cyte, and basophil.
Figure 5 compares the transformed resulting im-
ages of the dataset for the common normalization al-
gorithms. The results show clear differences between
the vibrancy, differentiation, and cleanliness of the
outputs. Figure 6 shows a section of a corrected im-
age, enlarged for detail to display cells and staining
artifacts.
5 DISCUSSION
LinPICT is an intuitive computational algorithm be-
cause it scales linearly and provides a suitable modi-
fication for images with few color palettes. This study
demonstrates the appropriateness of the K-means sep-
aration with 3 classes for blood cell images.
The results of the Macenko et al. images in Fig-
ure 5 demonstrate that color normalization can fail if
an inappropriate mapping is used or if the normaliza-
tion matrix is not calibrated correctly. Although this
algorithm is the fastest of the methods tested (Table
1), the cells are transformed to a magenta hue (Fig-
ure 5-column b). Fine color differentiation between
different cells is lost (Figure 5-8b, 1b), such as be-
tween the basophil and heterophil in Figure 6-c. Ad-
ditionally, the algorithm is not robust to correcting a
hazy or colored background (Figure. 5-4b, 10c, 2c).
The Reinhard et al. model assumes a uni-modal
distribution of pixels. Because of this, the model does
not perform well on complex color spaces. In these
samples, the background region is incorrectly mapped
to a color region (Figure. 5-9c), or discoloration in
the background is not removed (Figure 5-8c, 10c)
(Figure 6-b). Although the color palette of the Rein-
hard et al. images (Figure 5-column c) is similar (Ta-
ble 2) to that of the ideal image (Figure 1), the expen-
sive computational time of 307.6 seconds (Table 1)
is inhibitory for many time and space complexity-
prohibitive applications.
The LinPICT is superior in its background correc-
tion (Figure 5-3d, 4d, 5d, 6d, 8d, 10d, 11d). This is
because the color correction is specific to each class,
and the color channel mappings are independent of
each other. The algorithm produces images that are
similar to the target image (Table 2). Furthermore, un-
like the other algorithms tested, the LinPICT is robust
to capturing the color variation of samples with poly-
chromasia—a blood disease indicated by red blood
cells staining many different colors (Figure 5-4d).
We adapted relevant methods, such as class sepa-
ration and spline-mapping, from the Khan et al. study.
Khan et al.’s algorithm uses a two-class relevance vec-
tor machine classifier to group classes for histology
images. The LinPICT uses a soft k-means unsuper-
vised clustering approach, which allows for more tar-
geted correction of hematology images. The algo-
rithm does not require the overhead estimation of a
stain vector or the calculation of co-variance for prin-
cipal component analysis because it is run on the as-
sumption of equivalent image components. Hence,
batches of images can be processed independently in
parallel. Thus, the method is easily adaptable to new
samples and suitable for an individual image acquisi-
tion and analysis pipeline. While this study was car-
ried out in the RGB color space, the transformation
can be directly carried over to other color models or
representations.
The LinPICT method requires the intermediate
step of classifying model parameters for each image
and is thus more computationally expensive during
runtime than a model that estimates a stain vector us-
ing SVD. The method is best-suited towards data that
can be separated and matched into components. In
this study, the red intensity value gradation allowed
for the matching of clusters to the image components.
Under this condition of differentiation, the model will
continue to perform well on images with numerous
components while maintaining linear time complex-
ity.
An important consideration in assessing the effi-
cacy of the model is the subjectivity of choosing a
target image as the individual user must determine the
ideal levels of cell density, coloration, distinction be-
tween cell types, and contrast. A future study may
include cross validating the accuracy of various target
images to determine the ideal target.
The LinPICT model is an efficient pre-processing
procedure ideal for standardizing stain appearance
in hematology images. Information from digital
morphological analysis aids the diagnosis of blood
pathologies, such as anemia and leukemia, but the
present gold standard is limited to manual segmen-
tation strategies for exotic species. Coupled with the
developments in information technology and digital
imaging, the LinPICT algorithm may increase auto-
matic segmentation accuracy, saving time and labor
costs and improving diagnostic quality.
REFERENCES
Anghel, A., Stanisavljevic, M., Andani, S., Papandreou, N.,
R
¨
uschoff, J. H., Wild, P., Gabrani, M., and Pozidis, H.
A Linear, Pixel-specific Color Normalization Algorithm for Hematology Imaging
207

(2019). A High-Performance System for Robust Stain
Normalization of Whole-Slide Images in Histopathol-
ogy. Frontiers in Medicine, 6(September):1–13.
de Boor, C. (1980). A Practical Guide to Splines. Mathe-
matics of Computation, 34(149):325.
Hartigan, J. A. and Wong, M. A. (1979). Algorithm as
136: A k-means clustering algorithm. Journal of the
Royal Statistical Society. Series C (Applied Statistics),
28(1):100–108.
Joblove, G. H. and Greenberg, D. (1978). Color Spaces for
Computer Graphics. In Proceedings of the 5th An-
nual Conference on Computer Graphics and Interac-
tive Techniques, SIGGRAPH ’78, page 20–25, New
York, NY, USA. Association for Computing Machin-
ery.
Khan, A. M., Rajpoot, N., Treanor, D., and Magee, D.
(2014). A nonlinear mapping approach to stain
normalization in digital histopathology images using
image-specific color deconvolution. IEEE Transac-
tions on Biomedical Engineering, 61(6):1729–1738.
Khashman, A. (2008). Short communication IBCIS : In-
telligent blood cell identification system. Progress in
Natural Science, 18:1309–1314.
Litjens, G., Kooi, T., Bejnordi, B. E., Setio, A. A. A.,
Ciompi, F., Ghafoorian, M., van der Laak, J. A., van
Ginneken, B., and S
´
anchez, C. I. (2017). A survey
on deep learning in medical image analysis. Medical
Image Analysis, 42(1995):60–88.
Macenko, M., Niethammer, M., Marron, J. S., Borland, D.,
Woosley, J. T., Guan, X., Schmitt, C., and Thomas,
N. E. (2009). A method for normalizing histology
slides for quantitative analysis. Proceedings - 2009
IEEE International Symposium on Biomedical Imag-
ing: From Nano to Macro, ISBI 2009, pages 1107–
1110.
Reinhard, E., Ashikhmin, M., Gooch, B., and Shirley, P.
(2001). Color transfer between images. IEEE Com-
puter Graphics and Applications, 21(5):34–41.
Sculley, D. (2010). Web-Scale k-Means Clustering. In
Proceedings of the 19th International Conference on
World Wide Web, WWW ’10, page 1177–1178, New
York, NY, USA. Association for Computing Machin-
ery.
Sun, Y. N., Wang, Y. Y., Chang, S. C., Wu, L. W., and Tsai,
S. T. (2010). Color-based tumor tissue segmentation
for the automated estimation of oral cancer parame-
ters. Microscopy Research and Technique, 73(1):5–
13.
Tavares-dias, M., Oliveira-j
´
unior, A. A., and Marcon, J. L.
(2008). Methodological limitations of counting total
leukocytes and thrombocytes in reptiles ( Amazon tur-
tle , Podocnemis expansa ): an analysis and discus-
sion. Acta Amazonica, 38(2):351–356.
Wang, Z., Bovik, A. C., Sheikh, H. R., and Simoncelli, E. P.
(2004). Image quality assessment: From error visi-
bility to structural similarity. IEEE Transactions on
Image Processing, 13(4):600–612.
BIOIMAGING 2021 - 8th International Conference on Bioimaging
208
