
Discrete Wavelet based Features for PCG Signal Classification using
Hidden Markov Models
Rima Touahria
1,3
, Abdenour Hacine-Gharbi
1a
and Philippe Ravier
2b
1
LMSE Laboratory, University of Bordj Bou Arréridj, Elanasser, 34030 Bordj Bou Arréridj, Algeria
2
PRISME Laboratory, University of Orléans - INSA CVL, 12 rue de Blois, 45067 Orléans, France
3
ETA Laboratory, University of Bordj Bou Arréridj, Elanasser 34030 Bordj Bou Arréridj, Algeria
Keywords: PCG Signal, Features Extraction, Discrete Wavelet Transform, Wavelet Cepstral Coefficients, MFCC
Coefficients, Hidden Markov Model, Classification.
Abstract: This paper proposes the use of several features based on Discrete Wavelet Transform as novel descriptors for
the application of classifying normal or abnormal phonocardiogram (PCG) signals, using Hidden Markov
Models (HMM). The feature extraction of the first descriptor called “DWE” consists in converting each PCG
signal into a sequence of features vectors. Each vector is composed of the energy of the wavelet coefficients
computed at each decomposition level from an analysis window. The second descriptor “LWE” consists in
applying the logarithm of DWE features, while the third descriptor “WCC” applies the DCT on the LWE
features vector. This work aims to find the relevant descriptor using PCG Classification Rate criterion. This
is achieved by implementing a standard system of classification using the HMM classifier combined with
MFCC features descriptor. Each class is modeled by HMM model associated to GMM model. Several
experiences are carried out to find the best configuration of HMM models and to select the optimal mother
wavelet with its optimal decomposition level. The results obtained from a comparative study, have shown that
the LWE descriptor using Daubechies wavelets at order 2 at level 7, gives the highest performance
classification rate, with a more compact features representation than the MFCC descriptor.
1 INTRODUCTION
Before the 19th century, physicians used the ear as a
way to listen to the sound emitted by heartbeats in
order to identify heart operation state, which can be
useful for diagnosing heart disease. This method of
"immediate hearing" on the chest or the back is a very
rudimentary approach for physicians having led to
dissatisfaction with it. In 1816 Isaac invented a
medical instrument called the "stethoscope", which is
an exciting and practical new method of bedside
examination. This instrument is widely used to
diagnose heart disease (Hanna & Silverman, 2002).
Despite its approval, this requires a long-term
practice and several years of clinical experience is
necessary and is difficult to obtain. This led doctors
and researchers to develop techniques for helping
cardiac auscultation. This need gave birth to
electronic stethoscopes, which have the advantage of
being able to record, store and replay the sounds in
a
https://orcid.org/0000-0002-7045-4759
b
https://orcid.org/0000-0002-0925-6905
better conditions, for diagnostic purposes (Jiang &
Choi, 2006) (Moukadem, Dieterlena, Hueberb, &
Brandtc, 2013).
The heart sound signal of a normal heartbeat has
two sounds. The first heart sound, a lub of "lub-dub"
(S1), corresponds to the systolic period. The second
heart sound, a dub (S2) of "lub-dub", corresponds to
the diastolic period. These sounds are caused by the
closing and opening of valves inside the heart
(Kumar, et al., 2006). A normal heartbeat sound has
an out of rhythm "lub ... dub...". Doctors can find
heart additional or abnormal sounds from listening to
sound with rhythm “lub-lub…dub, lub…dub-dub”
(Gomes & Pereira, 2012) (Raza , et al., 2019).
The classification phase usually comprises three
steps: pre-processing, feature extraction and
classification model. First, pre-processing is an
important step in the data mining process for
eliminating noise and cleaning the heartbeat signal,
and this is done using a band pass filter. The
334
Touahria, R., Hacine-Gharbi, A. and Ravier, P.
Discrete Wavelet based Features for PCG Signal Classification using Hidden Markov Models.
DOI: 10.5220/0010343003340340
In Proceedings of the 10th International Conference on Pattern Recognition Applications and Methods (ICPRAM 2021), pages 334-340
ISBN: 978-989-758-486-2
Copyright
c
2021 by SCITEPRESS – Science and Technology Publications, Lda. All rights reserved

extraction of characteristics is an essential stage, from
which the classification system is carried out; this
step transforms each heartbeat sound signal into to
sequence of vectors. The choice of characteristics is
essential and is done by the system designer
following many considerations: the main motivation
is to choose features as discriminatory as possible;
also the greater the number of characteristics, the
more complex the classification system and the
longer the learning time, which makes the real-time
implementation more difficult. Several studies related
to classification and pattern recognition have been
introduced in the past using techniques such as
wavelet transform (WT), Mel-Frequency Cepstral
Coefficients (MFCC), ensemble empirical mode
decomposition, multi-fractal decomposition and
Shannon energy (Chen, et al., S1 and S2 heart sound
recognition using deep neural networks, 2016) (Chen,
Yang, & Ho, S1 and S2 Heart Sound Recognition
Using Deep Neural Networks, 2017) (Gupta,
Palaniappan, Swaminathan, & Krishnan, 2007)
(Alajarin, 2007). In many studies, Hidden Markov
Models (HMM) were used for PCG modelling and
analysing, in conjunction with short-time Fourier
transform coefficients (STFT). The mel-scaled WT
were used to classify signals of heart sounds in
(Wang, Lim, Chauhan, Foo, & Anantharaman, 2007).
Conjunction of signal amplitude and MFCC
coefficients with HMM were used in (Chauhan,
Wang, Lim, & Anantharaman, 2008) and the same
idea were also applied using DFT and principal
component analysis in (Saracoglu, 2012).
In this study, we propose to apply a feature
extraction method based on Discrete wavelet
Transform (DWT), mostly inspired by research in
speech processing (Didiot, Illina, Fohr, & Mella,
2010) and in electrical appliances identification
(Hacine-Gharbi & Ravier, 2018). This method can
extract three descriptors called respectively DWE
(Discrete Wavelet Energy), LWE (Log Wavelet
Energy) and WCC (Wavelet Cepstral Coefficients).
The DWE descriptor extraction consists to convert
each PCG signal into a sequence of features vectors
obtained each one by computing the energy at each
level of dyadic wavelet decomposition from an
overlapping analysis window. The LWE descriptor
applies the logarithm on the features of DWE
descriptor, while the WCC descriptor applies DCT
transform on the features of LWE descriptor. The aim
of this work is to investigate the relevance of these
descriptors by comparing them with the traditional
MFCC descriptor for the task of PCG signals
classification, in terms of classification rate and
complexity.
The remainder of this paper is organized as
follows. In Section 2, we discuss sound classification,
features extraction approaches and we introduce the
proposed approach and detail each algorithm step.
Experimental results and discussion are presented in
Section 3. We end up by a conclusion and
perspectives concerning future work.
2 CLASSIFICATION OF PCG
SIGNAL
2.1 Dataset
In order to test our methods, we used the PASCAL
Classifying Heart Sounds Challenge database
(Bentley, Nordehn, Coimbra, Mannor, & Getz, 2011).
Database comprises 176 recordings for heart sound
segmentation. More details about the challenge
dataset can be found in (Liu, et al., 2016). During
evaluation, we use only 621 cardiac cycles (beat)
including 204 pathological cardiac cycles. This
extraction and recording is carried out using the
PRAAT software. For each version of the signal, a
labelling file is created in text format, containing the
transcription of the signal in a sequence of labels.
These labels are the normal and abnormal classes
Each beat belongs either to the normal class (label
‘N’) or to the pathological class (label ‘AN’). Each
PCG signal was then resampled to 16000Hz.
Table 1 summarizes the distribution of the
training and testing sets composing the PASCAL
database.
Table 1: Distribution of the testing and training record
numbers of the PASCAL database.
Classes Normal Abnormal
Numbe
r
417 204
Test/Train 121/296 58/146
2.2 Proposed Feature Extraction
Method
In order to classify the heart sound components, many
authors have proposed the use of the MFCC descriptor
(Rahmandani, Nugroho, & Setiawan, 2018) (Nilanon,
Yao, Hao, & Purushotham, 2016) (Numan, et al.,
2019). This last descriptor is a perceptual
representation of the power spectrum of a sound
signal. It is obtained by taking the Discrete Cosine
Transform (DCT) of the logarithmic power spectrum
on a nonlinear mel-scale of frequency by using the
Discrete Wavelet based Features for PCG Signal Classification using Hidden Markov Models
335
following frequency transformation (Wu, Kim, &
Bae, 2010):
𝑀𝑒𝑙
𝑓
2595𝑙𝑜𝑔
1
𝑓
700
(1)
The features extraction operation from PCG
signals requires the computation of 39 dimension
vectors per frame including static features and energy
with their dynamic features. When MFCC is used,
acceptable results for clean heart sounds are obtained.
However, the results are sensitive to the recording
frequency and the performance is not as good in a
noisy environment. This is based on the results of
many studies (Numan, et al., 2019) (YaseenSonG &
Kwon, 2018) (Li, et al., 2019), whereby the latter
indicates that the new extracted feature is more
suitable and shows stronger anti-interference ability
for heart sound signals representation than that of the
MFCC. The results show a remarkable classification
performance in detecting the noisy class accurately. At
least, the MFCC feature vectors require high
dimensionality computation.
To overcome this limitation P. Wang et al. have
proposed to replace the MFCC by the mel-scaled WT.
This method applies the wavelet transform to the mel-
spectrum of the phonocardiogram (Wang, Kim, &
Soh,2005). Their suggested method has produced
encouraging results compared with those obtained
achieved using the MFCC.
Many other wavelet features can be further
computed from discrete wavelet coefficients, namely
Discrete Wavelet Energy (DWE), Log Wavelet
Energy (LWE) and Wavelet Cepstral Coefficients
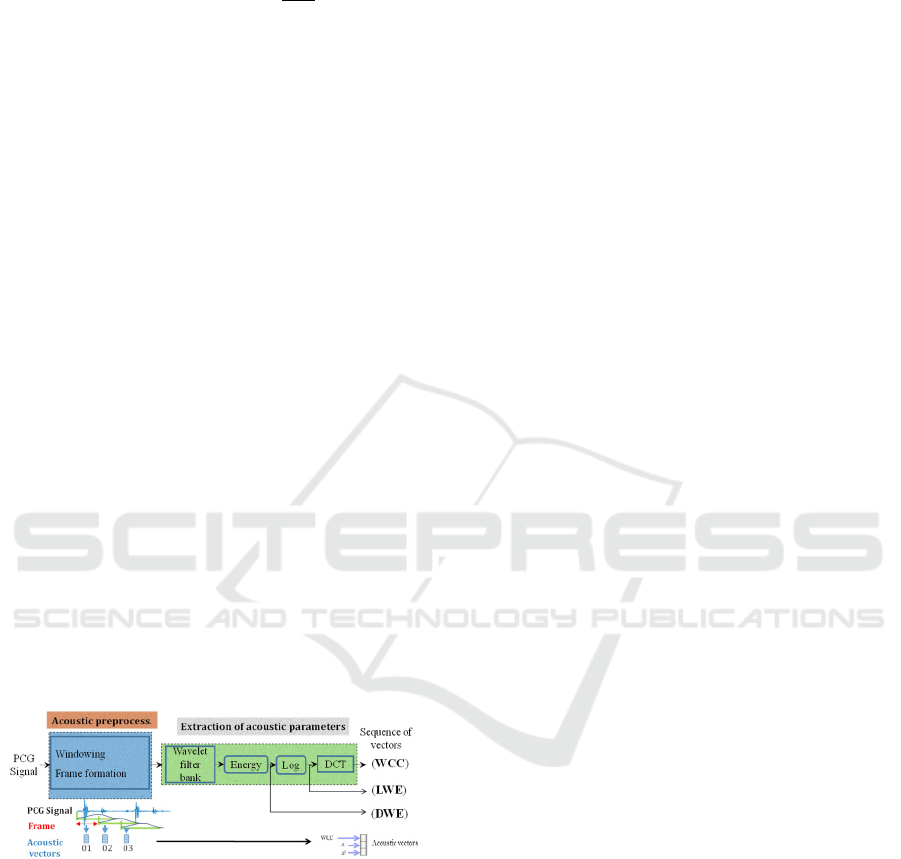
(WCC), as depicted in Figure 1.
Figure 1: block diagram describing the process of wavelet
cepstral coefficient (WCCs), discrete wavelet energy
(DWE) decomposition-based calculus and log wavelet
decomposition-based energy (LWE) features extraction
with Hamming windowing.
The idea of using DWE, LWE and WCC as the
feature set for a PCG classification system comes from
the success of wavelet cepstral coefficients for speaker
identification (Lei & Kun, 2016) and also because
PCG and speech are both acoustic signals. Our
acoustic analysis approach consists in extracting the
DWE, LWE and WCC descriptors for short-term
feature extraction with low dimensionality of the
features vectors. The LWE descriptor consists in
calculating the log of the energy of the wavelet
coefficients at each decomposition level without DCT
transform in order to keep the interpretation of a
descriptor representing energies in frequency bands.
The flowchart of DWE, LWE and WCC extraction
method used in this paper is shown in Figure 1. The
whole procedure was carried out in the four steps
given as follows:
Step 1: Preprocessing: this step goes through the
following operations (Nabih-Ali, EL-Sayed,
El-Dahshan, Ashraf, & Yahia, 2017):
The PCG data is segmented into 20ms-
overlapping frames, with 10ms overlap
between them.
Hamming window is applied on these
20ms portions.
Step 2: CWT is the continuous version of WT
which principle remains similar when going
to the DWT discrete version. However, the
application of DWT requires that the scales
used by the wavelet and their positions are
sampled down by a factor of two (or up for the
inverse DWT). This is called the dyadic scale.
In practice, DWT is simply computed by
using a filter bank for constructing the multi
resolution time-frequency plane. The filter
bank is achieved using a half-band low pass
filter and a half-band high pass filter. In the
iterative wavelet decomposition procedure,
the low-frequency coefficients are called the
approximations (𝑎
), while the high-
frequency coefficients are called the details
(𝑑
).
The DWT coefficients 𝑎
𝑛 and 𝑑
𝑛 are
calculated, at each level 𝑗, by the following formula:
𝑎
𝑛
𝑎
𝑙2𝑛
𝐿
𝑙
for
𝑗
1,… ,𝑝
(2)
𝑑
𝑛
𝑎
𝑙2𝑛
𝐻
𝑙
(3)
where the analyzed signal is of length N2
. The
notations 𝐿 and 𝐻 represent the low-pass and high-
pass filters, respectively.
As a result of this step, we obtain a feature vector,
which is called Discrete Wavelet decomposition-
based calculus Energy (DWE) and which is evaluated
as:
𝐷𝑊𝐸𝑑
𝑑
𝑛
for
𝑗
1,… ,𝑝
(4)
ICPRAM 2021 - 10th International Conference on Pattern Recognition Applications and Methods
336
𝐷𝑊𝐸𝑎
𝑎
𝑛
(5)
The number of samples is 𝑁
𝑁/2
at each
level 𝑗, which means that this number is reduced by a
factor 2 at each iteration from (1 to 𝑝.
Step 3: The previous step allows the calculation of
another descriptor called LWE. This last is the
log of energy at each level of dyadic
decomposition. It writes:
𝐿𝑊𝐸𝑑
𝑙𝑜𝑔 𝑑
𝑛
for
𝑗
1,…,𝑝
(6)
𝐿𝑊𝐸𝑎
𝑙𝑜𝑔 𝑎
𝑛
(7)
Step 4: The previous step finally allows further
computation of WCCs, which are the results of
the application of the inverse discrete cosine
transform (DCT) on the logarithmic values of
energies. This homomorphic analysis has the
effect of making the obtained coefficients less
correlated with each other.
Previous results described in (Hacine-Gharbi &
Ravier, 2018), in the field of electrical appliances
identification, showed that the WCC performed good
results, in terms of appliance identification rate.
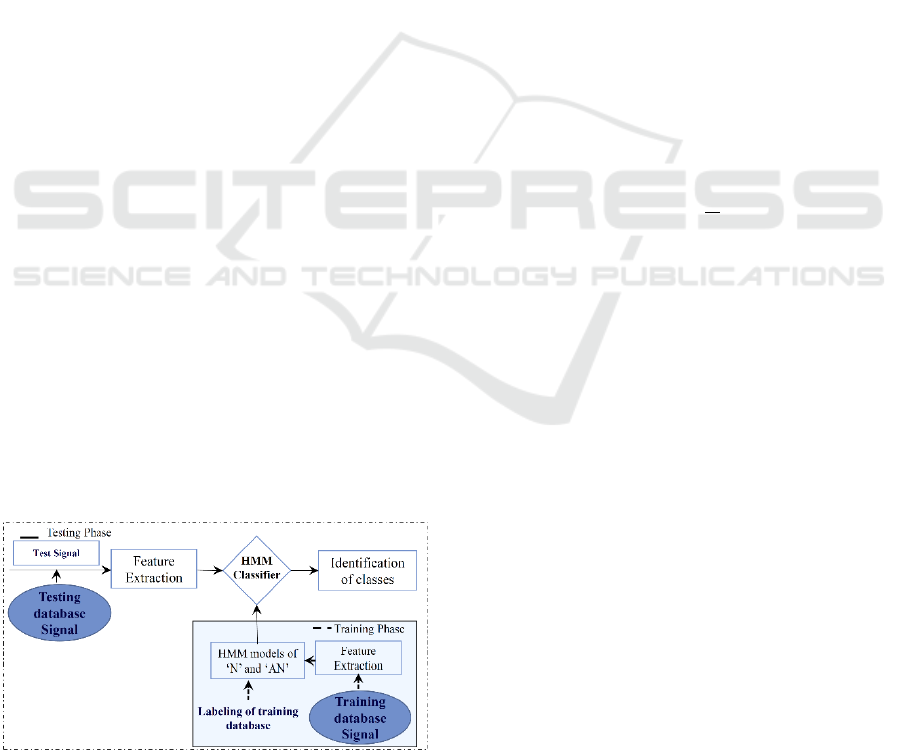
2.3 Hidden Markov-based
Classification System
The classification system design of heartbeat sound is
divided into two phases, the training and testing
phases as shown in Figure 2. Therefore, we split the
dataset (Bentley, Nordehn, Coimbra, Mannor, & Getz,
2011) into two sets with a proportion of 70% for
training and 30 % for testing data. The two phases
require feature extraction step, which consists in
dividing each signal in overlapped windows and
converting each window into features vector.
Figure 2: Flow chart outlining the procedure of the
proposed classification system.
Hence, this step converts each signal into a sequence
of features vectors.
In the training phase, the data are learned by
modelling the signals of each class by a HMM model
associated with GMM (Gaussian Mixture Model)
model. The feature extraction techniques are applied
in order to produce input data to the system for class
learning.
In the testing phase, the temporal signal is
transformed into a sequence of feature vectors which
are used as input data for the HMM classifier.
Finally, the evaluation of the implemented system
is done by using the decision results given by the
classifier knowing the ground truth given by the
expert notations. Appropriate statistics will be used
for this performance evaluation task.
2.4 Performance Evaluation
The overall performance of the PCG signal
classification was evaluated by the computation of
classification rate (CR) given by the Accuracy value
𝐴𝑐𝑐
provided by the HMM Toolkit library
software (HTK) (Young, Kershaw, Odell, & Ollason,
1999) and is calculated as follows (Young, Kershaw,
Odell, & Ollason, 1999):
𝐴
𝑐𝑐
𝐻
𝑁
(8)
where N is the total number of PCG signals given
at the input of the classifier, and H is the number of
the PCG signals correctly classified.
3 EXPERIMENTAL RESULTS
3.1 Experiments
Each heartbeat is modeled by a N
HMM. Each
state is modeled by a GMM with N
Gaussians
of frame size of 20ms. The implementation of the
system is carried out using the HTK library (Young,
Kershaw, Odell, & Ollason, 1999). The performance
of this classification is performed in terms of CR.
The following section, which is structured in two
parts, presents the experimental results. In the first
part, we compare the performance of the new features
to that of other features. In a second part, we carry out
an experiment to select the optimal mother wavelet
for the best previous descriptor and decomposition
level.
Discrete Wavelet based Features for PCG Signal Classification using Hidden Markov Models
337
3.2 Results and Discussion
3.2.1 Comparative Study between Different
Features
Table 2 shows the best possible classification results
with optimal number of states and optimal number of
Gaussian components N
when varying the
States from 2 to 12 and varying the N
from 1
to 96 (taking 8 values of N
:
1,2,3,6,12,24,48,96). The features vector was
computed with sliding Hamming windows of 20ms
and 50% of overlapping (Nabih-Ali, EL-Sayed, El-
Dahshan, Ashraf, & Yahia, 2017).
By observing the results of each column, we can
find that the best performance is achieved when the
optimal number of states is set to 10 for the feature
descriptor (LWE) with CR of 92.74%. Using the
MFCC features, the baseline algorithm yielded the
poorest CR of 87.71 % with the configuration of 39
dimensional feature vector. In the light of these
results, we can conclude that the model, which uses
LWE features, obtained higher CR with respect to the
other wavelet features and the MFCC descriptors.
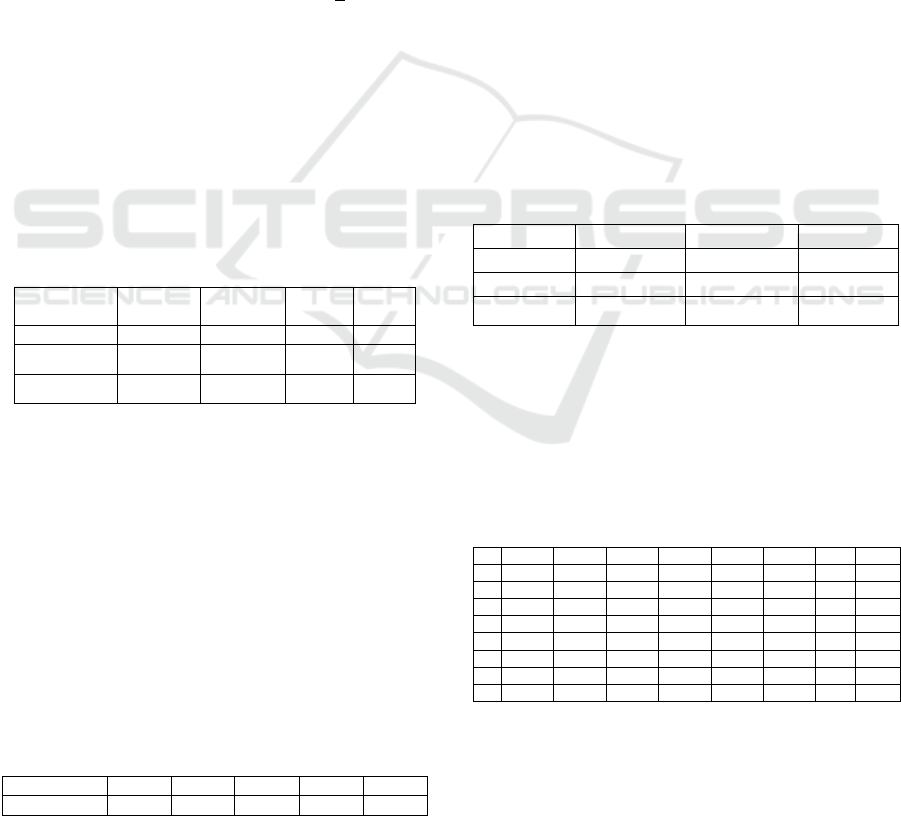
Table 2: Comparison of ACC
_HTK
(%) for different features
extractions descriptors techniques using Daubechies (db2)
at level 7 for the hmm optimal number of states (Lekram &
Abhishek, 2014). The features number is given for each
descriptor.
MFCC
(39)
DWE
(8)
LWE
(8)
WCC
(8)
𝐍
𝐒𝐭𝐚𝐭𝐞𝐬
9 8 10 8
𝐍
𝐆𝐚𝐮𝐬𝐬𝐢𝐚𝐧𝐬
2 2 3 3
𝐀𝐜𝐜
𝐇𝐓
𝐊
%
87.71 88.27 92.74 89.94
3.2.2 Optimal LWE Parameterization
Window Duration. Table 3 shows the CR results for
different window duration values. The Db 2 wavelet
and a decomposition level 7 are considered in this
experiment for the classification system (Lekram &
Abhishek, 2014). By analyzing the results in Table 3,
we can find that the maximum CR (Acc
HTK
) in each
column is achieved when the window size equals
20ms, the best CR of 92.74% was reached in this
table. Therefore, it is desirable to select a window
duration of 20ms.
Table 3: Acc
HTK
(%) for different combinations of the
window size.
Wind. size 60ms 50ms 40ms 30ms 20ms
𝑨𝒄𝒄
𝑯𝑻𝑲
%
87.71 88.27 88.83 89.39 92.74
Wavelet Family and Decomposition Depth. In this
part, the smoothness and the impact of the wavelet
family on the CR
is evaluated. This study intended to
define the optimal mother wavelet with its optimal
decomposition level. In the present work, the
following wavelet families are considered:
the Daubechies family with orders going
from 1 to 8: Db1, Db2, ..., Db8;
the Coiflets family with orders going from 1
to 5: Coif1, Coif2..., Coif5;
the Symlets family with orders going from 1
to 8: Sym1, Sym2, ..., Sym8.
We used the optimal system configuration
identified in the previous studies, which is composed
of ten HMM states, where each state is represented by
a three Gaussian mixture.
The results are given in Table 4, where the highest
CR value of 92.74% was achieved when using
Daubechies wavelet of order 2 and a decomposition
level of 7.
Table 4: Comparative results between different kinds of
wavelet families. The table shows the Acc
HTK
values for the
optimal decomposition level as well as the optimal order for
each wavelet family.
Daubechies Symlet Coiflets
level 7 2 6
order 2 2 1
𝐀𝐜𝐜
𝐇𝐓
𝐊
%
92.74 89.94 89.39
Table 5 also gives the detailed results of AccHTK
for the best Daubechies wavelet family when
changing levels and orders. The Table gives some
credit to our study because of the high variability
observed in Acc
HTK
values between the lowest of
72.07% and highest value of 92.74%.
Table 5: Acc
HTK
(%) of LWE for different Daubechies
orders and different decomposition levels.
12345 6 7 8
db1 86.03 86.03 86.59 85.47 81.01 87.15 85.47 87.15
db2 87.15 89.94 86.03 85.47 86.03 87.71 92.74 90.50
db3 84.36 85.47 86.03 77.65 78.77 83.80 87.71
db4 79.89 82.68 82.12 77.09 81.56 81.56 85.47
db5 72.0
7
79.89 80.45 77.65 79.89 79.33
db6 76.54 78.77 85.47 82.12 83.80 86.03
db7 79.89 83.80 85.47 82.68 84.92 84.92
db8 78.77 83.24 87.15 83.24 87.71 82.68
Moreover, results were obtained with the Coiflets
and Symlets wavelet families by following the same
experimental protocol. The order 2 at level 2 showed
the best performance within the Symlet family with
CR of 89.94%. Finally, the order 1 at level 6 showed
ICPRAM 2021 - 10th International Conference on Pattern Recognition Applications and Methods
338

the highest performance within the Coiflets family
with CR of 89.39%.
As a conclusion, from the experiments carried out,
the LWE descriptors, obtained using Daubechies and
Symlets wavelets at low orders and high
decomposition levels (order 2 with level 7 and order2
with level 2, respectively), gave the best CR values.
On the other hand, taking Coiflets wavelets, the best
results were obtained at order 1 with level 6 and the
performance dropped of about 0.99%.
4 CONCLUSIONS
In this study, three features descriptors called DWE,
LWE and WCC, based on discrete wavelet transform
are proposed for the classification of normal and
abnormal PCG signals using HMM classifier.
Different experiments have been carried out to find
the best configuration of the HMM classifier and to
select the optimal wavelet mother with its
decomposition level. The results have shown that the
combination of HMM model of 10 states associated
to GMM of 3 Gaussian components, with LWE
descriptor computed on analysis window of 20 ms
duration using the mother wavelet Db2 with
decomposition level 7 presented the highest
performance level with CR of 92.74%. The results
demonstrate the relevance and the efficiency of LWE
descriptor compared to the MFCC, WCC and DWE
in terms of CR and compact feature representation.
In future works, we are planning to evaluate the
reference system on a larger database. The LWEs will
also be tested under different noise conditions in
order to observe their robustness towards noisy PCG.
REFERENCES
Alajarin, J. (2007). Classification and diagnosis of heart
sounds and murmurs using artificial neural networks.
7th Proceedings of the 2nd international work-
conference on The Interplay between Natural and
Artificial Computation. Part I:Bio-inspired Modeling of
Cognitive Tasks. SpringerVerlag Berlin. Heidelberg,.
Bentley, P., Nordehn, G., Coimbra, M., Mannor, S., & Getz,
R. (2011). The PASCAL classifying heart sounds
challenge. www.peterjbentley.com/heartchallenge/.
Chauhan, S., Wang, P., Lim, C., & Anantharaman, V.
(2008). A computer-aided MFCC based HMM system
for automatic auscultation. Comput. Biol. Med. 38 221–
33.
Chen, T., Yang, S., & Ho, L. (2017). S1 and S2 Heart Sound
Recognition Using Deep Neural Networks. IEEE
Trans. Biomed. Eng. 64, 372–380.
Chen, T., Yang, S., Ho, L., Tsai, K., Chen, Y., Chang, Y., .
. . Wu, C. (2016). S1 and S2 heart sound recognition
using deep neural networks. IEEE Trans. Biomed.
Eng.64.372–380 –10.
Didiot, E., Illina, I., Fohr, D., & Mella, Q. (2010). A
Wavelet-Based Parameterization for Speech/Music
Discrimination. Computer Speech & Language, 341-
357.
Gomes, E., & Pereira, E. (2012). Classifying Heart Sounds
Using Peak Location for Segmentation and Feature
Construction. Aistatspp. 1–5.
Gupta, C., Palaniappan, R., Swaminathan, S., & Krishnan,
S. (2007). Neural network classification of
homomorphic segmented heart sounds. in Appl Soft
Comput.7. 286-97.
Hacine-Gharbi, A., & Ravier, P. (2018). Wavelet cepstral
coefficients for electrical appliances identification
using hidden markov models. International Conference
on Pattern Recognition Applications and Methods
(ICPRAM).
Hanna, I., & Silverman, M. (2002). A history of cardiac
auscultation and some of its contributors. Am.J.
Cardiol, 90, 259–267.
Jiang, Z., & Choi, S. (2006). Cardiac sound characteristic
waveform method for in-home heart. Expert Syst. Appl.
31. 286–298.
Kumar, D., Carvalho, P., Antunes, M., Gil, P., Henriques,
J., & Eugenio, L. (2006). New Algorithm for Detection
of S1 and S2 Heart Sounds. in Proceedings of the
ICASSP. IEEE International Conference on Acoustics,
speech and Signal Processing-Proceedings. Toulouse.
France. Vol 2. pp.1180–1183.
Lei, L., & Kun, S. (2016). Speaker recognition using
wavelet cepstral coefficient, I vector, and cosine
distance scoring and its application for forensics.
Journal of Electrical and Computer Engineering.
Lekram, B., & Abhishek, M. (2014). Heart sounds
segmentation analysis using daubechies wavelet (db).
International Journal of Research in Advent
Technology. Vol.2. No.2.
Li, F., Liu, M., Zhao, Y., Kong, L., Dong, L., Liu, X., &
Hu, M. (2019). Feature extraction and classification of
heart sound using 1D convolutional neural networks.
EURASIP J. Adv. Signal Process. p.59.
Liu, C., Springer, D., Li, Q., Moody, B., Juan, R., Chorro,
F., . . . Clifford, G. (2016). An open access database for
the evaluation of heart sound algorithms. Physiological
Mea-surement.
Moukadem, A., Dieterlena, A., Hueberb, N., & Brandtc, C.
(2013). A robust heart sounds segmentation module
based on s transform. BiomedSignal Process Control. 8
273–81.
Nabih-Ali, M., EL-Sayed, A., El-Dahshan, Ashraf, H., &
Yahia. (2017). Denoising of heart sound signals using
discrete wavelet transform. circuits Syst Signal Process.
36. 4482–4497.
Nilanon, T., Yao, I., Hao, J., & Purushotham, S. (2016).
Normal/abnormal heart sound recordings classification
using convolutional neural network. Computing in
Cardiology Conference (CinC), pp. 585–588, IEEE.
Discrete Wavelet based Features for PCG Signal Classification using Hidden Markov Models
339

Numan, F., Salleh, S., Ting, C., Samdin, S., Ombao, H., &
Hussain, H. (2019). A markov switching model
approach to heart sound segmentation and
classification. Journal of Biomedical and Health
Informatics. IEEE.
Praat. (n.d.). - Télécharger praat.fr.softonic.com/.
Rahmandani, M., Nugroho, H., & Setiawan, N. (2018).
Cardiac sound classification using mel-frequency
cepstral coefficients MFCC) and artificial neural
network (ANN). International Conference on
Information Technology Information System and
Electrical Engineering (ICITISEE). pp. 22-26.
Raza , A., Mehmood, A., Ullah, S., Maqsood, A., Choi, S., &
Won, B. (2019). On Heartbeat Sound Signal Classifica-
tion Using Deep Learning. Sensors. 19.4819. doi:
10.3390/s19214819, www.mdpi.com/journal/sensors.
Saracoglu, R. (2012). Hidden markov model-based classifi-
cation of heart valve disease with PCA for dimension
reduction. Eng. Appl. Artif. Intell. 25 1523–8.
Wang, P., Kim, Y., & Soh, C. (2005). Feature extraction
based on Mel-Scaled wavelet transform for heart sound
analysis. Medicine and Biology –Proceedings,7572-
7575.
Wang, P., Lim, C., Chauhan, S., Foo, J., & Anantharaman,
V. (2007). Phonocardiographic signal analysis method
using a modifed hidden Markov model Ann. Biomed.
Eng. 35 367–74.
Wu, H., Kim, S., & Bae, K. (2010). Hidden Markov Model
with heart sound signals for identification of heart
diseases. Proceedings of the International Congress on
Acoustics.
YaseenSonG, Y., & Kwon, S. (2018). Classification of
heart sound signal using multiple features.
pplSci(Basel). 8:2344.
Young, S., Kershaw, D., Odell, J., & Ollason, D. (1999).
The HTK Book. Cambridge: Entropic Ltd.
ICPRAM 2021 - 10th International Conference on Pattern Recognition Applications and Methods
340
