
Bacterial Growth and Siderophore Production in Bacteria: An
Analytical Model
Gennadi Saiko
1,2 a
1
Swift Medical Inc., 1 Richmond St. W., Toronto, Canada
2
Ryerson University, Toronto, Canada
Keywords: Bacterial Growth, Growth Model, Fluorescence Imaging.
Abstract: We have analyzed the impact of quorum sensing and resource dependency on the production of critically
crucial for bacteria fitness compounds (siderophores). We have built two siderophore production models
(quorum sensing and resource dependency) and linked them with Monod’s growth model. As a result,
siderophore accumulation is explicitly expressed through bacterial concentration N, which allows direct
experimental verification. A nutrient-dependent model predicts three siderophore accumulation phases, which
accompany bacterial growth: slow accumulation for [N
0
, N
th
], fast accumulation for [N
th
, K/2], and slow or
no accumulation for [K/2, K). Here N
0
is the initial bacterial concentration, K is the carrying capacity. A
quorum-sensing model predicts two regimes of siderophore accumulation: relatively slow accumulation for
[N
0
, N
cr
] and much faster non-linear accumulation for [N
cr
, K). N
cr
and N
th
are model parameters. N
cr
has an
“absolute” value. It is dependent on bacterial strain only. N
th
has a “relative” value. In addition to the bacterial
strain, it also depends on inoculums concentration and the initial nutrient concentration. Such as models
predict entirely different behavior, experimental data may help differentiate between these mechanisms.
1 INTRODUCTION
Bacterial growth kinetics is a well-established
research area, which can be traced back to classical
growth models by Gompertz (Gompertz, 1825) and
Verhulst (Verhulst, 1845). The significant conceptual
step in developing bacterial growth models was
introducing the concept of a limiting nutrient by
Monod (Monod, 1941, 1949, 1950). Since then,
multiple models have emerged (Richards, 1959),
modified, or reparametrized (Zwietering, 1990). In
particular, Gompertz, Baranyi, Richards, logistic, and
three-phase linear models are the most widely used
(Pla, 2015). These models are empirical and used
mostly in the food safety industry. In Pia et al. (Pla,
2015), it was found that all these five models
provided relatively high goodness of fit (R
2
>0.93) for
all growth curves for three different microorganisms
(Bacillus cereus, Listeria monocytogenes, and
Escherichia coli). Such as all models provide a good
fit for experimental growth curves, the choice of a
particular model is entirely subjective. Thus, the
biological justification of model(s) can help with
a
https://orcid.org/0000-0002-5697-7609
further selection and development of growth models.
Some attempts were made to justify Monod’s model
(Lobry, 1992). Such as metabolism is described by
the chain of reactions; some of each are enzymatic; it
is not surprising that the Monod’s growth factor is
characterized by the Michaelis-Menten equation
(Michaelis, 1913). However, further insights into
biological justification would be of importance.
The related question to bacterial growth is the
production of biomolecules, which are essential for
bacteria fitness. Iron availability is a significant factor
limiting the in vivo growth of bacteria (Ratledge,
2000). Bacteria developed multiple pathways to
scavenge iron from the host. A vital pathway is to use
siderophores, biomolecules used by some
microorganisms to obtain iron from the environment.
Siderophores’ biosynthesis is iron-regulated. In
response to iron limitation in their environment,
genes involved in bacteria siderophore production
and uptake are derepressed, leading to siderophores’
production. The relationship between siderophore
production and bacterial growth rates supports the
hypothesis that siderophore production contributes to
188
Saiko, G.
Bacterial Growth and Siderophore Production in Bacteria: An Analytical Model.
DOI: 10.5220/0010342901880192
In Proceedings of the 14th International Joint Conference on Biomedical Engineering Systems and Technologies (BIOSTEC 2021) - Volume 2: BIOIMAGING, pages 188-192
ISBN: 978-989-758-490-9
Copyright
c
2021 by SCITEPRESS – Science and Technology Publications, Lda. All rights reserved

bacterial virulence. For example, mutants deficient in
siderophore production have reduced virulence.
Mathematical modeling of siderophore
production is concentrated mostly on bacterial
cooperation and evolutionary strategies of
siderophore production in bi-bacteria (Eberl, 2009)
and multi-bacteria (Niehus, 2017; West, 2003)
systems. In Fgaier et al. (Fgaier, 2008), the authors
proposed a non-linear and non-autonomous system of
four ordinary differential equations for the bacterial
population, pyoverdine, dissolved iron, and chelated
iron. In this model, the primary focus is on the
inhibition of siderophore (pyoverdine) production in
the presence of dissolved iron. In Niehus et al.
(Niehus, 2017), the authors discussed a shift in the
production of different siderophores in competitors’
presence: downregulation of public siderophores and
upregulation of partly privatized siderophores.
It is known that siderophore production is costly
to bacteria (Griffin, 2004; West, 2003). It may
decrease the growth rate by diverting resources
(West, 2003) or increase the growth rate by making
iron available (West, 2003).
The current work aims to investigate what factors
can be responsible for regulating bacterial growth and
the production of important biomolecules (e.g.,
siderophores). We have selected a quorum sensing
mechanism and resource availability as two primary
culprits.
We will attempt to build the bacterial growth and
siderophore production models based on Monod’s
equations. In particular, we aim to link siderophore
accumulation with experimentally measurable
parameters (bacterial concentrations). Experimental
verification will be provided in a separate article
(Caschera, 2021).
2 METHODS
2.1 Bacterial Growth Model
It is well established that bacterial growth goes
through four distinct phases: lag, log (or exponential),
stationary, and death.
The bacterial growth in the case of limited
resources can be described by Monod’s equations
(Monod, 1941, 1949, 1950):
𝑑𝑁
𝑑𝑡
𝑁
𝑟𝑆
𝑎𝑆
𝑑𝑆
𝑑𝑡
1
𝛾
𝑑𝑁
𝑑𝑡
(1)
(2)
here, N is the concentration of bacteria, S is the
nutrient’s concentration, r is the growth rate, is the
growth yield, a is a parameter.
From Eq.2, we can find the nutrient’s
concentration S as a function of the bacterial
concentration N, which can be measured
experimentally (e.g., using optical density, OD)
𝑆𝑆
𝑁
𝑁
𝛾
(3)
Here, S
0
is the initial nutrient concentration; N
0
is
the initial bacterial concentration.
2.2 Siderophore Production Model
Siderophores are critical components for bacteria
fitness and virulence. It is known that bacteria do not
always produce siderophores. Bacteria employ
several mechanisms to regulate siderophore
production.
It is well established that multiple bacteria strains
have a quorum sensing (QS) mechanism. Each
bacteria a) excretes a certain amount of a specific
biomolecule (autoinducer) and b) detects these
molecules' concentration. Such as a concentration of
autoinducers is proportional to the local number of
bacteria; the bacteria can regulate their individual
functions based on their overall concentrations.
Certain bacteria have multiple (e.g., P.aeruginosa has
three) QS mechanisms, typically arranged
hierarchically.
Similarly, one can expect that bacteria may have
a mechanism to sense the nutrient’s availability, or
alternatively, the accumulation of the metabolic
products (e.g., through pH).
Thus, our first hypothesis is that the siderophore
production is governed by quorum sensing and/or
resource availability. So, let’s assume that at some
point in time t=t
0
, bacteria start producing a particular
compound (e.g., a siderophore), diverting a portion
() of consumed nutrients to the synthesis. Then, the
expression for the compound concentration C can be
linked to nutrient’s concentration S:
𝑑𝐶𝜉𝑁
𝑑𝑆
𝑁
𝜉𝑑𝑆
(4)
3 RESULTS
3.1 Bacterial Growth
From Eq.3, we can obtain a well-known result: a
“carrying capacity,” the maximum concentration of
Bacterial Growth and Siderophore Production in Bacteria: An Analytical Model
189
bacteria, which can be supported by a particular
media:
𝐾𝑁
𝛾𝑆
(5)
3.2 Nutrient’s Availability
Siderophore’s function is to increase the fitness of
bacteria in a hostile environment. Thus, it is plausible
to hypothesize that bacteria may start producing
siderophores when the nutrient’s concentration drops
below a certain level, S
th
.
If bacteria started the synthesis at nutrient’s
concentration S
th
, it corresponds to a bacterial
concentration N
th
through Eq.3:
𝑁
𝑁
𝛾𝑆
𝑆
(6)
Then integrating Eq.4 and taking into account
Eq.6, we can write
𝐶𝜉
𝑆𝑆
𝜉
𝛾
𝑁𝑁
𝜉
𝛾
𝑁𝑁
𝜉𝑆
𝑆
(7)
In the final expression, we substituted N
th
from Eq.6.
Thus, we obtained an explicit equation for compound
accumulation as a function of bacterial concentration.
It is affected by the initial bacterial concentration N
0
and the initial nutrient concentration S
0
.
A more general case is that bacteria change their
siderophore production rate upon reaching the
threshold S
th
. We can suppose that bacteria divert a
portion (
) of resources if the nutrient’s
concentration is above S
th
and
2
if it is below S
th
.
𝐶
⎩
⎨
⎧
𝜉
𝛾
𝑁 𝑁
𝑖𝑓 𝑆𝑆
𝐶
𝜉
𝛾
𝑁 𝑁
𝑖𝑓 𝑆𝑆
(8)
In this case, solutions can be stitched together at
S=St
h
if 𝐶
𝜉
𝑆
𝑆
𝜉
𝑁
𝑁
/𝛾
Finally, it has been established (Bren, 2013) that
in the last generation of bacteria, before growth stops
due to resource limitation, bacteria growth is
accompanied by a pulse-like up-regulation of gene
expression in the relevant nutrient assimilation
pathways. This mechanism circumvents other uses of
nutrients (including siderophore production). It
allows the cells to maintain their growth rate for about
one more generation in which they can utilize low
levels of substrate. Thus, we can expect that the last
cycle of bacteria growth will not have siderophore
production or have very minimal production.
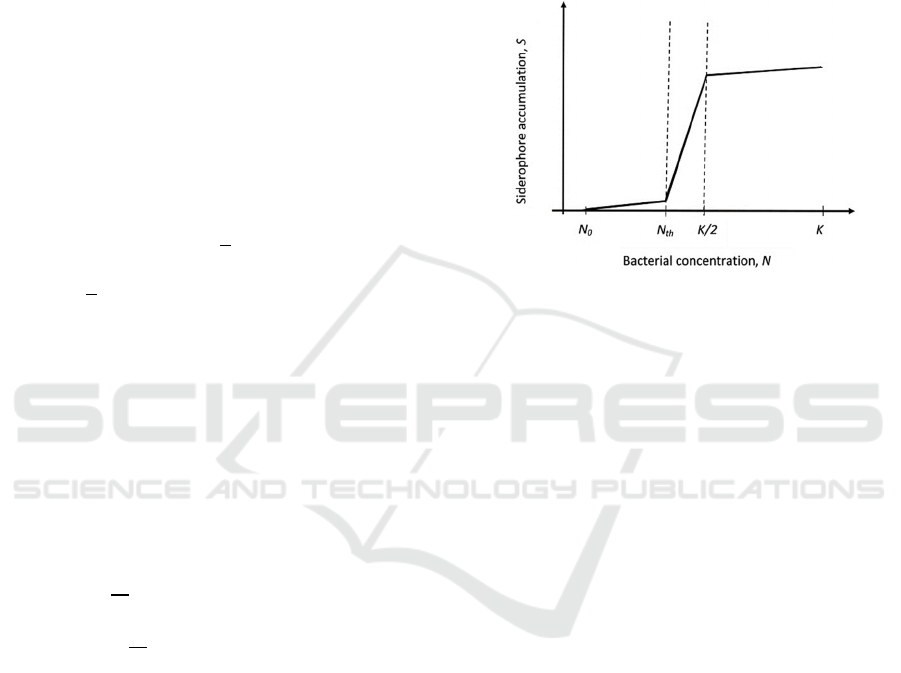
Thus, we can expect that we can have three
potential siderophore accumulation scenarios with
bacterial growth (see Figure 1):
Phase I: Slow siderophore accumulation with
bacterial growth for N
∈
[N
0
, N
th
]
Phase II: Fast siderophore accumulation with
bacterial growth for N
∈
[N
th
, K/2]
Phase III: No or minimal siderophore
accumulation with bacterial growth for N
∈
[K/2, K)
Figure 1: Three phases of siderophore production: slow
accumulation, fast accumulation, and slow (or no)
accumulation in nutrient-dependent case.
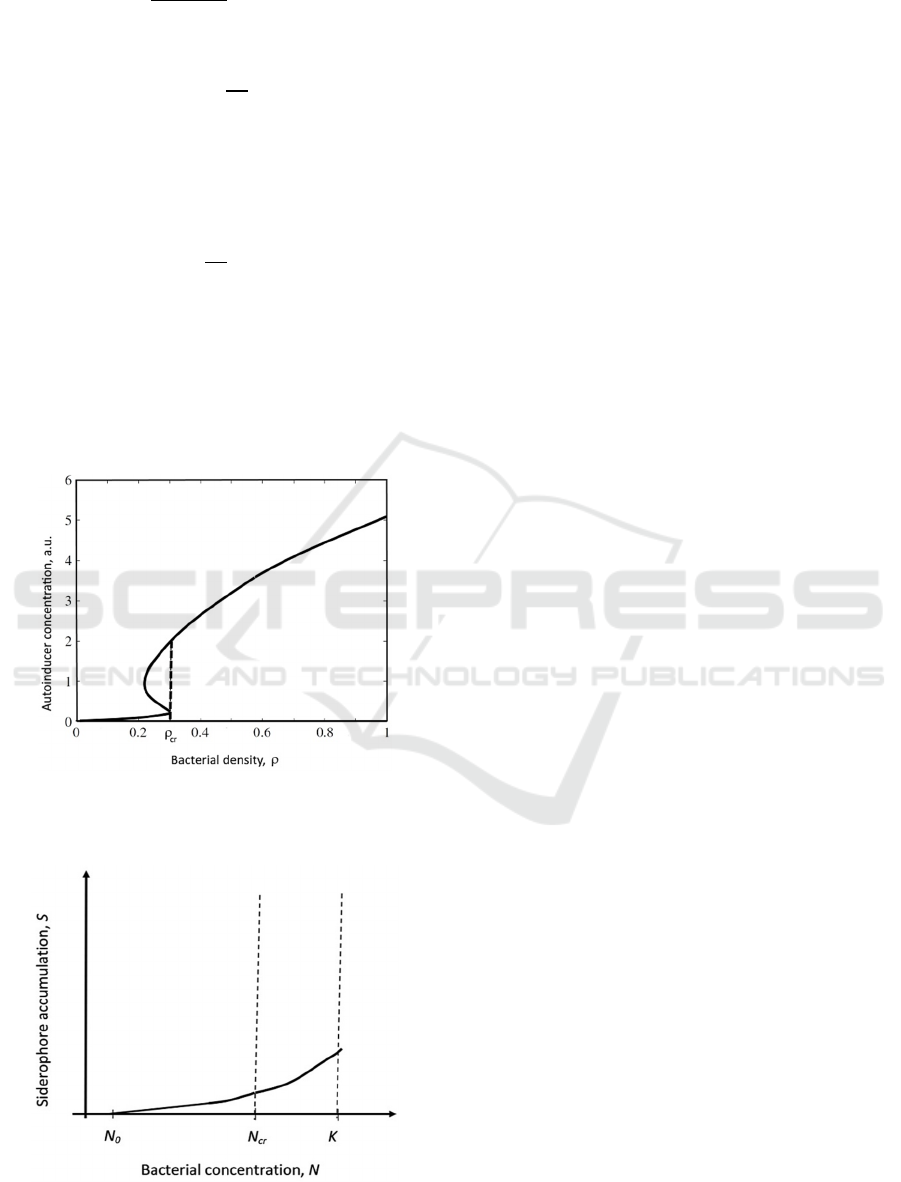
3.3 Quorum Sensing
Quorum sensing is another plausible mechanism of
siderophore regulation. Quorum sensing works in
two-phase mode (Dockery, 2001) (see Fig 2). At low
densities, autoinducers’ production is nominal and
slowly increases with bacteria density until bacteria
density reaches a critical value (N
cr
). At this point, the
production of autoinducers becomes autocatalytic
and experiences a massive increase. If we assume that
the siderophore production rate is proportional to
autoinducers intracellular concentration, then for the
portion of the diverted resources,
we can write
𝜉
𝜉
𝑁𝜅
𝑖𝑓 𝑁𝑁
𝜉
𝑁𝜅
𝑖𝑓 𝑁𝑁
(9)
Here we assumed that the bacteria population is
growing (moving from left to right in Fig 2). Sub-
indexes L and H indicate low (below critical) and
high (above critical) bacterial concentration regions.
In this approximation, we can solve Eq.4 onto two
intervals: N
∈
[0, N
cr
] and N
∈
[N
cr
, K), separately (here
K is the carrying capacity). Then, we can stitch them
together at the point N=N
cr
. If we consider the first
interval, then Eq.4 can be rewritten as
𝑑𝐶𝜉
𝑁𝜅
𝑑𝑆
(10)
If we express dS through dN using Eq.2 and
substitute it into Eq.10, we will get
BIOIMAGING 2021 - 8th International Conference on Bioimaging
190
𝑑𝐶
𝜉
𝑁𝜅
𝛾
𝑑𝑁
(11)
This equation can be solved
𝐶𝐶
𝜉
𝑁𝑁
𝜅
2𝛾
𝑁
𝑁
(12a)
For [0, N
cr
] interval, C
0
most likely is equal to
zero (no initial siderophore).
Similarly, for the second interval, we will have
𝐶𝐶
𝜉
𝑁𝑁
𝜅
2𝛾
𝑁
𝑁
(12b)
We can stitch solutions at the point N=N
cr
. In
particular, we can find that
𝐶
𝐶
𝜉
𝑁
𝑁
𝜅
𝑁
𝑁
/2𝛾
Most likely, siderophore production above critical
value is higher than the below critical one. Bacteria
colony has grown to a significant size, and now
bacteria may focus on improving their fitness.
Figure 2: Quorum sensing mechanism: autoinducer
concentration as a function of bacterial density (adopted
from (Dockery, 2001) with modifications).
Figure 3: Siderophore accumulation as a function of
bacterial concentration.
The siderophore accumulation as a function of
bacterial concentration for the Quorum Sensing
model is depicted in Figure 3.
3.4 Nutrient-dependent and QS Models
Interplay
If nutrient-dependent and QS mechanisms are
responsible for siderophore regulation, we have more
potential siderophore accumulation scenarios. In
particular, we can anticipate several major scenarios:
High resource availability: In this case, N
th
>N
cr
and the dynamic of the siderophore accumulation is
entirely driven by the QS mechanism
Low resource availability: In this case,
N
0
<N
th
<N
cr
, and we can observe all phases: I, II, and
III.
Ultra-low resource availability: In this case,
N
0
>N
th
, fast siderophore production starts
immediately, and we can observe phases II and III
only.
4 DISCUSSION
We have investigated bacterial growth and
siderophores production using the same analytical
framework based on Monod’s approach. It allows us
to express siderophore accumulation as an explicit
function of bacterial concentration in two realistic
cases: when siderophore production is a) resource-
mediated and b) quorum sensing-mediated. Nutrient-
dependent and quorum sensing models predict
completely different behaviors at high bacterial
concentrations. The nutrient-dependent model
predicts saturation or slow growth, while the QS
model predicts rapid siderophore accumulation.
A few words about model parameters: N
cr
has an
“absolute” value. It is dependent on bacterial strain
only. N
th
has a “relative” value. In addition to the
bacterial strain, it also depends on inoculums
concentration and the initial nutrient concentration.
Some parameters can be measured (like a, r, K) or set
(like N
0
, C
0
) experimentally.
It should be noted that all equations were derived
under the assumption of homogeneous conditions. In
reality, it is not obviously the case. Differences in
microenvironment for each bacteria will result in
different starting points for each phase for each
bacterium. It will result in smoothening curves near
N
th
, N
cr
, and K/2. The higher the homogeneity (e.g., in
a continually shaking environment), the closer the
curve shapes will be to the model prediction.
Bacterial Growth and Siderophore Production in Bacteria: An Analytical Model
191

We assumed that the temperature remains
constant. Obviously, various parameters may have
different temperature dependencies, which can
further complicate the model.
The initial validation of our theoretical
predictions was performed on Pseudomonas
aeruginosa elsewhere (Caschera, 2021). P.
aeruginosa are a clinically relevant bacterial species
and produce pyoverdine, a fluorescent siderophore. It
can be of particular importance for remote
quantification of bacterial presence using
fluorescence bioimaging (Saiko, 2020). In Caschera
et al. (Caschera, 2021), the model parameters (N
0
and
C
0
) were set experimentally. The experimental data
show clear sigmoid dependence of bacterial
fluorescence on bacterial concentration. It persisted
through variations in temperature and inoculum
starting condition. While the results are very
preliminary, they indicate that P. aeruginosa
fluorescence is primarily nutrient-driven.
5 CONCLUSIONS
We have built two simple siderophore production
models (quorum sensing and resource dependency)
and linked them with Monod’s growth model. As a
result, siderophore accumulation is explicitly
expressed through bacterial concentration, which
allows direct experimental verification.
The nutrient-dependent model predicts a sigmoid
curve: three siderophore accumulation phases with
bacteria concentration growth: slow accumulation for
[N
0
, N
th
], fast linear accumulation for [N
th
, K/2], and
slow or no accumulation for [K/2, K).
The quorum-sensing model predicts two regimes
of siderophore accumulation: relatively slow
accumulation for [N
0
, N
cr
] and much faster non-linear
accumulation for [N
cr
, K).
These models’ interplay introduces more
complex behavior (e.g., start and stop of siderophore
production with bacterial population growth).
Such as models predict entirely different
behavior, experimental data may help differentiate
between them.
REFERENCES
Gompertz, B., 1825, On the nature of the function
expressive of the law of human mortality, and on a new
mode of determining the value of life contingencies.
Philos. Trans. R. Soc. London 115:513-585.
Verhulst, P.F., 1845, Recherches mathématiques sur la loi
d'accroissement de la population.Mém. Acad. r. Sci.
Lett. Belg. 18: 1–38.
Monod, J., 1941, Recherches sur la croissance des cultures
bactériennes Thèse de docteur ès sciences naturelles,
Paris.
Monod, J., 1949, The growth of bacterial cultures.A. Rev.
Microbiol. 3: 371–394.
Monod, J., 1950, La technique de culture continue: théorie
et applications. Annls Inst. Pasteur 79: 390–410.
Richards, F.J., 1959, A flexible growth function for
empirical use. J. Exp. Bot. 10:290-300.
Zwietering, M.H., Jongenburger, I., Rombouts, F.M.,
Van’tRiet, K., 1990, Modeling of the Bacterial Growth
Curve. Appl. Environ. Microbiol. 56: 1875-1881
Pla, M-L., Oltra, S., Esteban, M-D., et al., 2015,
Comparison of Primary Models to Predict Microbial
Growth by the Plate Count and Absorbance Methods,
BioMed Research International, 2015: 365025,
doi:10.1155/2015/365025.
Lobry, J.R., Flandrois, J.P., Carret, G., et al., 1992,
Monod’s bacterial growth model revisited, Bltn
Mathcal Biol 54: 117, doi:10.1007/BF02458623
Michaelis, L.; Menten, M.L., 1913, Die Kinetik der
Invertinwirkung. Biochem Z. 49: 333–369
Ratledge, C. & Dover, L. G., 2000, Iron metabolism in
pathogenic bacteria. A. Rev. Microbiol. 54: 881–941.
Eberl, H.J., Collinson, S. 2009, A modeling and simulation
study of siderophore mediated antagonism in dual-
species biofilms. Theor Biol Med Model; 6:30,
doi:10.1186/1742-4682-6-30
Niehus, R., Picot, A., Oliveira, N.M., Mitri, S. and Foster,
K.R., 2017, The evolution of siderophore production as
a competitive trait. Evolution, 71: 1443-1455,
doi:10.1111/evo.13230
West, S.A., Buckling, A., 2003, Cooperation, virulence and
siderophore production in bacterial parasites, Proc. R.
Soc. Lond. B 270: 37–44, doi: 10.1098/rspb.2002.2209
Fgaier, H, Feher, B, McKellar, R.C., Eberl, H.J, 2008,
Predictive modeling of siderophore production by
Pseudomonas fluorescens under iron limitation, J of
Theoretical Biology, 251(2), 348-362, doi:
10.1016/j.jtbi.2007.11.026.
Griffin, A.S., West, S.A., Buckling, A., 2004, Cooperation
and competition in pathogenic bacteria. Nature
430:1024–1027.
Caschera, A., Saiko, G., On Feasibility of Fluorescence-
Based Bacteria Presence Quantification: P.aeruginosa.
Accepted to Bioimaging 2021. SCITEPRESS
Bren, A., Hart, Y., Dekel, E., Koster, D., Alon, U., 2013,
The last generation of bacterial growth in limiting
nutrient. BMC Systems Biology 7:27.
Dockery, J.D., Keener, J.P., 2001, A Mathematical Model
for Quorum Sensing in Pseudomonas aeruginosa, Bull
of Math Bio, l63: 95-116.
Saiko, G. and Douplik, A., 2020, Extraction of Intrinsic
Fluorescence in Fluorescence Imaging of Turbid
Tissues. In the 13th International Joint Conference on
Biomedical Engineering Systems and Technologies,
SCITEPRESS, doi: 10.5220/0008919401230129
BIOIMAGING 2021 - 8th International Conference on Bioimaging
192
