
AI-assisted Automated Pipeline for Length Estimation, Visual
Assessment of the Digestive Tract and Counting of Shrimp in
Aquaculture Production
Yousif Hashisho
1 a
, Tim Dolereit
1 b
, Alexandra Segelken-Voigt
2 c
, Ralf Bochert
2 d
and Matthias Vahl
1 e
1
Fraunhofer Institute for Computer Graphics Research IGD, Joachim-Jungius-Str. 11, 18059 Rostock, Germany
2
Institute of Fisheries, State Research Centre of Agriculture and Fisheries Mecklenburg-Vorpommern,
S
¨
udstraße 8, 18375 Born, Germany
Keywords:
Computer Vision, Image Processing, AI, Deep Learning, Shrimp, Aquaculture.
Abstract:
Shrimp farming is a century-old practice in aquaculture production. In the past years, some improvements
of the traditional farming methods have been made, however, it still involves mostly intensive manual work,
which makes traditional farming a neither time nor cost efficient production process. Therefore, a continu-
ous monitoring approach is required for increasing the efficiency of shrimp farming. This paper proposes a
pipeline for automated shrimp monitoring using deep learning and image processing methods. The automated
monitoring includes length estimation, assessment of the shrimp’s digestive tract and counting. Furthermore,
a mobile system is designed for monitoring shrimp in various breeding tanks. This study shows promising
results and unfolds the potential of artificial intelligence in automating shrimp monitoring.
1 INTRODUCTION
Aquaculture production of whiteleg shrimp, namely
Penaeus vannamei, is steadily increasing (Boone,
1931) and accounts for more than half of the world-
wide crustacean production (FAO, 2020). The aver-
age farming cycle, e.g. the time to raise the animals
from larvae to adult shrimp, has a duration of 5 – 6
months. During this cycle, the shrimp remain in their
production system until they reach a harvest weight
of 25 – 30 grams. However, due to their high sensi-
tivity, manual growth measurements are only possible
to a limited extent and in addition, it is hardly feasible
to gauge the exact number of animals in the system.
Nonetheless, the knowledge of stocking densities or
quantity of shrimp is important for optimized feeding
and to determine the optimal harvest period (Harbitz,
2007). These parameters are crucial for avoiding non-
adequate feeding during production and assessing the
growth and health development of the shrimp. For
a
https://orcid.org/0000-0002-7642-8949
b
https://orcid.org/0000-0002-4499-8146
c
https://orcid.org/0000-0002-0825-4975
d
https://orcid.org/0000-0002-8159-6955
e
https://orcid.org/0000-0003-1183-5823
example, erroneous or missing knowledge of shrimp
count and densities in the production system may lead
to over-feeding, resulting in higher costs and a de-
cline in water quality due to higher waste. Contrarily,
under-feeding might result in growth depressions and
cannibalism. (Roy et al., 2012).
Therefore, it is inevitable to adjust the feeding
rates based on control measurements (e.g. average
length or weight of shrimp samples) and counting for
achieving optimal growth and survival rates. As feed
takes approximately 60 minutes to pass through the
gut (Beseres et al., 2005), the degree of filling of the
digestive tract is an appropriate discernible and mea-
surable criterion for assessing the state of the feeding
rate. However, the currently employed methods for
assessing feeding status and quantities involve time-
consuming manual work and are therefore prone to
human-error.
In this paper, the potential of artificial intelligence
in automated shrimp monitoring is assessed. To in-
crease the efficiency of the shrimp farming process,
we propose the following:
• A flexible and easy to install monitoring system
for various shrimp production systems.
710
Hashisho, Y., Dolereit, T., Segelken-Voigt, A., Bochert, R. and Vahl, M.
AI-assisted Automated Pipeline for Length Estimation, Visual Assessment of the Digestive Tract and Counting of Shrimp in Aquaculture Production.
DOI: 10.5220/0010342007100716
In Proceedings of the 16th International Joint Conference on Computer Vision, Imaging and Computer Graphics Theory and Applications (VISIGRAPP 2021) - Volume 4: VISAPP, pages
710-716
ISBN: 978-989-758-488-6
Copyright
c
2021 by SCITEPRESS – Science and Technology Publications, Lda. All rights reserved

• An approach for estimating the length of shrimp
with the aid of instance segmentation.
• An approach that combines instance segmentation
and image classification for efficiently assessing
the shrimp’s digestive tract.
• A multi-feature shrimp counting approach, which
reduces the problems with overlapping shrimp.
By means of this automated monitoring approach,
a time- and cost-efficient shrimp production can be
achieved. The structure of the paper is as follows. In
Section 2, the related work is analyzed. In Section 3,
the monitoring system, the dataset and the automated
shrimp monitoring pipeline are presented. In Section
4, the results of the different approaches are discussed
and Section 5 concludes the paper.
2 RELATED WORK
2.1 Counting
Shrimp counting has been an interest for researchers
over recent years. Most of the methods focus on con-
ventional image processing techniques to automate
the shrimp counting process.
Khantuwan and Khiripet (2012), took gray-scale
images of shrimp larvae and improved the contrast
of larvae edges using Laplacian and Median filters
followed by adaptive thresholding for reducing non-
uniform illumination. They determined a statistical
measure in the form of a histogram for a first stage
counting and used template matching for a second
stage counting. Kaewchote et al. (2018) automated
the counting of post larvae shrimp by extracting fea-
tures using Local Binary Patterns followed by identi-
fying objects using a Random Forest classifier. An-
other study by Awalludin et al. (2019) proposed com-
bining anisotropic diffusion with a canny edge de-
tector followed by blob analysis for counting shrimp
larvae. Solahudin et al. (2018) applied thresholding
and dilation to estimate the count of whiteleg shrimp.
Similarly, Yeh and Chen (2019) applied image thresh-
olding for extracting contours to be used for counting.
Most of these methods are restricted to a specific
application setup. Extending them to a different setup
requires a reconfiguration of the applied techniques,
like adjusting the threshold values if the lighting dif-
fers or if the color degrades due to a different produc-
tion tank. This would require an input from the user
and would thus be prone to more errors and the auto-
matic process might be impaired.
An alternative to conventional image processing
techniques is deep learning, which enables feature
learning from the input data and which is robust to
noise and illumination variations. Deep learning out-
performs traditional image processing techniques and
surpassed its limitations (O’Mahony et al., 2019).
However, there are hardly any studies for the appli-
cation of deep learning in shrimp counting.
In a recent study by Nguyen et al. (2020), a deep
learning-based method for whiteleg shrimp larvae
counting has been applied. They prepared a dataset
of shrimp in a glass container with low water level to
minimize overlaps. This dataset was used to train an
instance segmentation network based on a two-phase
Mask R-CNN to detect shrimp larvae in regions with
overlaps. Their approach works well with a small
number of overlapping shrimp, however, the accuracy
substantially decreased with more overlaps.
In our method, we focus on detecting two major
features of the shrimp using a deep learning object de-
tection network to reduce the problems with overlap-
ping shrimp and increase the accuracy of automated
shrimp counting.
2.2 Length Estimation
Harbitz (2007) segment shrimp automatically based
on an intensity threshold. Afterwards, objects are
identified and their pixel areas are calculated, which
in turn are used for separating shrimp objects based on
an area threshold. This separation enables identifying
shrimp based on centroid values. Then the length is
estimated by linking each shrimp’s area with a cor-
responding caliper measurement. The estimation of
shrimp length by Harbitz (2007) is dependent on mul-
tiple analysis and values prediction, which in return
make it hard to generalize and be robust to changes.
To achieve a robustness to change, our approach
for automated length estimation utilizes the results
from instance segmentation, while being facilitated
by our monitoring system.
2.3 Digestive Tract Assessment
To our knowledge, no research has yet been done on
the visual assessment of the digestive tract of shrimp.
In shrimp, the digestive tract is a straight tube run-
ning dorsally, which is divided into three regions: the
foregut, the midgut, which begins at the junction of
the hepatopancreas, and the hindgut (Franceschini-
Vicentini et al., 2009; Davie et al., 2015). It is ex-
ternally identifiable when filled, and therefore well
suited for image analysis.
In this paper, we present a methodology for auto-
matically assessing the digestive tract’s condition.
AI-assisted Automated Pipeline for Length Estimation, Visual Assessment of the Digestive Tract and Counting of Shrimp in Aquaculture
Production
711
60 cm
40 cm
10 cm
15 cm
60 cm
Floating plate
Side walls
Underwater plate
(white background)
Recording camera
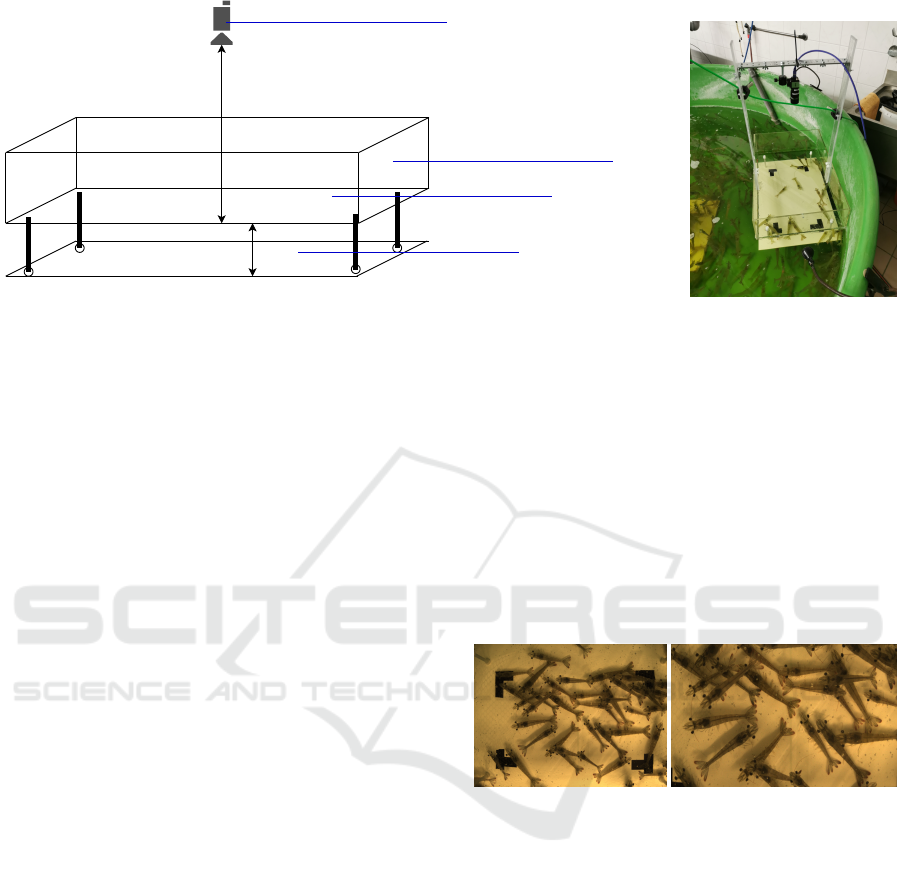
Figure 1: Shrimp monitoring system. Left: Sketch of the system design. Right: The installed system in an experimental tank.
3 METHODOLOGY
3.1 Monitoring System Design
There are various types of shrimp production tanks.
Therefore, the scenarios differ, for example, in water
depth, water quality or tank shape. As part of this
study, a mobile system was designed for recording
images of shrimp in an area of interest, which enables
the application of the proposed methodology to vari-
ous scenarios.
Figure 1 presents a sketch of the designed sys-
tem along with the installed setup used for automated
shrimp monitoring. The system consists of a float-
ing box made of transparent perspex (top is open) and
an underwater plate made of white plastic, reducing
the water column to 10 cm. The dimension of the
floating box is 60 × 40 × 15 cm, whereas the under-
water plate’s dimension is 60 × 40 cm. This setup al-
lows only a small number of shrimp in the water col-
umn and therefore, reduces the number of overlapping
shrimp by design. The underwater plate is equipped
with markings for an area of interest of dimension
40 × 20 cm, where analysis and evaluation are based
on. The shrimp can swim freely through the moni-
toring system. The camera is placed orthogonal at a
height of 60 cm on top of the floating box, capturing
images through its transparent bottom. This prevents
image distortions due to a wavy water interface and
allows a clear view into the water column, regardless
of the external factors of the experimental tank. This
provides a good prerequisite for the proposed moni-
toring approaches even in challenging tank environ-
ments.
3.2 Dataset
Images were taken of the shrimp with a resolution of
3088 × 2076 pixels, where various focal lengths and
exposure times had been tested. At that point, most
of the shrimp had sizes between 9 and 12 cm. Fig-
ure 2 shows a sample of the recorded images and the
corresponding cropped area of interest based on the
measured markings on the underwater plate. As can
be seen, the shrimp images can be considered as high
quality.
Figure 2: A sample image of the monitoring system (left)
and the cropped area of interest (right).
The recorded images were divided into several
datasets. For the instance segmentation and object de-
tection network, the recorded high resolution images
were split into 4 equally sized images with a resolu-
tion of 1544 × 1038 pixels. The classification dataset
was obtained from the instance segmentation network
predictions, which will be discussed in the next sec-
tion. The overall number of images used for the in-
stance segmentation, object detection and classifica-
tion networks were 898, 410, and 292, respectively.
Finally, 150 images were cropped to the defined area
of interest and used for evaluating the results of the
automated monitoring approach. Table 1 illustrates
the datasets used for each deep learning network and
for evaluation.
VISAPP 2021 - 16th International Conference on Computer Vision Theory and Applications
712
Mask R-CNN
Faster R-CNN
ResNet10
Length Image
Processing
Length Measurement
Counting
Digestive Tract
Assessment
Digestive Tract Image
Processing
Instance Segmentation
Object Detection
Classification
Input Image
Counting Image
Processing
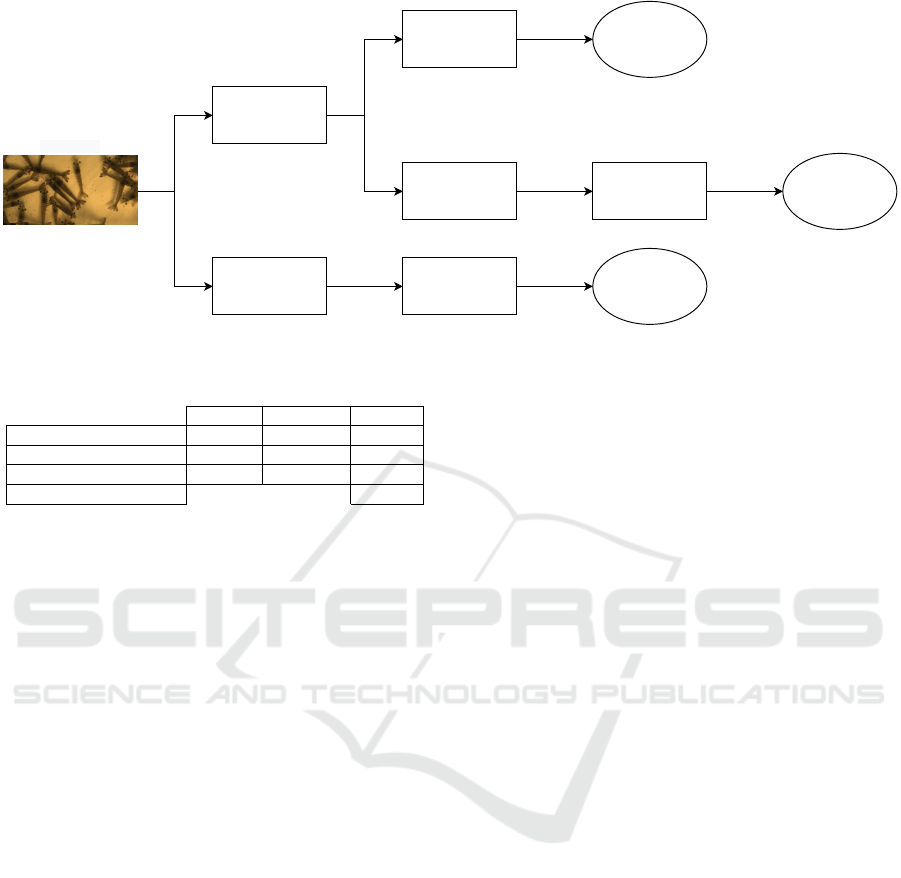
Figure 3: The proposed pipeline for length measurement, digestive tract assessment and counting.
Table 1: Number of images used for each category.
Training Validation Overall
Instance Segmentation 701 47 898
Object Detection 234 26 410
Classification 212 40 292
Evaluation 150
3.3 Automated Shrimp Monitoring
The captured images were processed by our pipeline
for automated shrimp monitoring (Figure 3). The
pipeline consists of two main branches. The upper
branch begins with an instance segmentation network,
namely Mask R-CNN (He et al., 2017), with a combi-
nation of Feature Pyramid Network (FPN) (Lin et al.,
2017) and deep residual network (ResNet) (He et al.,
2016) for feature extraction, which is used for detect-
ing and segmenting individual shrimp. The length is
then determined by processing the outputs of the in-
stance segmentation network, whereas the image clas-
sification network (ResNet (He et al., 2016)) is used
for assessing the digestive tract of a shrimp. The
lower branch consists of the Faster R-CNN network
(Ren et al., 2017) for detecting two unique body parts
of each shrimp. Afterwards, the detected body parts
are processed for shrimp counting.
3.3.1 Length Estimation
The shrimp were assumed to be located approxi-
mately at the same distance from the camera as the
underwater plate. Therefore, the measured markings
on the plate were used to obtain a scale factor to con-
vert between pixels and centimeters. Upward swim-
ming shrimp violate this assumption and hence were
excluded from the annotation. This exclusion does
not distort the overall monitoring process, since the
major swimming direction of the shrimp is horizontal
and since not each individual shrimp needs to be mea-
sured to get a significant length distribution. Since the
length of shrimp in this study is calculated from the
top of the rostrum (beak) to the end of the telson (fin),
only horizontally swimming, non-overlapping, com-
pletely visible shrimp were annotated and used for
training of the instance segmentation network. This
was a crucial step for forcing the network to detect
and segment measurable shrimp only.
The trained instance segmentation network was
used for predicting a bounding box and a segmen-
tation mask for each individual shrimp. Figure 4 il-
lustrates the processing steps. The predicted segmen-
tation mask was converted into contours and the ex-
treme left, right, top and bottom contour points were
deduced (Figure 4 (b)). The pair of deduced extreme
points with the longest distance were assumed to form
a line passing through the rostrum and the telson. The
two intersecting points of the line and the shrimp’s
bounding box were used to calculate the length of the
shrimp in pixel (Figure 4 (c)). Finally, the scale factor
was used to get the length estimate (Figure 4 (d)).
3.3.2 Digestive Tract
The main goal was to analyze the condition of the
shrimp’s digestive tract. More precisely, the degree
of filling of the digestive tract. For that, the inferred
segmentation masks of the instance segmentation net-
work were used for extracting a dataset. Therefore
each segmented shrimp was cropped from the original
image and then rotated and translated to the same ori-
entation (Figure 5). This dataset was used for training
the classification network, which eventually should
classify the shrimp into two categories: full and other
shrimp. The amount of visible shrimp in test data
didn’t allow for more categories. Figure 5 shows the
two different shrimp categories based on the degree
AI-assisted Automated Pipeline for Length Estimation, Visual Assessment of the Digestive Tract and Counting of Shrimp in Aquaculture
Production
713
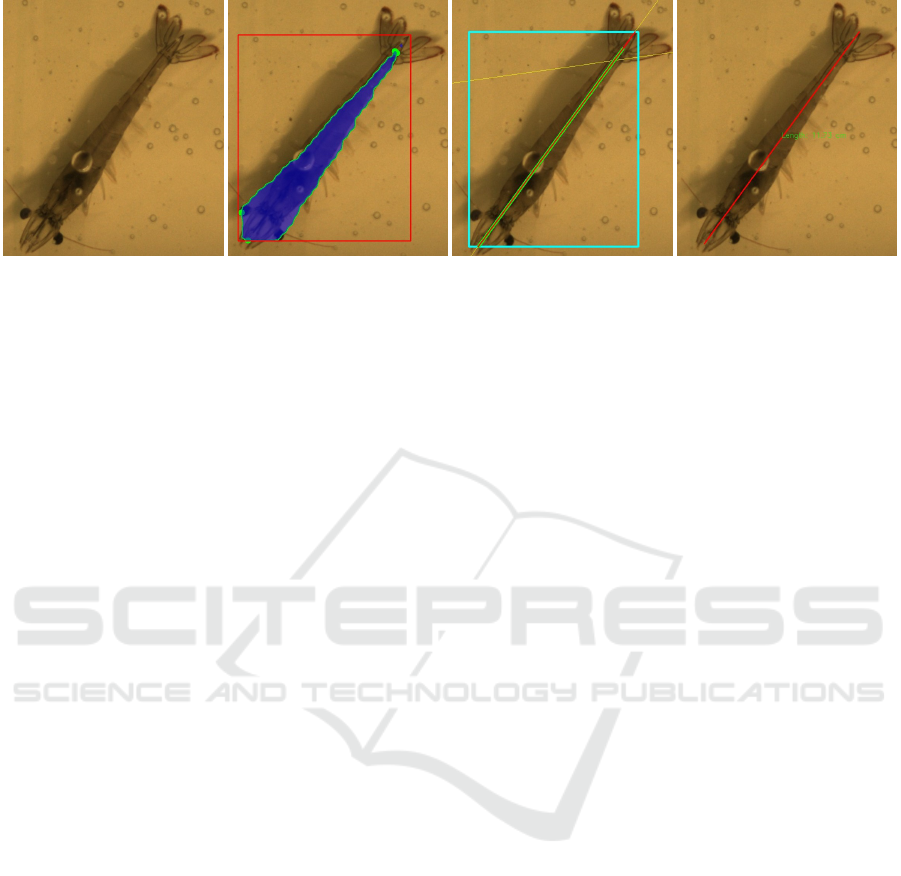
Figure 4: Length estimation approach: from left to right (a) Original. (b) Inferred results and extreme points. (c) Derived line
and intersecting points. (d) The estimated length in centimeters.
of filling of the digestive tract. As can be seen in the
images, shrimp with a sharp filled line are considered
as full, whereas the ones with light or no filled line
are considered as other. Within our pipeline for au-
tomated shrimp monitoring (Figure 3), after an im-
age passed the instance segmentation network, the in-
ferred results were forwarded for image transforma-
tion and classification. Finally, the predicted classifi-
cation results were used to assess the condition of the
shrimp’s digestive tract.
3.3.3 Counting
A separate branch in the pipeline was used for the
counting task, since it is independent of the previ-
ous results. An object detection network was trained
on two body parts of the shrimp, namely the pair of
eyes and the hepatopancreas, since most of the time,
one of these is visible even in overlapping situations.
The results of the object detection were forwarded for
further processing. The processing included calcu-
lating the shortest distance between a centroid of a
predicted hepatopancreas bounding box and each eye
pair bounding box. If this distance didn’t exceed 165
pixels (2.3625 cm), the corresponding hepatopancreas
and eye pair bounding boxes were considered as be-
longing to one object. The distance value was cho-
sen heuristically. Otherwise, the corresponding boxes
were considered as belonging to two separate shrimp
and were counted as two objects. Afterwards, both
centroids are removed and the process is continued it-
eratively. Figure 6 shows an overview of the counting
process. The bounding boxes in blue color (Figure 6
(b)) are considered as one object, whereas the ones
in red color are considered as separate individual ob-
jects.
4 RESULTS AND DISCUSSION
4.1 Length Estimation
For evaluation of the length estimation, a comparison
with manual measurements was performed. There-
fore, 625 horizontally swimming, non-overlapping,
completely visible shrimp have been manually mea-
sured in a set of 150 evaluation images. The same
evaluation images were used for predicting individual
shrimp using the trained instance segmentation net-
work, and ultimately, measuring the length. To have a
feasible evaluation of the measurement accuracy, dis-
tributions of the manual and predicted measurements
were calculated. Figure 7 shows the length distribu-
tion of both the manual (ground-truth) and the pre-
dicted measurements. In contrast to the ground-truth
(625 shrimps), only 401 shrimp could be detected and
measured by our pipeline for automated shrimp mon-
itoring. Looking at the distribution, shrimp below ap-
proximately 9 cm were not detected very often. This
implies that the instance segmentation network has a
weakness in detecting small shrimp, which is proba-
bly due to an imbalanced dataset. A more balanced
dataset with more diverse training data would be a
solution for addressing this issue. Nonetheless, the
predicted length distribution matches the ground-truth
one, where most shrimp have a length value between
9–12 cm. Both resemble a normal distribution.
4.2 Digestive Tract
At the time of capturing, most of the shrimp showed
a high degree of filling of their digestive tract (cate-
gory full). This made it hard to collect enough data
for the other category and impossible to define fur-
ther categories, which would lead to a more signifi-
cant analysis of the feeding status. We tried to main-
tain a relatively small balanced dataset instead of a
VISAPP 2021 - 16th International Conference on Computer Vision Theory and Applications
714
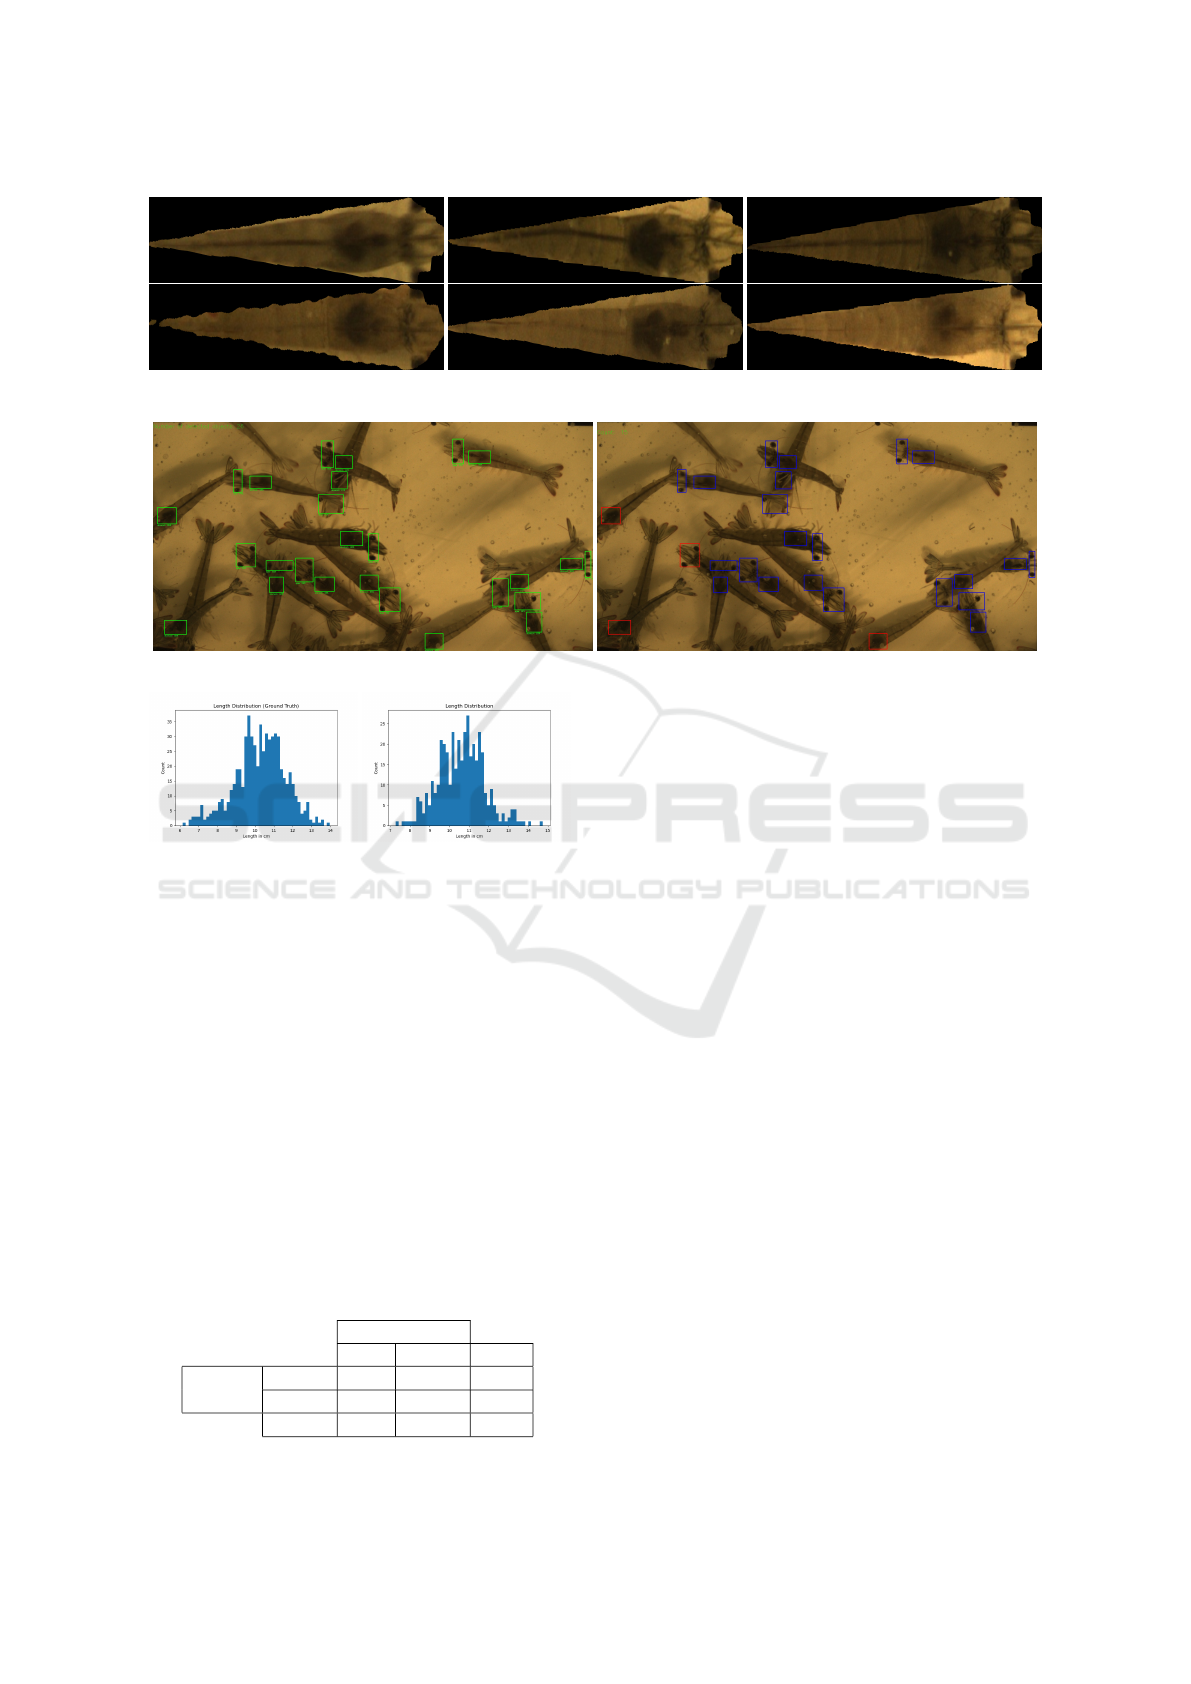
Figure 5: Dataset for training the classification network. Top row: Full category. Bottom row: Other category.
Figure 6: Counting approach: Left: Object detection inference. Right: Counting Result.
Figure 7: Calculated distribution of shrimp length estima-
tion in 150 evaluation images. Left: Ground-truth length
distribution. Right: Predicted length distribution.
large imbalanced one. Table 2 shows the confusion
matrix of the trained classification network. It can be
seen that 51 shrimp of the full category were correctly
classified out of 52, whereas 45 shrimp of the other
category were correctly classified out of 52. As was
expected, the network didn’t perform as well on the
other category as on the f ull one. Having a larger
dataset with more shrimp in the other category would
boost the performance of the classification network.
Since there is a direct relation between the instance
segmentation results and the classification network,
improving the results of the former would lead to a
better training dataset for the latter and ultimately bet-
ter performance.
Table 2: Confusion matrix of the digestive tract classifica-
tion network.
Predicted
Full Other Sum
Actual
Full 51 1 52
Other 7 45 52
Sum 58 46 104
4.3 Counting
For the evaluation of the automated counting task,
three different people counted the shrimp in the set
of 150 evaluation images manually. Compared to the
manual counting, the mean percentage error over the
evaluation images amounted to 6.6 %, with a highest
counting percentage error of 23.8 %. After interpret-
ing the results, the drawn conclusions read as follows:
1. Captured images with many overlapping shrimp
cause the network to miss some of them. 2. The
reason for that is a partially hidden hepatopancreas
and/or pair of eyes. 3. As a solution for addressing
this problem, a third body part of the shrimp could
be added to the detection problem along with the hep-
atopancreas and the pair of eyes. 4. Alternatively, par-
tially hidden body parts should be annotated as well
to improve the network’s performance in overlapping
situations. With this approach the shrimp count can
be estimated in an area of interest. If that area can
be considered as a representative, the counting can be
utilized for extrapolation to the whole tank. However,
the utilized area turned out to be too small. Therefore,
the present results are considered as proof of concept
of the proposed approach.
5 CONCLUSION
This paper shows the feasibility of utilizing artifi-
cial intelligence in automated shrimp length estima-
tion, digestive tract assessment and counting. Further-
AI-assisted Automated Pipeline for Length Estimation, Visual Assessment of the Digestive Tract and Counting of Shrimp in Aquaculture
Production
715

more, a flexible and easy to install monitoring sys-
tem for various shrimp production systems was pre-
sented. By means of the proposed automated moni-
toring approach, a more time and cost efficient shrimp
production can be achieved to increase the efficiency
of the shrimp farming process. Certainly, as men-
tioned in the previous section, there is room for im-
provement within all three mentioned use-cases. This
could be a subject for future research. Additionally,
it became clear that the designed system should cover
a significantly larger area than 40 × 20 cm. Approx-
imately 100 × 100 cm would be a better fit, which
would make the counting task more meaningful. In
addition to all the considered use-cases, an automated
detection of anomalies in the external appearance of
shrimp could be an interesting use-case for future
works.
ACKNOWLEDGEMENTS
Funding (code: B 730217000011) for ASV came
from the European Fisheries Fund (EFF) and the State
Mecklenburg-Vorpommern.
REFERENCES
Awalludin, E. A., Mat Yaziz, M. Y., Abdul Rahman, N. R.,
Yussof, W. N. J. H. W., Hitam, M. S., and T Ar-
sad, T. N. (2019). Combination of canny edge detec-
tion and blob processing techniques for shrimp larvae
counting. In 2019 IEEE International Conference on
Signal and Image Processing Applications (ICSIPA),
pages 308–313.
Beseres, J. J., Lawrence, A. L., and Feller, R. J. (2005).
Variation in fiber, protein and lipid content of shrimp
feed – effects on gut-passage time measured in the
field. Journal of Shellfish Research, 24(1):301–308.
Publisher: National Shellfisheries Association.
Boone, L. (1931). Anomuran, macruran Crustacea from
Panama and Canal Zone. Number 63 in Bulletin of
the American Museum of Natural History. American
Museum of Natural History.
Davie, P. J. F., Guinot, D., and Ng, P. K. L. (2015). Anatomy
and functional morphology of Brachyura. Treatise
on Zoology - Anatomy, Taxonomy, Biology. The Crus-
tacea, Volume 9 Part C (2 vols), pages 11–163. Pub-
lisher: Brill Section: Treatise on Zoology - Anatomy,
Taxonomy, Biology. The Crustacea, Volume 9 Part C
(2 vols).
FAO (2020). The State of World Fisheries and Aquaculture
2020: Sustainability in action. FAO, Rome.
Franceschini-Vicentini, I. B., Ribeiro, K., Papa, L. P., Mar-
ques Junior, J., Vicentini, C. A., and Valenti, P. M.
C. M. (2009). Histoarchitectural Features of the
Hepatopancreas of the Amazon River Prawn Macro-
brachium amazonicum. International Journal of Mor-
phology, 27(1):121–128.
Harbitz, A. (2007). Estimation of shrimp (Pandalus bore-
alis) carapace length by image analysis. ICES Journal
of Marine Science, 64(5):939–944.
He, K., Gkioxari, G., Doll
´
ar, P., and Girshick, R. (2017).
Mask r-cnn. In 2017 IEEE International Conference
on Computer Vision (ICCV), pages 2980–2988.
He, K., Zhang, X., Ren, S., and Sun, J. (2016). Deep resid-
ual learning for image recognition. In 2016 IEEE Con-
ference on Computer Vision and Pattern Recognition
(CVPR), pages 770–778.
Kaewchote, J., Janyong, S., and Limprasert, W. (2018).
Image recognition method using local binary pattern
and the random forest classifier to count post larvae
shrimp. Agriculture and Natural Resources, 52(4):371
– 376.
Khantuwan, W. and Khiripet, N. (2012). Live shrimp
larvae counting method using co-occurrence color
histogram. In 2012 9th International Confer-
ence on Electrical Engineering/Electronics, Com-
puter, Telecommunications and Information Technol-
ogy, pages 1–4.
Lin, T., Doll
´
ar, P., Girshick, R., He, K., Hariharan, B., and
Belongie, S. (2017). Feature pyramid networks for
object detection. In 2017 IEEE Conference on Com-
puter Vision and Pattern Recognition (CVPR), pages
936–944.
Nguyen, K., Nguyen, C., Wang, C., and Wang, J. (2020).
Two-phase instance segmentation for whiteleg shrimp
larvae counting. In 2020 IEEE International Confer-
ence on Consumer Electronics (ICCE), pages 1–3.
O’Mahony, N., Campbell, S., Carvalho, A., Harapanahalli,
S., Hernandez, G. V., Krpalkova, L., Riordan, D., and
Walsh, J. (2019). Deep learning vs. traditional com-
puter vision. In Science and Information Conference,
pages 128–144. Springer.
Ren, S., He, K., Girshick, R., and Sun, J. (2017). Faster
R-CNN: Towards real-time object detection with re-
gion proposal networks. IEEE Transactions on Pat-
tern Analysis and Machine Intelligence, 39(6):1137–
1149.
Roy, L. A., Davis, D. A., and Whitis, G. N. (2012). Ef-
fect of Feeding Rate and Pond Primary Productivity
on Growth of Litopenaeus vannamei Reared in In-
land Saline Waters of West Alabama. North American
Journal of Aquaculture, 74(1):20–26.
Solahudin, M., Slamet, W., and Dwi, A. S. (2018). Vaname
(litopenaeus vannamei) shrimp fry counting based on
image processing method. IOP Conference Series:
Earth and Environmental Science, 147:012014.
Yeh, C.-T. and Chen, M.-C. (2019). A combination of iot
and cloud application for automatic shrimp counting.
Microsystem Technologies, pages 1–8.
VISAPP 2021 - 16th International Conference on Computer Vision Theory and Applications
716
