
Evaluating Synthetic Speech Workload with Oculo-motor Indices:
Preliminary Observations for Japanese Speech
Mateusz Dubiel
1
, Minoru Nakayama
2
and Xin Wang
3
1
Dept. Computer and Information Sciences, The University of Strathclyde, U.K.
2
Dept. Information and Communications Engineering, Tokyo Institute of Technology, Japan
3
National Institute of Informatics, Japan
Keywords:
Speech Processing, Synthetic Speech Evaluation, Pupillometry, Cognitive Workload.
Abstract:
Pupillometry has recently been introduced as a method to evaluate cognitive workload of synthetic speech.
Prior research conducted on English speech indicates that in noisy listening conditions, pupil dilation is sig-
nificantly higher for synthetic speech as compared to natural speech. In a lab-based listening experiment, we
evaluated participants’ (n=16) pupil responses to Japanese speech (natural vs. synthetic) at three different
signal-to-noise levels (-1dB, -3dB and -5dB). Our research expands on previous work by evaluating pupil-
lary responses both in terms of temporal changes in pupil size and degree of pupil oscillations. We observe
statistically significant differences in pupil sizes at the recall stage between each type of speech. For pupil
oscillations, we register statistically significant differences in frequency power spectrum densities (PSDs).
Our investigation proposes an expansion of the current synthetic speech evaluation methods that are based on
pupillary responses and outlines possible avenues for future research that arise from the findings of this work.
1 INTRODUCTION
Although pupillometry has been used to measure cog-
nitive load for a long time (cf. Kahneman and Beatty
(1966); Beatty (1982); Kursawe and Zimmer (2015)),
it is only recently that it has been applied to the eval-
uation of text-to-speech (TTS) systems. The use of
the method for TTS cognitive workload evaluation
was pioneered by Govender and King Govender and
King (2018b). In their recent study, Govender et
al. Govender et al. (2019) found that in quiet listen-
ing conditions increased pupil dilation indicates at-
tention and engagement, while in noisy conditions,
increased pupil dilation indicates increased listening
effort. The results of recent evaluation studies Goven-
der and King (2018b); Govender et al. (2019); Siman-
tiraki et al. (2018) are promising and indicate that
pupil dilation can be used as an index of cognitive
listening effort for TTS systems.
However, since the findings of previous research
Govender and King (2018b); Govender et al. (2019);
Simantiraki et al. (2018) are limited only to the En-
glish language, it raises questions over their applica-
bility to other languages. For instance, English and
Japanese vary in terms of their phonemic invento-
ries (larger for English) and syllable structures (more
complex for English) (cf. (Ohata, 2004)). While there
are 15 different vowels (including diphthongs) in En-
glish, Japanese has only 5 vowels (ibid.). The larger
phonemic inventory potentially makes a language less
robust to noise, as the potential for confusing differ-
ent phonemes increases. Therefore, evaluations of
TTS systems may vary between different languages.
With this premise in mind, we analyse pupil dilation
and pupil oscillations to measure the listening effort
required by Japanese speech in noise conditions and
compare our findings to the similar study conducted
for English speech Govender et al. (2019).
Our experiment contributes to the current body of
TTS evaluation research by providing preliminary ob-
servations of using pupil dilation to evaluate Japanese
TTS. Additionally, we expand the current method by
also analysing pupil oscillations. Firstly, our investi-
gation aims to address the following questions.
• RQ1: How does the listening effort vary between
natural and synthetic speech at 3 different signal-
to-noise levels, i.e. -1dB, -3dB and -5dB?
• RQ2: What insights do pupil oscillations provide
into measuring the cognitive workload of syn-
thetic speech in noisy listening conditions?
Secondly, we reflect on the possible future directions
Dubiel, M., Nakayama, M. and Wang, X.
Evaluating Synthetic Speech Workload with Oculo-motor Indices: Preliminary Observations for Japanese Speech.
DOI: 10.5220/0010341303350342
In Proceedings of the 14th International Joint Conference on Biomedical Engineering Systems and Technologies (BIOSTEC 2021) - Volume 4: BIOSIGNALS, pages 335-342
ISBN: 978-989-758-490-9
Copyright
c
2021 by SCITEPRESS – Science and Technology Publications, Lda. All rights reserved
335

of research and make suggestions on how to make
the evaluation procedure of synthetic speech more
roboust.
2 RELATED WORK
2.1 Experiments with Natural Speech
Prior research shows that listening to natural speech
in noisy conditions is a cognitively demanding task,
especially if the speech samples presented are not in
listeners’ native language. Nakamura and Gordon-
Salant Nakamura and Gordon-Salant (2011) evalu-
ated the first and the second language perception abil-
ities in quiet and noisy conditions of Japanese speak-
ers who moved to the USA in their mid-twenties.
Nakamura and Gordon-Salant used speech recogni-
tion thresholds to measure comprehension and found
that Japanese speakers who had excellent English
word recognition ability in quiet conditions failed to
reach native-like standard in noisy conditions. The
study illustrated the impact of noise on the compre-
hension of first and second language speech stimuli.
In our study, to reduce potential contribution of sec-
ond language to cognitive load we only use native-
Japanese speakers.
Zekveld et al. Zekveld et al. (2010) evaluated the
influence of speech intelligibility on pupil dilation
during listening tests. The authors found that peak
dilation amplitude, peak latency, and mean pupil di-
lation systematically increase with decreasing speech
intelligibility. In other words, pupil response sys-
tematically varied as a function of speech intelligi-
bility. As highlighted by Zekveld et al. (ibid.), ap-
plying pupillometry to measuring listening effort can
yield valuable insights into the processing resources
required across listening conditions.
2.2 Experiments with Synthetic Speech
More recent research focused on applying pupilom-
etry to evaluate the contribution of synthetic speech
to cognitive workload. Govender and King Goven-
der and King (2018a) used the dual-task paradigm to
measure the impact of synthetic speech on cognitive
load. The authors conducted a series of experiments
where participants had to perform an additional task
(numerical and lexical reasoning) while listening to
speech stimuli. They observed that participants’ re-
action time increased with the decrease in the quality
of synthetic speech. Interestingly, the reaction times
were not the fastest for natural speech which indi-
cated that the dual-task paradigm might be measuring
a listener’s attention rather than their listening effort.
Based on this premise, Govender and King discontin-
ued using the dual-task paradigm in their follow-up
experiments.
In the followup studies, Govender et al. Goven-
der et al. (2019) evaluated the contribution of speech
to cognitive workload at different signal-to-noise lev-
els (i.e. -1dB, -3dB and -5dB). Their results indicated
that listening effort increased as signal-to-noise ration
decreased. The authors observed that for lower qual-
ity TTS systems (i.e. Hidden Markov Model (HMM)
systems) the attention ceiling was reached at lower
signal-to-noise levels. In our experiments, to estab-
lish a strong baseline we did not use HMM systems
but instead developed a state-of-the-art TTS system
using neural-network-based models (see Section 3.1
for details).
3 EXPERIMENTAL DESIGN
To address our research questions RQ1 and RQ2
(outlined in Section 1), we conducted a listening ex-
periment. 16 native Japanese speakers (M = 14, F =
2) with no self-reported hearing problems took part in
the experiment. The age of participants was between
21 and 25 years (Mean = 22.5).
3.1 Speech Stimuli
The Japanese speech corpus of Saruwatari-lab., Uni-
versity of Tokyo (JSUT)
1
was used to select speech
samples. The corpus consists of voice recordings of
a native Japanese female speaker, recorded in an an-
echoic room and sampled at 48kHz. We selected 40
sentences from the travel-domain subset of the corpus
(travel1000) as the natural speech stimuli. We then
used a Japanese state-of-the art text-to-speech (TTS)
system to synthesize speech wave-forms from the text
transcription of the selected natural stimuli.
The TTS system was built on the basis of the
classical neural-network-based statistical parametric
speech synthesis framework (Zen et al., 2013). It
uses an OpenTalk-based text analyzer (HTS Working
Group, 2015) to convert the text string into phonetic
labels, an RNN acoustic model to convert the labels
into acoustic features (i.e., Mel-cepstral coefficients,
F0 trajectory, and aperiodicity parameters), and the
WORLD vocoder (HTS Working Group, 2015) to
produce the 48 kHz waveform with acoustic fea-
tures. For this experiment, the duration of phones was
1
https://tinyurl.com/jsutcorpus
BIOSIGNALS 2021 - 14th International Conference on Bio-inspired Systems and Signal Processing
336
aligned against the natural stimuli using a HMM (Ra-
biner, 1989).
The average duration of the selected sentences
was 3 seconds. In line with previous research (Goven-
der et al., 2019), we decided to select samples of
this length to facilitate sentence repetition for the par-
ticipants. The selected samples were mixed with a
speech-shaped noise at three levels of signal-to-noise:
-1dB,-3dB and -5dB. Speech stimuli were divided
into two blocks of natural and synthetic speech. There
were 10 sentences in each block. We alternated the se-
quence of blocks for each participant in order to pre-
vent a sequencing effect. The participants were di-
vided into 3 groups, and each group listened to the
stimuli at a different level of noise, i.e. -1dB, -3dB
and -5dB.
3.2 Procedure
The experiment took place at Tokyo Institute of Tech-
nology Lab. All participants attended a briefing ses-
sion before the experiment and provided their written
consent in order to participate. Pupil data was col-
lected using an ACTUS Eye-tracker using 60Hz sam-
pling rate for both eyes. Participants listened to audio
samples via Sony WH-CH700N On-Ear headphones.
In preparation of the experimental setup we followed
the procedure explained in Winn et al. (2018).
3s Speech sound
Recall (4s)
8s
8s
With
Noise
Phase 1 (2s)
Phase 2
Phase 3 (2s)
Phase 4
Phase 5 (4s)
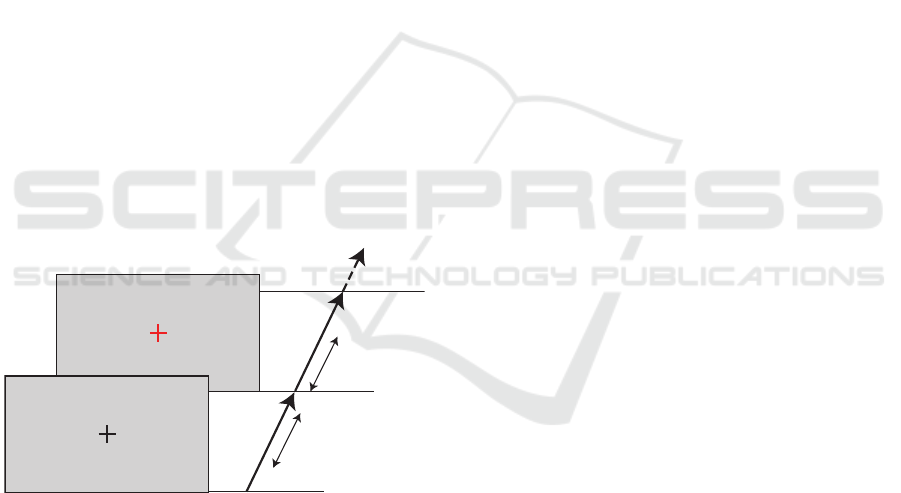
Figure 1: Experimental Procedure.
The experimental procedure is presented in Fig-
ure 1. Participants were asked to look at the black
cross on a grey background, listen to speech samples
and to respond by repeating the words that they had
heard when the cross changed its colour to red. Mask-
ing speech-shaped noise was present while the black
cross was displayed and it was turned off when the
cross changed its colour to red.
The experimental procedure consisted of five
phases. Phase 1 (0-2 seconds) immediately preceded
the onset of the sentence and was used for pupil cali-
bration. In phase 2 (2-5 seconds), participants had to
listen to and memorise the speech stimulus . Next, in
phase 3 (5-7 seconds) participants retained informa-
tion and then repeated it in the recall phase 4 (8-12
seconds). The final phase 5 - was ”relax and refresh”
(12-16 seconds). The recall attempt was considered
as successful only if the whole utterance was repeated
correctly.
At the end of each block (10 sentences), the partic-
ipants were asked to fill in a questionnaire regarding
their listening effort, perceived naturalness of speech,
and motivation to listen to the samples. All of the
items were measured on a 5-point Likert scale and ap-
plied as in Govender et al. (2019). For listening effort
- 1 signified the least effort and 5 signified the most
effort; for naturalness - 1 signified the least natural
voice and 5 the most natural voice; and for motivation
- 1 signified the lowest motivation and 5 signified the
highest motivation. We used questionnaires as com-
plimentary subjective evaluation measures in addition
to objective measures (pupil responses).
3.3 Pre-processing
The mean and standard deviations (SD) of the pupil
size, from 1 second before the sentence onset (base-
line) up until the start of the verbal response were cal-
culated. Pupil diameters for both eyes were measured
at 60Hz. Since the eye-tracker can detect measuring
errors such as blinks, they were replaced with the pre-
vious ‘normal’ size. Pupil sizes were standardised us-
ing the mean pupil size before the stimulus onset as
a baseline. Relative pupil size was calculated by di-
viding the observed pupil size by the baseline. In the
following analysis, pupillary changes on both eyes are
processed as independent data such as repeated mea-
sures on a trial.
4 RESULTS
Recall accuracy is presented in Table 1. There are
significant differences in recall rates between natu-
ral and synthetic speech except -3dB condition (-
1dB:t(4) = 5.1, p < 0.01, -3dB:t(8) = 2.2, p = 0.06,
-5dB:t(7) = 4.1, p < 0.01) The result of the two-way
Anova shows that the natural/synthetic factor is sig-
nificant (F(1, 23) = 34.0, p < 0.01) while the signal-
to-noise level factor is not significant (F(2, 23) =
2.01, p = 0.16).
4.1 Self-reported Measures
The self-reported measures are presented in Figure 2.
As expected, natural speech is rated as more natural
than synthetic speech. However, the scores go down
Evaluating Synthetic Speech Workload with Oculo-motor Indices: Preliminary Observations for Japanese Speech
337
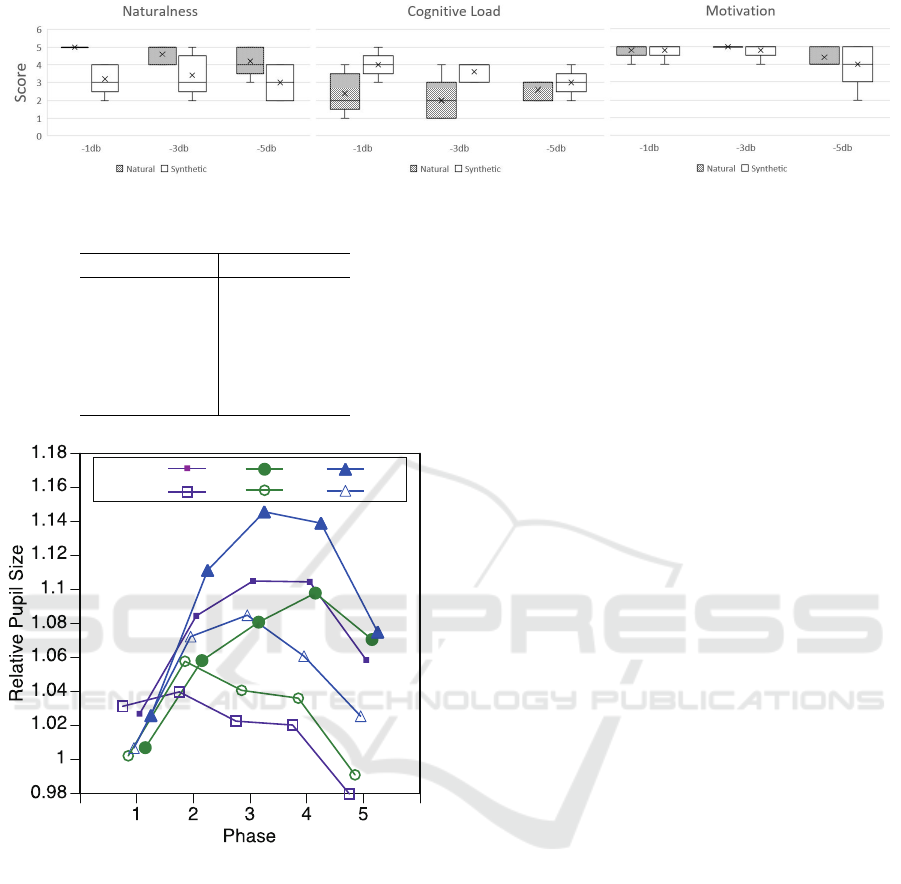
Figure 2: Comparison of participants’ ratings for Naturalness, Cognitive Load and Motivation.
Table 1: Recall accuracy.
Level S/N Mean STD
-1dB** N 1.00 -
S 0.74 0.11
-3dB N 0.96 0.09
S 0.78 0.16
-5dB** N 0.90 0.10
S 0.68 0.05
Correct:
Incorrect:
-1dB
-3dB
-5dB
Figure 3: Change in pupil size when reference material was
correctly and incorrectly repeated.
as the level of noise increases. Natural speech is also
perceived as less cognitively taxing than synthetic
speech. Interestingly, synthetic speech was rated as
easier to listen to at higher levels of noise. Finally,
for motivation we can see that participants were less
motivated to listen to the stimuli at the highest level
of noise which is potentially reflective of the task dif-
ficulty.
4.2 Pupil Dilation
Mean relative pupil sizes for natural and synthetic
speech at 3 levels of signal-to-noise, for all listening
phases (1-5) are summarised in Table 2. As the re-
call accuracy varies between different signal-to-noise
levels the pupil sizes are summarised for the correct
responses (see Table 1 for details). For the correct
recall attempts, we observe an increase in pupil size
until phase 3 and from thereon there is a decrease un-
til phase 5. Since pupil response has a time-delay
(Beatty, 1982), the size for phase-4 is also the high-
est in some conditions. This phenomenon coincides
with the findings of previous studies (Kahneman and
Beatty (1966); Beatty (1982)).
At phase 5 (after the recall phase), the pupil size
for synthetic speech is higher than for the natural
speech except for the -5dB condition. We conducted
a two-way Anova to determine the impact of speech
type (natural vs. synthetic) at three levels of signal-
to-noise (-1 ∼ -5dB) on pupil dilation. The results are
summarised in Table 3. In phase 5, we observed sta-
tistically significant differences in pupil sizes for both
factors (speech sound: F(1, 348) = 5.91, p < 0.05 and
sound level: F(2, 348) = 3.14, p < 0.05). The inter-
action is not significant. Mean pupil size for synthetic
speech is larger than for natural sound, and also pupil
size increases with the level of signal-to-noise ratio (-
1dB to -5dB).
In the next step, we compared the pupil sizes for
correct and incorrect responses. Figure 3 presents par-
ticipants’ relative pupil size for experimental phases
1-5. The figure compares pupillary changes between
correct and incorrect recall attempts. For the correct
recall attempts, pupil size increases until phase 3 and
from there decreases until phase-5. In particular, the
peak is most prominent for the -5dB condition, which
indicates that this condition requires the most mental
effort. For the incorrect recall attempts, we observe
a downward trend with the exception of -5dB condi-
tion, where there is an increase in phase 3, however
the peak is flatter as compared to correct recall at-
tempts. The trajectory of changes in pupil size for
incorrect responses seems to indicate that the subjects
gave up on their recall attempts after the phase 2.
4.3 Pupil Oscillations
When the pupil size changes, some pupillary os-
cillations in the lower frequency band are observed
BIOSIGNALS 2021 - 14th International Conference on Bio-inspired Systems and Signal Processing
338
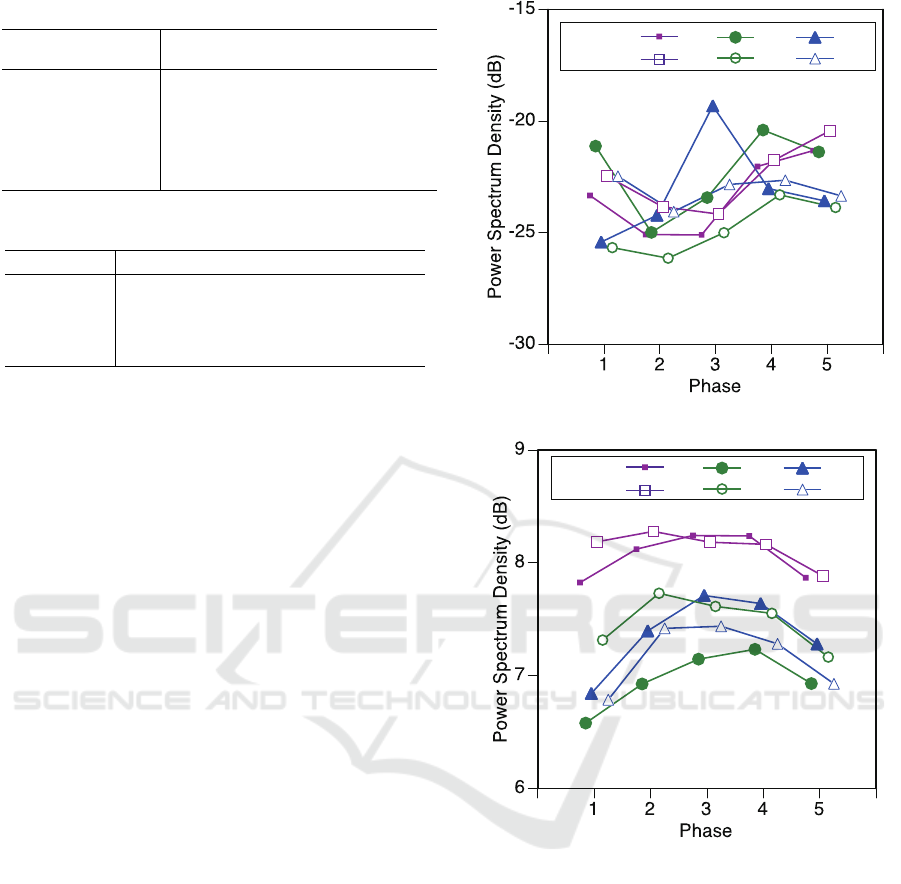
Table 2: Mean pupil sizes during 5 phases.
Phase
Level N/S N 1 2 3 4 5
-1dB N 76 1.02 1.05 1.07 1.07 1.01
S 54 1.02 1.07 1.10 1.10 1.07
-3dB N 66 1.02 1.07 1.10 1.10 1.05
S 50 1.02 1.07 1.09 1.11 1.08
-5dB N 64 1.02 1.10 1.15 1.13 1.08
S 44 1.02 1.09 1.12 1.12 1.08
Table 3: Two-way ANOVA for pupil sizes at pahse 5.
Source df SS V F Pr
Nat/Syn* 1 0.076 0.076 5.91 0.02
Level* 2 0.081 0.040 3.14 0.04
Interaction 2 0.057 0.028 2.22 0.11
Error 348 4.444 0.013
as a low-pass filter due to the biological signal
(Duchowski et al., 2018). As presented in previous
work, these frequency powers of pupillary changes
can sometimes be used as an index of mental activity
(Nakayama and Shimizu, 2004; Peysakhovich et al.,
2015).
We calculated power spectrum densities (PSD) for
each phase in a trial at frequency powers of 1.88Hz
and 3.75Hz.
PSDs at 1.88Hz are compared for both types of
speech at 3 noise-to-signal ratios across 5 phases.
We observe significant differences in PSDs between
sound sources except for the -1dB condition. The
maximum powers are marked at phase 3 for the -5dB
condition, and at phase-4 for -1dB and -3dB condi-
tions. The sound levels seem to influence pupil oscil-
lations.
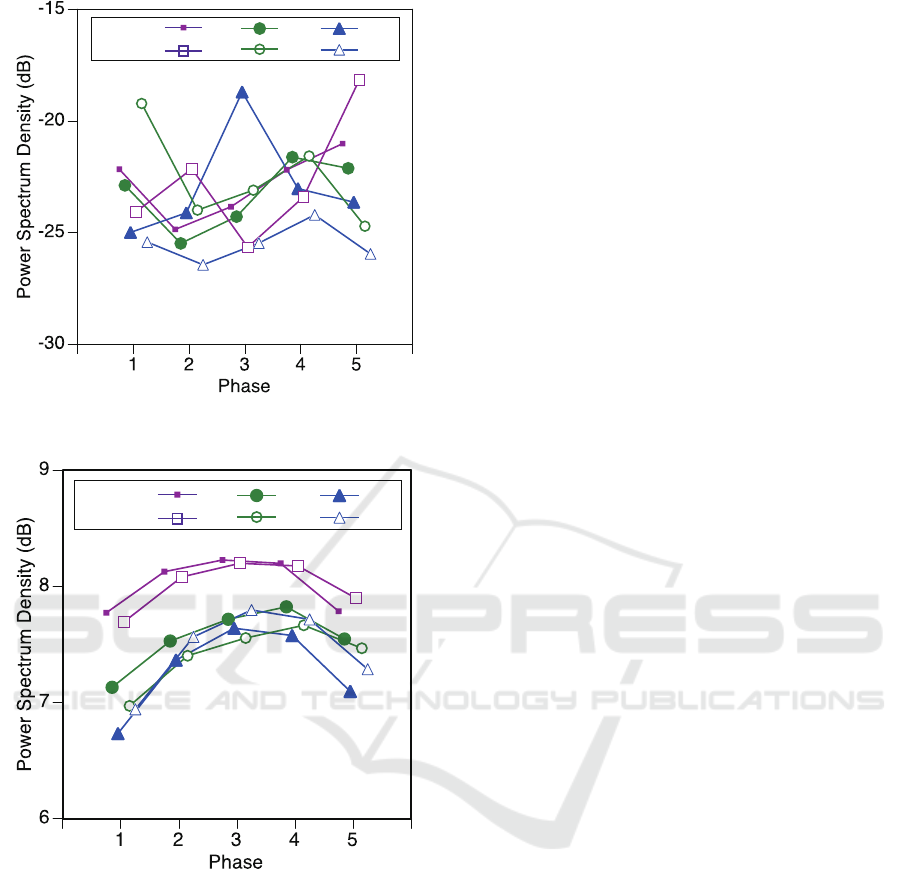
PSDs at 3.75Hz are compared and summarised in
Figure 4. All PSDs are minimised during the memo-
rising phase (phase 2), this suggests that participants
were focused while the speech stimuli were being
played. The maximised PSDs are different between
different noise-to-signal levels; at phase 3 for -5dB,
phase-4 for -3dB, and phase-5 for -1dB. However, no
statistically significant differences were detected. For
most conditions the powers are the minimum level at
phase 2, the memorising stage. After phase 2, pupil
oscillation in higher frequency increased with the ex-
perimental phases. The maximum phases are phase
5 for -1dB condition, phase 4 for -3dB condition, and
phase 3 for -5dB. The levels of noise influenced pupil-
lary oscillation for a longer amount of time.
Frequency power spectrum densities (PSDs =
1.88Hz) - presented in Figure 7 - are summarised
as two a dimensional category: natural (N) and syn-
thetic (S) at three signal-to-noise levels (-1dB, -3dB,
and -5dB). There are statistically significant differ-
Natural:
Synthetic:
-1dB
-3dB
-5dB
3.75Hz
Figure 4: Frequency power of pupil oscillation (f=3.75Hz).
Correct:
Incorrect:
-1dB
-3dB
-5dB
1.88Hz
Figure 5: Correct and incorrect recall responses for f =
1.88Hz).
ences (p<0.05) in PSDs between natural and syn-
thetic sounds for level -3dB and -5dB. However, the
orders are different between two conditions. At -
3dB, oscillations are higher for natural than synthetic
speech and for -5dB the reverse is the case. On the
other hand, the maximum powers are marked at phase
4 for the condition -1dB and -3dB, and at phase 3
for the condition -5dB. The highest levels of mental
workload were observed at the recall phase (phase 4)
for -1dB and -3dB, and at retention phase (phase 3)
for -5dB. This may indicate that a higher level of noise
makes retention more difficult for natural speech.
PSDs are compared between correct and failed re-
sponses for PSDs = 1.88Hz (Figure 5) and PSDs =
3.75 (Figure 6). For correct responses the pupil os-
Evaluating Synthetic Speech Workload with Oculo-motor Indices: Preliminary Observations for Japanese Speech
339
Correct:
Incorrect:
-1dB
-3dB
-5dB
3.75Hz
Figure 6: Correct and incorrect recall responses for f =
3.75Hz).
Natural:
Synthetic:
-1dB
-3dB
-5dB
1.88Hz
Figure 7: Frequency power of pupil oscillation (f=1.88Hz).
cillations reach a maximum at phase 3 or 4 (PSDs =
1.88Hz). However, in incorrect responses our data
shows that the maximum occurs at the memorising
phase (phase 2); when subjects failed the memorisa-
tion, the power monotonically decreases. Frequency
power spectrum densities (PSDs = 3.75Hz) are com-
pared between correct and failed responses. When the
recall failed, the maximums for pupil oscillation were
observed in phase 5 for -1dB, and phase 4 for -3dB
and -5dB.
5 DISCUSSION
Our analysis of pupillary responses for natural and
synthetic Japanese speech at three different signal-to-
noise levels leads us to the following observations.
Pupil Dilation: We observed statistically signifi-
cant differences between natural and synthetic speech
at the final experimental stage - phase 5 (relax and
refresh) for all signal-to-noise levels except -5dB.
This may indicate that at this level, for the syn-
thetic speech, participants’ attention threshold was
exceeded. There is a rapid increase of pupil size in
phase 4 and subsequently it takes longer for pupils to
stabilise. It is possible that participants may have been
reflecting whether their response was correct. For cor-
rect responses we observed peaks at phase 3, with
the exception of condition -3dB where pupil dilation
peaks in phase 4. This may indicate that higher lev-
els of noise trigger quicker pupillary responses (faster
rate of increase). With regards to the RQ1, our find-
ings are in line with previous research Govender et al.
(2019) - indicating that synthetic speech imposes a
higher cognitive load as compared to natural speech.
Pupil Oscillations: At 1.88Hz, maximum power
spectrum densities were observed at the retention
phase (phase 3) for condition -5dB, and the recall
phase (phase 4) for conditions -1dB and -3dB. It
seems that the high level of noise led to an increased
cognitive load at the retention stage that was higher
than in the recall phase. We, therefore, hypothesise
that high levels of noise led to stronger pupil oscil-
lations and low recall accuracy as observed in Table
1. Following the failed attempt to retain information,
the oscillations decrease (less cognitive resources are
involved in recall). There is similarity between dila-
tion and oscillations as both tend to peak at the reten-
tion stage for -5dB and for the recall phase for -1dB
and -3dB which indicates that using oscillations also
provides empirical insights for assessing the cognitive
workload of TTS systems (RQ2).
Self-reported Measures: reflect the findings of
the study by Govender et al. Govender et al. (2019)
- with synthetic speech being ranked as more cogni-
tively taxing than natural speech at all levels of signal-
to-noise. Interestingly, however, while for natural
speech, cognitive load ratings remain relatively sta-
ble, synthetic speech is ranked as less taxing at higher
levels of noise (see Figure 2 for details). Partici-
pants have retained high levels of listening motivation
throughout the experiment with the exception of the -
5dB condition for synthetic speech where we can see
a drop in motivation. This trend could be attributed to
excessive level of noise, making the listening task too
difficult in this condition.
BIOSIGNALS 2021 - 14th International Conference on Bio-inspired Systems and Signal Processing
340

6 LIMITATIONS AND FUTURE
WORK
While our study provides insights into using a com-
bination of oculo-motor indices to evaluate Japanese
TTS, we are mindful of its limitations. Firstly, the
study was conducted on a relatively small sample (n
= 16) of predominantly male participants. Secondly,
the study was conducted in a lab environment using
computer generated speech-shaped noise. Thus eval-
uation results can vary in other environments, such as
real-life noisy listening conditions or an-echoic cham-
ber. Thirdly, self-reported measures are subject to
inter-rater variability which could affect the objec-
tive assessment of speech. Finally, it should also be
noted that other factors beyond our control, such as
stress, could have affected the experimental outcome
as some participants were more concerned about pro-
viding correct responses.
Although the above limitations may affect the
generalisability of our research results, they also high-
light the variables that should be taken into account
in order to make evaluation of TTS more robust and
standardised. In future research, the issues of gender
and experimental design should be given more atten-
tion in order to ensure higher ecological validity of
evaluations. Firstly, whenever possible, participant
samples should be gender- and age-balanced, with
findings investigated separately for each gender and
age group. Secondly, similar consideration should be
given to the types of voices that are selected for syn-
thesis. Thirdly, calibration of sound pressure should
also be considered in evaluation - while the volume
of sound can have an impact of participants’ cogni-
tive workload, to the best of our knowledge, there are
currently no official guidelines on volume calibration.
Finally, it should be ensured that differences in par-
ticipants’ cognitive abilities are accounted for - this
could be addressed by administering a listening test
at the pre-experiment stage.
7 CONCLUSIONS
This paper presented the results of an in-lab evalu-
ation experiment in which participants listened to a
series of Japanese speech stimuli mixed with noise.
In line with the findings of previous research on En-
glish speech Govender et al. (2019), we found that
synthetic speech led to a faster increase in pupil size
(sharper curve) indicating more cognitive load. This
result was supported by participants’ perceptions who
rated synthetic speech as more cognitively taxing as
compared with natural speech. On the other hand,
we found that participants’ pupil oscillations were
stronger at higher levels of noise for natural speech
at the retention phase, but lower at the recall state in-
dicating the impact of external factors such as stress
or excessive level of noise (ceiling effect).
Although our results are preliminary, we have
shown that pupil oscillations can provide additional
measurements for cognitive workload of synthetic
speech in noisy listening conditions, and established
a baseline for future experiments. In order to fur-
ther validate the accuracy of our findings, future work
should investigate if our result can be replicated us-
ing diverse participant samples - to account for gen-
der specific hearing sensitivity (cf.McFadden (1998)).
We hope that our study will encourage discussion on
how other biological signals such as pupil oscillations
could expand TTS evaluation methods in future.
ACKNOWLEDGEMENTS
We would like to express our gratitude to Professor
Takao Kobayashi for his advice with selecting the
speech corpus for our study. We would also like to
thank all participants who took part in the experiment.
REFERENCES
Beatty, J. (1982). Task-evoked pupillary responses, process-
ing load, and the structure of processing resources.
Psychological bulletin, 91(2):276.
Duchowski, A. T., Krejtz, K., Krejtz, I., Biele, C., Niedziel-
ska, A., Kiefer, P., Raubal, M., and Giannopoulos, I.
(2018). The index of pupillary activity: Measuring
cognitive load vis-
`
a-vis task difficulty with pupil os-
cillation. In Proceedings of the 2018 CHI Conference
on Human Factors in Computing Systems, pages 1–13.
Govender, A. and King, S. (2018a). Measuring the cog-
nitive load of synthetic speech using a dual task
paradigm. In Interspeech, pages 2843–2847.
Govender, A. and King, S. (2018b). Using pupillometry to
measure the cognitive load of synthetic speech. Sys-
tem, 50:100.
Govender, A., Wagner, A. E., and King, S. (2019). Using
pupil dilation to measure cognitive load when listen-
ing to text-to-speech in quiet and in noise. In INTER-
SPEECH, pages 1551–1555.
HTS Working Group (2015). The Japanese TTS System
Open JTalk.
Kahneman, D. and Beatty, J. (1966). Pupil diameter and
load on memory. Science, 154(3756):1583–1585.
Kursawe, M. A. and Zimmer, H. D. (2015). Costs of storing
colour and complex shape in visual working memory:
Insights from pupil size and slow waves. Acta Psy-
chologica, 158:67–77.
Evaluating Synthetic Speech Workload with Oculo-motor Indices: Preliminary Observations for Japanese Speech
341

McFadden, D. (1998). Sex differences in the auditory sys-
tem. Developmental Neuropsychology, 14(2-3):261–
298.
Nakamura, K. and Gordon-Salant, S. (2011). Speech per-
ception in quiet and noise using the hearing in noise
test and the japanese hearing in noise test by japanese
listeners. Ear and Hearing, 32(1):121–131.
Nakayama, M. and Shimizu, Y. (2004). Frequency analysis
of task evoked pupillary response and eye-movement.
In Spencer, S. N., editor, Eye-Tracking Research and
Applications Symposium 2002, pages 71–76, New
York, USA. ACM, ACM Press.
Ohata, K. (2004). Phonological differences between
japanese and english: Several potentially problematic.
Language learning, 22:29–41.
Peysakhovich, V., Causse, M., Scannella, S., and Dehais, F.
(2015). Frequency analysis of a task-evoked pupillary
response: Luminance-independent measure of men-
tal effort. International Journal of Psychophysiology,
97:30–37.
Rabiner, L. R. (1989). A tutorial on hidden Markov models
and selected applications in speech recognition. Pro-
ceedings of the IEEE, 77(2):257–286.
Simantiraki, O., Cooke, M., and King, S. (2018). Impact of
different speech types on listening effort. In INTER-
SPEECH, pages 2267–2271.
Winn, M. B., Wendt, D., Koelewijn, T., and Kuchinsky,
S. E. (2018). Best practices and advice for using pupil-
lometry to measure listening effort: An introduction
for those who want to get started. Trends in hearing,
22:2331216518800869.
Zekveld, A. A., Kramer, S. E., and Festen, J. M. (2010).
Pupil response as an indication of effortful listening:
The influence of sentence intelligibility. Ear and hear-
ing, 31(4):480–490.
Zen, H., Senior, A., and Schuster, M. (2013). Statistical
parametric speech synthesis using deep neural net-
works. In Proc. ICASSP, pages 7962–7966.
BIOSIGNALS 2021 - 14th International Conference on Bio-inspired Systems and Signal Processing
342
