Towards Combined Open Set Recognition and Out-of-Distribution
Detection for Fine-grained Classification
Alexander Gillert
1
and Uwe Freiherr von Lukas
1,2
1
Fraunhofer Institute for Computer Graphics Research IGD, Rostock, Germany
2
Department of Computer Science, University of Rostock, Germany
Keywords:
Fine-grained Classification, Out-of-Distribution Detection, Open Set Recognition.
Abstract:
We analyze the two very similar problems of Out-of-Distribution (OOD) Detection and Open Set Recognition
(OSR) in the context of fine-grained classification. Both problems are about detecting object classes that a
classifier was not trained on, but while the former aims to reject invalid inputs, the latter aims to detect valid
but unknown classes. Previous works on OOD detection and OSR methods are evaluated mostly on very
simple datasets or datasets with large inter-class variance and perform poorly in the fine-grained setting. In
our experiments, we show that object detection works well to recognize invalid inputs and techniques from the
field of fine-grained classification, like individual part detection or zooming into discriminative local regions,
are helpful for fine-grained OSR.
1 INTRODUCTION
According to recent estimates (Barrowclough et al.,
2016) there may be more than 18,000 species of birds
in the world. When building a vision based bird clas-
sification system, it is infeasible to maintain an image
dataset for training on all of them, especially since
many are still undiscovered. Even limiting the classi-
fication to species from a local area is extremely chal-
lenging due to Zipf’s law (Zipf, 1932), which implies
that for the majority of object classes only few data
samples are available. Thus, one usually has to resort
to train on a dataset of only those species for which
enough training data are available, which leaves room
for error when the system encounters rare birds which
are not in the training dataset. Additionally, in the end
there is often little control over whether the deployed
system will be used only on the species from that local
area or on birds at all. In short: the testing distribution
of deployed systems is rarely the same as the training
distribution. This problem applies to many more ar-
eas, not only bird classification.
In machine learning, this problem is known
as Open Set Recognition (OSR) or Out-of-
Distribution (OOD) Detection. The difference be-
tween OOD detection and OSR is subtle and those
two terms are sometimes used synonymously in lit-
erature. Strictly speaking however, in OOD detec-
tion, a classifier is trained on one dataset and evalu-
Fine-Grained
Classi cation
Out-of-Distribution
Detection
Invalid
Unknown
Inference
Training
American Crow
Common Raven
American Crow
Open Set
Recognition
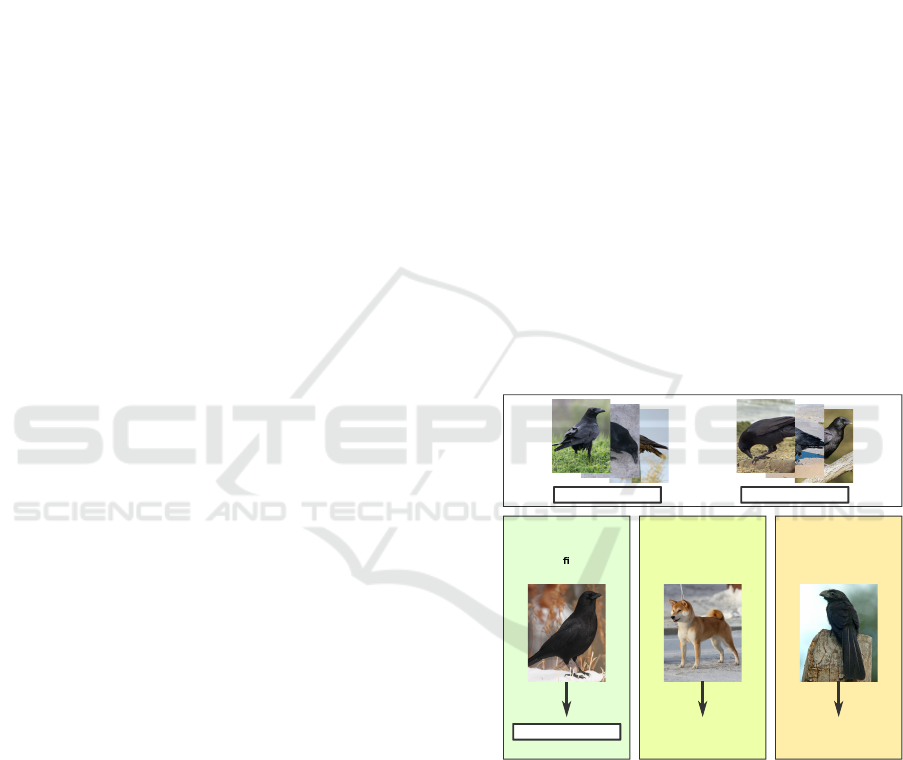
Figure 1: Illustration of the problem: A classifier is trained
on images of two very similar classes. During inference,
when presented with an image from one of those classes it
should predict the correct label. If the input image is from
a class that is not in the training distribution, it should ei-
ther reject the sample as invalid or mark it as a valid but
unknown class, depending on the semantic distance.
ated on another, usually completely unrelated dataset,
whereas in OSR a subset of classes from a dataset is
used for training and a hold-out set of other classes
from the same dataset is used for evaluation. OOD
detection is thus more concerned with recognizing
or rejecting invalid inputs, the goal of OSR on the
Gillert, A. and von Lukas, U.
Towards Combined Open Set Recognition and Out-of-Distribution Detection for Fine-grained Classification.
DOI: 10.5220/0010340702250233
In Proceedings of the 16th International Joint Conference on Computer Vision, Imaging and Computer Graphics Theory and Applications (VISIGRAPP 2021) - Volume 5: VISAPP, pages
225-233
ISBN: 978-989-758-488-6
Copyright
c
2021 by SCITEPRESS – Science and Technology Publications, Lda. All rights reserved
225

other hand is to recognize new or unknown (but valid)
classes. Figure 1 gives an illustration of the two prob-
lems.
In this work, we are interested in combining both
problems: without additional training data detecting
object classes that the classification system was not
trained on but also making the distinction between
completely invalid or valid but unknown classes. We
approach the OOD detection objective as an object
detection task: object detectors learn to differentiate
between object and background within the same im-
age. The detected objects, or object parts, are then
useful to differentiate between known and unknown
classes for the OSR objective.
It is well known (Guo et al., 2017), that despite
ever increasing accuracy, modern neural networks
tend to be poorly calibrated. This means, they are
prone to give overly confident prediction results, even
in when the prediction is incorrect. Even worse, high
confidence predictions are often returned if the input
is completely unrecognizable (Nguyen et al., 2015),
slightly perturbed (Goodfellow et al., 2014) or irrel-
evant (Hendrycks and Gimpel, 2017) to the task, i.e
input outside of the distribution that the network was
not trained on. We observe that this problem worsens
even more when dealing with fine-grained distribu-
tions.
The contributions of this paper are as follows:
• A combination of OSR and OOD detection by
making a distinction between known, unknown
and invalid classes
• A framework based on object detection with both
strong and weak supervision that is able to rec-
ognize the above error cases without explicitly be-
ing trained on them
• Baseline evaluations on several realistic fine-
grained datasets
2 RELATED WORK
2.1 Open Set and Out-of-Distribution
Detection
Despite the difference between OSR and OOD detec-
tion noted above, we treat both as the same problem in
this section, since the methods are mostly applicable
to both.
The work of (Hendrycks and Gimpel, 2017) has
set up a baseline for OOD detection. They noticed
that trained neural networks predict higher softmax
scores for examples that are close to the training
dataset than for those new to them. ODIN (Liang
et al., 2018) extends this idea by using temperature
scaling and modifying the input images with pertru-
bations created from the backpropagated gradient to
separate in-distribution from out-of-distribution sam-
ples. OpenMax (Bendale and Boult, 2016) fits a
Weibull probability distribution on a per-class basis to
recalibrate the output activations between the trained
classes and an additional rejection class. If the re-
jection class has the maximum activation or if the
maximum activation falls below a threshold, the in-
put is rejected. (Lee et al., 2018) defines a confidence
score using the Mahalanobis distance at multiple lay-
ers within a network.
A common issue with the above works is that they
mostly use very simple datasets for evaluation: often
used datasets are MNIST, CIFAR-10 or even random
noise. Very few works evaluate on ImageNet (Rus-
sakovsky et al., 2015) and similar datasets. In our
evaluation we are interested in more challenging and
realistic fine-grained datasets.
The authors of (Ren et al., 2019) recognized the
need for more realistic evaluations in this field and
published a dataset for OOD prediction of genomic
sequences of bacteria. For this task, they introduce
likelihood ratios, which can be also applied to images,
yet they also evaluate only on coarse image datasets.
An obvious method for detecting unknown classes
is regularization with a background class during train-
ing. In (Hendrycks et al., 2018), the authors vastly
improved OOD detection performance by using an
auxiliary dataset as background examples. In a sense,
we also use this method, albeit implicitly since we
employ object detectors. In object detection, an im-
age is divided into positive and background samples.
We thus do not use additional data but only train on
the images that are relevant for the main classification
task.
A somewhat related area of research is General-
ized Zero-Shot Learning: here, a classifier is trained
on images together with a vector of attributes for each
class. At test time, new classes along with their at-
tributes are added to the pool and the classifier has
to predict the correct class according to the attributes.
Naturally, the classifier is biased towards the old, seen
classes, thus many algorithms employ a gating mech-
anism which tries to predict whether the input image
belongs to the seen or to the unseen classes. (Chen
et al., 2020) used a a spherical variational autoen-
coder to achieve remarkable OSR performance on the
fine-grained Caltech-UCSD-Birds (CUB) (Wah et al.,
2011) and Oxford Flowers datasets (Nilsback and Zis-
serman, 2008). However, this method requires the ad-
ditional annotation of visual attributes. In contrast,
VISAPP 2021 - 16th International Conference on Computer Vision Theory and Applications
226
x
y
q
φ
0
φ
1
φ
2
ψ
D
p
0
p
1
p
2
Open Set
Recognition
Out-of-Distribution
Detection
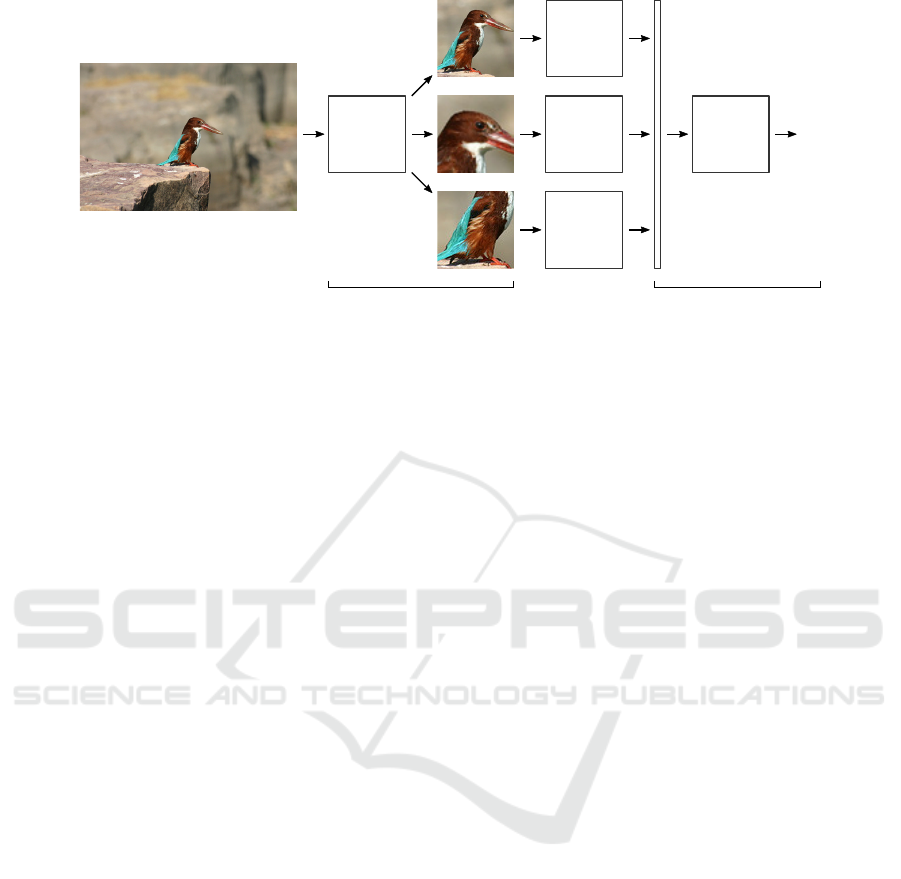
Figure 2: Overview of our classification framework.
in our weakly supervised method we only use image-
level labels.
Worth noting is also the research area Selective
Prediction or Classification with Reject Option.
Here, the goal is to make a model abstain from mak-
ing a prediction when it is not confident enough (Geif-
man and El-Yaniv, 2019), for example if the input is
too difficult or noisy. However, the works in this field
do not evaluate on new or unknown classes, but only
on the same classes that the model was trained on.
2.2 Fine-grained Classification
Fine-grained object categories exhibit a low inter-
class and a high intra-class variance. Therefore, for
the classification of those objects, subtle details on
(body) parts often play an important role. Many
previous works have focused on discrimitive local
part localization to improve performance, e.g (Zhang
et al., 2014; Lin et al., 2015; Berg and Belhumeur,
2013) only to name some of the most important ones.
Specifically, the method of (Zhang et al., 2014) first
detects those regions as bounding boxes, then extracts
features from those regions with specialized feature
extractors and finally combines those reigons with
a SVM. We pick up this idea for our classification
framework with minor modifications.
To avoid having to rely on costly additional part
annotations, a large body of works has focused on
weakly supervised methods. For example, (Fu et al.,
2017) uses a recursive attention mechanism to zoom
into the object of interest at different levels. Simply
getting a higher resolution crop of the object helps to
improve the classification accuracy and as we show
in this paper, also the OSR performance. We also use
weak supervision, albeit on a much simpler scale and
only on one level.
3 METHODS
3.1 Classification Framework
Our general intuition is that discriminitve local parts
are beneficial for fine-grained open set recognition,
as is the case for classification. Furthermore a failure
to detect those parts should indicate that the input is
invalid.
Our classification system is based on that of
(Zhang et al., 2014), an overview is shown in figure
2. We first train an object detector D to detect in-
dividual object parts. The targets for the object de-
tector come either directly from annotations if avail-
able (strong supervision) or from pseudo-labels gen-
erated from class activation maps as described in 3.2
(weak supervision). We do not use the geometric con-
straints between individual parts that were introduced
in (Zhang et al., 2014), because we have found the
detector to perform reasonably well without them.
The output of D is a set of tuples (b
i
,s
i
,c
i
) repre-
senting the predicted bounding box, confidence score
and part class, respectively. We take boxes b
i
with the
highest score for each part class c
i
and feed the cor-
responding image crops p
i
into feature extractors φ
i
,
that were fine-tuned for the respective parts. The fea-
tures φ
i
(p
i
) are then concatenated into vector q and
fed into a final small network ψ consisting of two lin-
ear layers with ReLU activation which gives the clas-
sification result y.
3.2 Weakly Supervised Bounding Boxes
Since bounding box annotations for body parts are
difficult to obtain, we additionally conduct exper-
iments with automatically generated pseudo label
Towards Combined Open Set Recognition and Out-of-Distribution Detection for Fine-grained Classification
227

bounding boxes as training targets for the object de-
tector. We opt for the simple method based on class
activation maps (CAM) as described by (Zhou et al.,
2016). The CAM heatmaps are created from an image
classifier that was trained on whole images.
For simplicity reasons, we only generate a single
box which represents the whole object instead of in-
dividual body parts. The bounding box is generated
by thresholding the CAM heatmap and then taking
the minimum and maximum coordinates of the largest
connected component. For the threshold we use a per-
centage of the maxium CAM value. We use 50% for
all evaluation datasets.
The generated pseudo label boxes are sometimes
not very accurate but since they are only used as train-
ing targets for the object detector, outliers are mostly
recovered after training.
3.3 OOD Detection Decision
For the OOD detection decision, i.e. whether an ob-
ject is valid or invalid, we directly use the scores s
i
re-
turned by the object detector. For multiple boxes, the
score is averaged and thresholded with a value δ
OOD
that has to be calibrated through cross validation. For-
mally, the decision function looks as follows:
f
OOD
(x) =
(
valid if
1
N
∑
N
i
s
i
≥ δ
OOD
invalid otherwise
(1)
3.4 OSR Decision
If the image has been classified as valid, we then ap-
ply the ODIN (Liang et al., 2018) method for the de-
cision whether an image belongs to a known object
or an unknown one. This method requires backprop-
agation of the gradients to create a perturbation of
the inputs. We avoid performing this costly operation
through all the feature extractors and only backprop-
agate up to the concatenation point q, i.e. we are only
perturbing the input of the linear layers in ψ:
˜
q = q − εsign
− ∇
q
logσ
ˆy
(ψ(q)/T )
(2)
where σ
i
is the value of the softmax function at index
i, ˆy = argmax
i
σ
i
, T is the temperature hyperparameter
and ε is the perturbation magnitude hyperparameter.
The perturbed feature vector
˜
q is again fed through ψ
to give the OSR decision function:
f
OSR
(x) =
(
known if max
i
σ
i
ψ(
˜
q)/T
≥ δ
OSR
unknown otherwise
(3)
As before, the threshold δ
OSR
should be calibrated
through cross validation.
4 EXPERIMENTS
4.1 Experimental Setup
For our experiments we use an image resolution
of 224x224 pixels (where not otherwise noted),
ResNet50 (He et al., 2016) architecture for the fea-
ture extractors and Faster-RCNN (Ren et al., 2015)
with ResNet50 backbone as implemented in the De-
tectron2 framework (Wu et al., 2019).
4.1.1 Datasets and Splits
Here we give an overview over the datasets used in
our experiments and which classes we use for train-
ing or exclude for evaluation of OSR performance.
As often done, we use neural networks that were pre-
trained on the ImageNet (Russakovsky et al., 2015)
dataset as a starting point and fine-tune on the tar-
get dataset. As noticed by (Xian et al., 2018), classes
which are contained in both ImageNet and the target
dataset exhibit a higher performance than those only
in the target dataset. Therefore, care must be taken
when selecting the evaluation splits to avoid overlap
with ImageNet, since we want to test on classes com-
pletely unseen by our neural network.
Caltech-UCSD Birds-200-2011 (CUB). (Wah
et al., 2011) contains 11,788 images of 200 bird
species. We train on 150 species and use the re-
maining 50 species for the evaluation of the OSR
performance. To avoid overlap with the ImageNet
dataset, we use the split proposed by (Xian et al.,
2018). The dataset annotation includes up to 15
body part locations per image as keypoints which we
combine to head and torso bounding boxes together
with the additional annotated whole body bounding
box for our strongly supervised scenario.
Oxford-IIIT Pet Dataset (PET). (Parkhi et al.,
2012) contains 7,349 images of 37 breeds of cats and
dogs. We select the 3 dog breeds and 5 cat breeds
listed in table 1 because they are not contained in Im-
ageNet as a hold-out evaluation set. The annotated
head bounding box and the bounding box containing
the segmentation mask are used for the strong super-
vision.
Table 1: Dog and cat breeds from the PET dataset used as a
hold-out set for OSR. These classes are not in ImageNet.
American Bulldog Abyssinian Maine Coon
Havanese Birman Russian Blue
Shiba Inu British Shorthair
VISAPP 2021 - 16th International Conference on Computer Vision Theory and Applications
228

Stanford Cars. (Krause et al., 2013) contains
16,185 images of 196 classes of cars. The classes
have several levels of granularity, namely make,
model and year. We create two splits: in the easier
split we exclude makes and in the more challenging
one we exclude single car models, leaving at least one
model from each make in the training data. ImageNet
contains several coarse ”car” classes and car parts,
however not subdivided into makes or even models.
Therefore, we do not take additional precautions and
select the hold-out sets semi-randomly as listed in the
tables 2 and 3. We only evaluate weak supervision for
this dataset.
Table 2: Car makes from the Standford Cars dataset used as
a hold-out evaluation set.
Acura Daewoo HUMMER Jaguar Mitsubishi
Audi Ferrari Honda Lincoln Porsche
Table 3: Car models from the Standford Cars dataset used
as a hold-out evaluation set. Note that for every of those
models there is at least one model from the same make in
the training set.
Acura ZDX Hatchback 2012 HUMMER H3T Crew Cab 2010
Audi RS 4 Convertible 2008 Ferrari FF Coupe 2012
Audi 100 Sedan 1994 Ferrari 458 Italia Coupe 2012
Audi S4 Sedan 2012 Honda Accord Sedan 2012
BMW 1 Series Coupe 2012 Hyundai Accent Sedan 2012
BMW X3 SUV 2012 Hyundai Azera Sedan 2012
Bentley Mulsanne Sedan 2011 Jeep Patriot SUV 2012
Cadillac SRX SUV 2012 Jeep Compass SUV 2012
Chrysler Aspen SUV 2009 Lamborghini Aventador Coupe 2012
Dodge Caliber Wagon 2007 Mercedes-Benz S-Class Sedan 2012
Dodge Caravan Minivan 1997 Nissan Leaf Hatchback 2012
Dodge Charger Sedan 2012 Suzuki SX4 Sedan 2012
Additionally we use the following datasets for
evaluation: iNaturalist2017 (iNat17) (Van Horn et al.,
2018), NABirds (Van Horn et al., 2015), Stan-
ford Dogs (Khosla et al., 2011) and FGVC-Aircraft
(FGVC) (Maji et al., 2013)
4.1.2 Evaluation Metrics
We use the two standard metrics, already used by pre-
vious works:
FPR95. False positive rate at 95% true positive
rate. Since we want to accept as many positive (in-
distribution) samples as possible, we search for a
threshold that gives a high acceptance rate (or true
positive rate (TPR)) and calculate the false positive
rate for this threshold. It can be easily interpreted but
is prone to small changes of the threshold.
AUROC. Area under receiver operating character-
istic. This metric is calculated by computing the FPR
and TPR values at different thresholds and taking the
area between the resulting curve and the x-axis. It
therefore does not rely on a single threshold and is
less prone to fluctuations than FPR95, giving a good
general performance estimate.
4.2 OOD Detection Results
Table 4 shows the OOD detection performance of
models trained on CUB, CAR and PET and evalu-
ated on other datasets that do not contain birds, cars or
cats and dogs, respectively. For each of these datasets
we randomly choose 1000 images as negative sam-
ples and 1000 images from the training dataset (both
known and unknown classes, but always unseen im-
ages) as positive samples.
We only compare to ODIN (Liang et al., 2018)
because this method is generally regarded as the state
of the art, which is also confirmed in our experiments
and in a review in (Roady et al., 2019). There is a
significant performance improvement when using the
box scores for the OOD decision instead of using the
ODIN score. We attribute this to the way an object
detector learns: it adds a background class and sub-
divides an image into a grid, learning for each of the
grid cells if it is background or not. This can be seen
as a kind of outlier exposure similar to (Hendrycks
et al., 2018), but within the same image and without
additional data.
The performance for some object classes is clearly
worse than for others, for example a model trained
on CUB can reject cars with almost perfect certainty,
whereas other animal families, such as mammals, are
much more difficult to reject if not explicitly seen be-
fore. After all, they may still have similar body parts
(head, eyes) that resemble those of birds.
Both strongly and weakly supervised object detec-
tion prove to be superior to the ODIN method. More-
over, strong supervision has a clear advantage over
weak supervision, which is due to the better quality
of the box targets and the additional body part boxes.
An interesting failure case of weak supervision can
be seen in the evaluation of the Arachnida and Insecta
superclasses from iNat17: the FPR95 metric is with
around 50% only slightly better than ODIN and AU-
ROC is even worse. The disparity between those two
metrics indicates a strong separation in easy and hard
images within the dataset. With insects flying through
the air or spiders hanging on webs, the object detector
confuses them with birds. With low-scoring body part
boxes these cases can still be rejected. Some common
examples are illustrated in figure 3.
Table 6 shows the OOD detection performance of
the same model on all-birds datasets. Since these
datasets do not contain invalid images, the AUROC
Towards Combined Open Set Recognition and Out-of-Distribution Detection for Fine-grained Classification
229
Table 4: OOD detection performance for models trained on CUB, PET and CAR and evaluated on other datasets or sub-
datasets from iNat17. The values represent the AUROC↑ / FPR95↓ metrics. Bold values indicate the overall best result,
underlined values indicate the best result with only image-level labels.
Strong Supervision Weak Supervision
Training
Dataset
Test
Dataset
Whole Image
(ODIN)
Whole Object
(ODIN)
Box Scores Whole Object
(ODIN)
Box Scores
CUB
CAR 0.981 / 0.09 0.972 / 0.17 0.997 / <0.01 0.986 / 0.07 0.997 / <0.01
PET 0.813 / 0.74 0.870 / 0.67 0.970 / 0.15 0.907 / 0.48 0.979 / 0.08
Arachnida 0.827 / 0.69 0.882 / 0.58 0.976 / 0.13 0.880 / 0.58 0.780 / 0.51
Insecta 0.836 / 0.64 0.873 / 0.59 0.969 / 0.19 0.881 / 0.58 0.776 / 0.51
Mammalia 0.828 / 0.67 0.825 / 0.69 0.927 / 0.32 0.854 / 0.65 0.874 / 0.38
Plantae 0.892 / 0.51 0.930 / 0.37 0.992 / 0.03 0.914 / 0.44 0.952 / 0.14
Protozoa 0.871 / 0.52 0.899 / 0.49 0.994 / 0.01 0.875 / 0.58 0.947 / 0.17
Reptilia 0.837 / 0.62 0.840 / 0.64 0.981 / 0.11 0.840 / 0.68 0.924 / 0.23
PET
CUB 0.891 / 0.51 0.895 / 0.52 0.990 / 0.05 0.900 / 0.50 0.964 / 0.13
CAR 0.994 / 0.02 0.997 / <0.01 0.999 / <0.01 0.998 / <0.01 0.999 / <0.01
CAR
Makes
CUB 0.954 / 0.23 - - 0.935 / 0.40 0.999 / <0.01
PET 0.908 / 0.45 - - 0.853 / 0.71 0.999 / <0.01
FGVC 0.980 / 0.12 - - 0.957 / 0.27 0.995 / 0.01
CAR
Models
CUB 0.952 / 0.30 - - 0.972 / 0.14 0.999 / <0.01
PET 0.940 / 0.35 - - 0.922 / 0.46 0.999 / <0.01
FGVC 0.976 / 0.15 - - 0.982 / 0.10 0.996 / 0.02
Table 5: OSR performance for the 3 main datasets. The values represent the AUROC↑ / FPR95↓ metrics. Bold values indicate
the overall best result, underlined values indicate the best result with only image-level labels.
Strong Supervision Weak Supervision
Training
Dataset
Test
Dataset
Whole Image
(ODIN)
Whole Object Head Torso Combined Whole Object
CUB Hold-out 0.769 / 0.81 0.821 / 0.72 0.789 / 0.77 0.753 / 0.82 0.866 / 0.66 0.829 / 0.68
CUB NABirds 0.718 / 0.89 0.786 / 0.78 0.800 / 0.78 0.733 / 0.85 0.841 / 0.72 0.772 / 0.81
PET Hold-out 0.821 / 0.71 0.860 / 0.63 0.846 / 0.62 - 0.893 / 0.52 0.857 / 0.62
PET Dogs 0.687 / 0.86 0.747 / 0.84 0.715 / 0.89 - 0.789 / 0.79 0.732 / 0.83
CAR Makes Hold-out 0.899 / 0.55 - - - - 0.943 / 0.33
CAR Models Hold-out 0.812 / 0.69 - - - - 0.835 / 0.62
Table 6: OOD detection performance for a model trained
on CUB and evaluated on datasets that contain only images
of birds i.e. there are no negative samples. The values rep-
resent the FPR↓ metric with a fixed threshold δ
OOD
of 0.5.
(Sub-)Dataset
Strong
Supervision
Weak
Supervision
NABirds <0.01 <0.01
iNat2017 (Aves) 0.14 0.05
and FPR95 metrics cannot be computed and we re-
sort to the FPR metric with a fixed threshold δ
OOD
of 0.5. The degraded performance on the iNatural-
ist2017 dataset is mostly due to the difference in im-
age quality: it contains many images with birds far
away from the camera, whereas the images in CUB
and NABirds are mostly well focused on the target.
4.3 OSR Results
The main results for OSR are presented in table 5.
Here too, we only compare to ODIN because our
method is simply a set of additions to it and we want
to show that these additions are responsible for the
improved performance. These changes would also be
beneficial if applied to some other base method.
The evaluations are performed on the hold-out
splits as defined in 4.1.1 and the additional datasets
NABirds and Stanford Dogs. We manually count 108
common bird species in CUB and NABirds (exclud-
ing female and juvenile birds which are mostly not
present in CUB) and 18 common dog species in the
PET and Dogs datasets.
We observe an improvement in performance for
zooming in on the target object to get a higher reso-
lution and an additional improvement for the combi-
nation of different body parts. The ROC curves for
a model trained on CUB with strong supervision are
also shown in figure 4 for better illustration. Nev-
ertheless, with around 66% false positive rate as the
best value for the CUB dataset and even worse when
evaluated on NABirds, the results are still improvable.
VISAPP 2021 - 16th International Conference on Computer Vision Theory and Applications
230
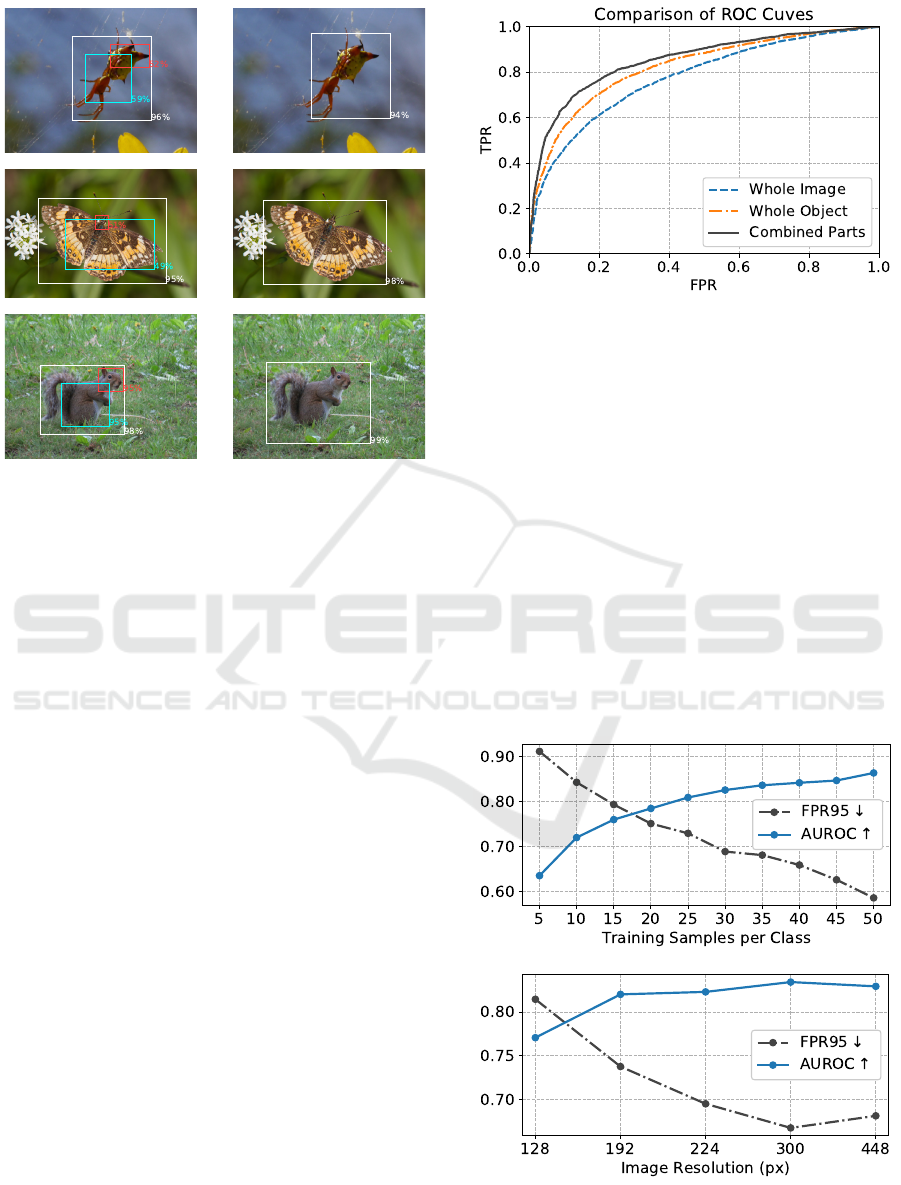
Figure 3: Illustration of common OOD detection failure
cases. Left column: boxes predicted in the strongly super-
vised setting, right column: weakly supervised. Percent-
ages represent the box scores as returned by the object de-
tector. Despite being trained only on birds, the object de-
tector is sometimes able to recognize other animals, such
as spiders, butterflies or squirrels and their body parts. The
whole object box (white) is often even predicted with a high
confidence score. Zoom in for details.
The performance disparity between the CAR makes
and CAR models splits demonstrates that difficulty
increases with finer granularity in the data.
In general, we notice that the OSR performance
strongly correlates with the general classification ac-
curacy for the in-distribution classes. Therefore,
standard techniques that help to improve the accu-
racy should also be beneficial for OSR. To test this
intuition, we conduct more experiments with addi-
tional data and different image resolutions. Keep-
ing the same hold-out set, we add more data from
the Caltech-UCSD Birds 200 2010 dataset (Welinder
et al., 2010) which contains the same classes but is
still disjoint with the 2011 version, that we use above.
The results can be seen in figure 5 and mostly confirm
our intuition.
5 CONCLUSION AND
DISCUSSION
We have presented a framework for the detection of
known, unknown and invalid classes. We have found
that object detection can be an excellent choice for
the detection of invalid images, because it learns to
Figure 4: Comparison of ROC curves for OSR. The model
was trained on the CUB dataset.
differentiate objects and background within the same
image. It can be even used with only image-level la-
bels but improves with ground truth annotations. The
resulting bounding boxes can then be used to improve
the recognition of valid-but-unknown classes.
One limitation of this approach might be the re-
quirement for object classes as apposed to non-object
categories on which an object detector cannot be ap-
plied, particularly it cannot be used for non-vision
machine learning problems.
Our results for fine-grained open set recognition
are in no way meant to be interpreted as final but
should only serve as a baseline for future compar-
isons. They only show the enormous difficulty of the
OSR problem, especially for fine-grained data distri-
butions. More work needs to be done in this direction.
Figure 5: Influence of amount of training data (top) and dif-
ferent image resolutions (bottom) on the OSR performance
for the weakly supervised setting and the CUB split.
Towards Combined Open Set Recognition and Out-of-Distribution Detection for Fine-grained Classification
231

ACKNOWLEDGEMENTS
This work has been supported by the European So-
cial Fund (ESF) and the Ministry of Education, Sci-
ence and Culture of Mecklenburg-Vorpommern, Ger-
many under the project ”DigIT!” (ESF/14-BM-A55-
0015/19).
REFERENCES
Barrowclough, G., Cracraft, J., Klicka, J., and Zink, R.
(2016). How many kinds of birds are there and why
does it matter? PLoS ONE, 11.
Bendale, A. and Boult, T. E. (2016). Towards open set deep
networks. In Proceedings of the IEEE conference on
computer vision and pattern recognition, pages 1563–
1572.
Berg, T. and Belhumeur, P. N. (2013). Poof: Part-based one-
vs.-one features for fine-grained categorization, face
verification, and attribute estimation. In Proceedings
of the IEEE Conference on Computer Vision and Pat-
tern Recognition, pages 955–962.
Chen, X., Lan, X., Sun, F., and Zheng, N. (2020). A bound-
ary based out-of-distribution classifier for generalized
zero-shot learning. In Proceedings of the European
Conference on Computer Vision (ECCV).
Fu, J., Zheng, H., and Mei, T. (2017). Look closer to see
better: Recurrent attention convolutional neural net-
work for fine-grained image recognition. 2017 IEEE
Conference on Computer Vision and Pattern Recogni-
tion (CVPR), pages 4476–4484.
Geifman, Y. and El-Yaniv, R. (2019). Selectivenet: A deep
neural network with an integrated reject option. arXiv
preprint arXiv:1901.09192.
Goodfellow, I. J., Shlens, J., and Szegedy, C. (2014). Ex-
plaining and harnessing adversarial examples. arXiv
preprint arXiv:1412.6572.
Guo, C., Pleiss, G., Sun, Y., and Weinberger, K. Q. (2017).
On calibration of modern neural networks. ArXiv,
abs/1706.04599.
He, K., Zhang, X., Ren, S., and Sun, J. (2016). Deep resid-
ual learning for image recognition. In Proceedings of
the IEEE Conference on Computer Vision and Pattern
Recognition (CVPR).
Hendrycks, D. and Gimpel, K. (2017). A baseline for de-
tecting misclassified and out-of-distribution examples
in neural networks. ICLR, abs/1610.02136.
Hendrycks, D., Mazeika, M., and Dietterich, T. (2018).
Deep anomaly detection with outlier exposure. In In-
ternational Conference on Learning Representations.
Khosla, A., Jayadevaprakash, N., Yao, B., and Fei-Fei, L.
(2011). Novel dataset for fine-grained image catego-
rization. In First Workshop on Fine-Grained Visual
Categorization, IEEE Conference on Computer Vision
and Pattern Recognition, Colorado Springs, CO.
Krause, J., Stark, M., Deng, J., and Fei-Fei, L. (2013). 3d
object representations for fine-grained categorization.
In 4th International IEEE Workshop on 3D Represen-
tation and Recognition (3dRR-13), Sydney, Australia.
Lee, K., Lee, K., Lee, H., and Shin, J. (2018). A simple uni-
fied framework for detecting out-of-distribution sam-
ples and adversarial attacks. In Advances in Neural
Information Processing Systems, pages 7167–7177.
Liang, S., Li, Y., and Srikant, R. (2018). Enhancing the reli-
ability of out-of-distribution image detection in neural
networks. In International Conference on Learning
Representations.
Lin, D., Shen, X., Lu, C., and Jia, J. (2015). Deep lac:
Deep localization, alignment and classification for
fine-grained recognition. In Proceedings of the IEEE
conference on computer vision and pattern recogni-
tion, pages 1666–1674.
Maji, S., Kannala, J., Rahtu, E., Blaschko, M., and Vedaldi,
A. (2013). Fine-grained visual classification of air-
craft. Technical report.
Nguyen, A., Yosinski, J., and Clune, J. (2015). Deep neural
networks are easily fooled: High confidence predic-
tions for unrecognizable images. In Proceedings of
the IEEE conference on computer vision and pattern
recognition, pages 427–436.
Nilsback, M.-E. and Zisserman, A. (2008). Automated
flower classification over a large number of classes.
In Proceedings of the Indian Conference on Computer
Vision, Graphics and Image Processing.
Parkhi, O. M., Vedaldi, A., Zisserman, A., and Jawahar,
C. V. (2012). Cats and dogs. In IEEE Conference
on Computer Vision and Pattern Recognition.
Ren, J., Liu, P. J., Fertig, E., Snoek, J., Poplin, R., De-
Pristo, M. A., Dillon, J. V., and Lakshminarayanan,
B. (2019). Likelihood ratios for out-of-distribution de-
tection. In NeurIPS.
Ren, S., He, K., Girshick, R., and Sun, J. (2015). Faster
r-cnn: Towards real-time object detection with region
proposal networks. In Advances in neural information
processing systems, pages 91–99.
Roady, R., Hayes, T. L., Kemker, R., Gonzales, A., and
Kanan, C. (2019). Are out-of-distribution detection
methods effective on large-scale datasets? arXiv
preprint arXiv:1910.14034.
Russakovsky, O., Deng, J., Su, H., Krause, J., Satheesh,
S., Ma, S., Huang, Z., Karpathy, A., Khosla, A.,
Bernstein, M., Berg, A. C., and Fei-Fei, L. (2015).
ImageNet Large Scale Visual Recognition Challenge.
International Journal of Computer Vision (IJCV),
115(3):211–252.
Van Horn, G., Branson, S., Farrell, R., Haber, S., Barry,
J., Ipeirotis, P., Perona, P., and Belongie, S. (2015).
Building a bird recognition app and large scale dataset
with citizen scientists: The fine print in fine-grained
dataset collection. In Proceedings of the IEEE Con-
ference on Computer Vision and Pattern Recognition
(CVPR).
Van Horn, G., Mac Aodha, O., Song, Y., Cui, Y., Sun, C.,
Shepard, A., Adam, H., Perona, P., and Belongie, S.
(2018). The inaturalist species classification and de-
tection dataset. In The IEEE Conference on Computer
Vision and Pattern Recognition (CVPR).
VISAPP 2021 - 16th International Conference on Computer Vision Theory and Applications
232

Wah, C., Branson, S., Welinder, P., Perona, P., and Be-
longie, S. (2011). The Caltech-UCSD Birds-200-2011
Dataset. Technical Report CNS-TR-2011-001, Cali-
fornia Institute of Technology.
Welinder, P., Branson, S., Mita, T., Wah, C., Schroff, F.,
Belongie, S., and Perona, P. (2010). Caltech-UCSD
Birds 200. Technical Report CNS-TR-2010-001, Cal-
ifornia Institute of Technology.
Wu, Y., Kirillov, A., Massa, F., Lo, W.-Y., and Gir-
shick, R. (2019). Detectron2. https://github.com/
facebookresearch/detectron2.
Xian, Y., Lampert, C. H., Schiele, B., and Akata, Z.
(2018). Zero-shot learning — a comprehensive eval-
uation of the good, the bad and the ugly. IEEE trans-
actions on pattern analysis and machine intelligence,
41(9):2251–2265.
Zhang, N., Donahue, J., Girshick, R., and Darrell, T. (2014).
Part-based r-cnns for fine-grained category detection.
In European conference on computer vision, pages
834–849. Springer.
Zhou, B., Khosla, A., Lapedriza, A., Oliva, A., and Tor-
ralba, A. (2016). Learning deep features for discrim-
inative localization. In Proceedings of the IEEE con-
ference on computer vision and pattern recognition,
pages 2921–2929.
Zipf, G. K. (1932). Selected studies of the principle of rela-
tive frequency in language. Harvard university press.
Towards Combined Open Set Recognition and Out-of-Distribution Detection for Fine-grained Classification
233
