The Determinants of Social Media Engagement for
Fashion Industry in Oman: A Descriptive Analysis
Fatma Salim Al Rabaani and Aiman Moyaid Said
Department of Information Systems, University of Nizwa, Nizwa, Oman
Keywords: Digital Marketing, Customer Engagement, Instagram, Descriptive Analysis, K-means Cluster.
Abstract: The use of social media has completely remodelled the way people interact, communicate, and engage. Social
media platforms play an essential role in reshaping the relationship between customers and companies.
Present companies establish their accounts in social media to reach and engage with their customers, listen
and take their opinion, enhance the purchase decision, and increase the revenue. The main goal of this study
is to determine the factors that affect customer engagement. From 296 Instagram business accounts with
530,366 posts published, the dataset was scraped and used to understand what impacts customer engagement.
Different descriptive analysis techniques were adopted to answer the questions of the study. Among the key
finding of this study, customer engagement is positively affected by the number of comments and shares. The
number of likes of published posts is not influenced. Moreover, video posts attract more customer interaction
than other types of posts. Uncovered the property of three kinds of customer engagement (low, moderately,
and high active).
1 INTRODUCTION
With the widespread of social media platforms,
marketrs change their approach to communication
with their current/potential customers. Social media
marketing is considered an effective and fastest
communication method to attract a large scale of
customers to pay attention to the advertisement and
pursue their purchasing decisions.
Social media is defined as a platform that permits
individuals to design content, engage, or disseminate
information, career interest, and pictures/videos
through workable communication and networks
(Sudarsanam, 2017). According to (Dolan et al.,
2015), social media has empowered customers,
flexibility, and visibility regarding marketing content
that differentiates the interconnect between customer
and organization. It transformed the customers from
passive recipients of marketing content to active
collaboration in the brand message.
Social media platforms such as Facebook,
Twitter, YouTube, and Instagram provide a dialogue
between companies and customers. Instagram, one of
the social media platforms, allows users to publish
text, images, and videos on their account page to
interact with their followers /visitors. (Marketo,
2019) reported that 44% of active internet users use
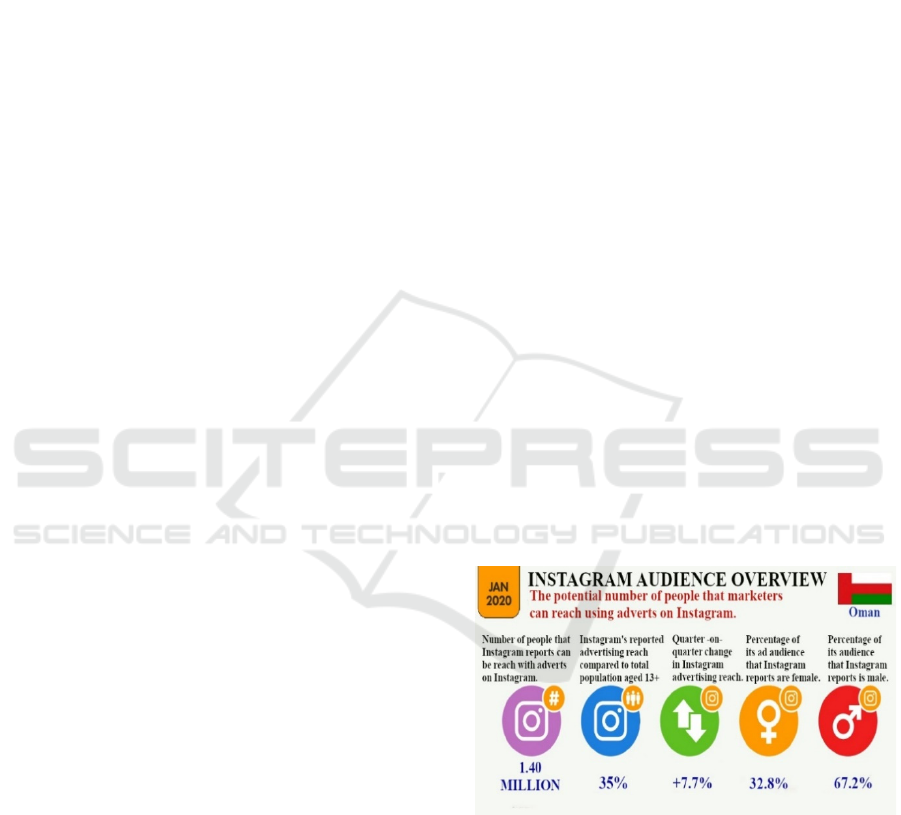
Instagram to research products. In Oman, 35% of the
population can be reached by advertisements, as
illustrated in Figure 1.
Figure 1: User of Instagram on Oman.
https://datareportal.com/reports/digital-2020-oman.
Small businesses and retailers use Instagram as a
tool to promote and sell their products and services.
Using Instagram in marketing gives both the
customers and advertisers the ability to communicate
with each other. The customers can express their
opinion about the advertising content or ask a
question about it. The advertiser could answer the
Al Rabaani, F. and Said, A.
The Determinants of Social Media Engagement for Fashion Industry in Oman: A Descriptive Analysis.
DOI: 10.5220/0010336511511159
In Proceedings of the 13th International Conference on Agents and Artificial Intelligence (ICAART 2021) - Volume 2, pages 1151-1159
ISBN: 978-989-758-484-8
Copyright
c
2021 by SCITEPRESS – Science and Technology Publications, Lda. All rights reserved
1151

question and make an idea about how he could
improve the advertising.
According to (Jordan, 2018), many small
businesses and retailers need to understand how to
deliver the advertisement to their customers. One of the
most significant confrontations they faced is building
an effective social media strategy to improve customer
engagement on their social media web page. Most
companies spend a lot of money on social media
marketing campaigns. According to (Laudon &
Traver, 2014), companies use online marketing
campaigns, which require many efforts and cost a huge
budget, to advertise and attract customers to their
products and services without an increase in revenue.
The challenge is how to accomplish social media
marketing’s advantage to improve the relationship
with customers and enhance revenue. Small businesses
and retailers must spotlight a successful marketing
campaign’s characteristic to achieve a high level of
customer engagement. Understanding the factors that
affect customer engagement on social media leads to
an increase in brand community engagement on social
media. It will modulate the customer’s attitudes toward
the brand and increase company revenue.
According to (Shehu, 2018), with the massive
posts published on social media platforms, businesses
must collect, analyze, and act on customer data
created on social media platforms. It provides an
insight to attain competitive advantage and enclose
brand relationships, product contentment, and service
delivery. The aggregation of likes, comments, shares,
and followers get actionable knowledge that small or
medium companies can use to enhance their products
and services and improve their content and delivery.
Data mining techniques supply a motivating
approach for extracting knowledge from raw data. K-
means clustering algorithm is one of the data mining
models used to classify the data set to clusters based
on the distance between the features of the data. It is
an unsupervised machine learning technique that
groups the data into subsets or clusters. Inside the
same cluster, the data is very similar, while outside
the cluster, the data is dissimilar. In this research,
using K-means cluster to define the different groups
of customer engagement in the fashion industry by
utilizing the features of the data collection like:’ type
of posts published, number of likes, number of
comments, number of shares, and other features’ to
identify the kind of customer interaction.
Determining the different types of customer
engagement helps the companies’ decision-makers
enhance engagement when delivering the marketing
campaign on social media.
This research focused on how the Fashion
Industry could use Instagram’s business account to
promote and market their products effectively. The
objective of this research is to answer the following
questions:
• Which type of posts attracts more interaction,
and at what time of year, these posts get more
interaction?
• Is there any difference in interaction on the posts
type according to years?
• What are the most influential features of the
customers’ engagement?
• What are the prevailing characteristics of the
existing social media accounts in the fashion
industry?
The next section illustrates the overview of the
literature review conducted in this area. The 3rd section
describes the method used, the dataset, and selected
features for the study. The 4th section answers the
objective questions by explaining the results obtained
after analyzing the study’s dataset. The last section
presents the main conclusions of this study.
2 LITERATURE REVIEW
Customer engagement on social media is one of the
marketing objectives that enhance return on
investment. Understand customer engagement and
how it could measure it is one of the challenges that
marketers seek to determine. Many kinds of literature
were conducted to define customer engagement and
provide a variety of concepts. Table 1 summarizes the
definition of customer engagement in literature.
Motivating users to engage in social media
platforms is an important challenge for researchers to
gain insight into consumer engagement. (Khan, 2017)
said comment behavior is a strong predictor to motive
YouTube followers to engage with the video. When
the follower writes a comment, that means he/she is
interested in the content and adds a comment about
what feels about the content. Like, dislike, comment,
and upload reflect the motivation of engagement with
the content published. The same result was founded
by (BİLGİLİER, 2020). The researcher mentioned
the importance of comments written on Instagram to
improve the relationship between the customers and
the company and increase customer engagement. The
type of post published has a significant impact on
lifetime post consumers.
ICAART 2021 - 13th International Conference on Agents and Artificial Intelligence
1152
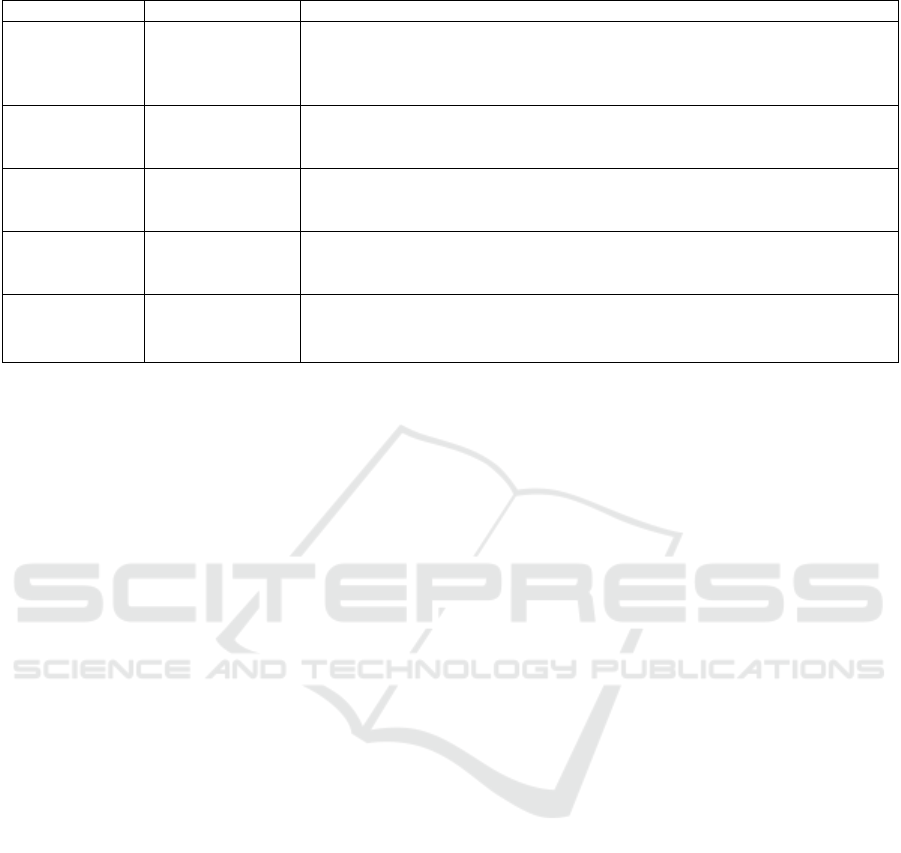
Table 1: Customer engagement related concept.
Autho
r
Conce
p
t Definition
Perreault &
Mosconi (2018)
Brand and
consumers’
engagement
Customers engage in several behaviors that strengthen their relationship with the
brand, which go beyond the traditional customer loyalty measures such as,
frequency of visits, purchasing behavior, and intended actions [such as, sharing,
commenting, and liking the brand page].
Volkmann et
al.(2019)
User-generated
content
Many consumers voluntarily publish on the internet and express their
experiences, opinions, feelings, and perceptions online on the social network, in
fora, blogs, or product review channels.
Kuntara et
al.(2019)
User engagement
in social
commerce
Factors affecting user participation include trust, information quality, attitude,
community involvement, perceived usefulness, and social support.
Oliveira &
Goussevskaia
(
2020
)
User engagement The function of the number of interactions (likes and comments) with the post,
and the number of followers of the poster
Vadivu &
Neelamalar
(2015)
Customer
engagement
Sequential psychological process in which customers move through to become
loyal towards a brand. In online customer engagement in social media platforms,
it is characterized by customer interactivity with the brand.
This result was founded by (Huey & Yazdanifard,
2015) and (Janani & Prabhalammbeka, 2017). They
found “Status” posts get the highest number of
comments, “video” posts get the most likes, and
“Photos” and “links” get the lowest number of
interactions on customer engagement. Besides, they
found the seasonality “month of published posts” has
a significant impact on user engagement with the
posts published. The type of content published,
“persuasive, or informative,” has a substantial impact
on customer engagement “like and comment”. (Lee et
al., 2018) said that persuasive content has a positive
effect on customer engagement while informative
content reduces the engagement.
Several previous researchers have done the
metrics that used to calculate and evaluate the
engagement on social media. The formula used to
measure the engagement varies between the
researches, but all the researchers adopted the number
of comments, likes, posts, and followers as the most
important metrics. (Vrana et al., 2019) adopted
number of followers, number of following, and
number of likes as metrics to determine customers’
engagement. The more followers an account has, the
more impact the account has. (Barnes & Rutter, 2019;
Muhammad et al., 2018; Segev et al., 2018) also used
the same metrics in their researches. (
Yew et al., 2018)
suggested a new measurement to evaluate the
engagement. They used the average number of likes,
the average number of comments, and the average
number of views for the video posts and out of the
total number of posts in the last three months divided
by the average of reach achieved in the last three
months. (Arman
& Sidik, 2019) suggest new formula
to calculate the engagement because they viewed that
number of comments, likes, and followers as crucial
metrics to determine the engagement and the number
of posts in the page account and the probability for
followers to see the posts. They considered that not
all the likes and comments that post has come from
the business page’s followers. It also may become
from the visitors of the business page. (Mariani et al.,
2017) add the number of shares in their formula to
calculate the engagement. They calculate the number
of likes, comments, and shares for the post and
divided by total posts, then multiplied by 100 to get
the engagement rate. They consider that most of the
business page’s followers or visitors could click like
to the post, some of them write a comment, and who
is interested in the post will share it with others.
Some studies focused on customer engagement
and used different data mining techniques and
algorithms to understand what motivates them to
engage in social media. (Segev et al., 2018) using
regression models (Ridge Regression and Random
Forest), they found that Multi-Regression was not a
beneficial method while feature reduction resulted in
powerful models. (Oliveira & Goussevskaia, 2020)
adopted a classification model (Extremely
Randomized Tree algorithm) to classify the features
that affect customer engagement on Instagram, also
used (Area Under the ROC Curve ‘AUC’) to evaluate
the model. They found that the average text size is the
most notable feature. (Arman
& Sidik, 2019) referred
that used data mining approach, but the authors don’t
describe any algorithm that adopted. They used
correlation analysis and arithmetic mean to analyze
the engagement. (Lee et al., 2018) build NLP
algorithm to understand customer engagement on
FaceBook and adopted (accuracy, recall, precision) to
evaluate the algorithm. This algorithm achieves 99%
accuracy. Besides, adopting a descriptive analysis.
The Determinants of Social Media Engagement for Fashion Industry in Oman: A Descriptive Analysis
1153

(Muhammad et al., 2018) implemented a K-means
algorithm to classify the posts published on Instagram
and used five variables (day, hours, likes, comments,
and location name). The result indicated that the data
set was classified into three different clusters. Also,
they used descriptive analysis to visualize customer
engagement. (Barnes & Rutter, 2020) discussed some
big data and artificial intelligence techniques (V3
convolutional neural network) to describe customer
engagement on social media Influencer posts. They
found that general influencer gains the best
performance while traveling influencers
accomplished greater overall engagement and
implementing some data visualization.
According to (Anitha & Patil, 2019), k-means
clustering is a data mining technique applied to
discover the different customer predilection patterns
in the fashion industry. (
Ližbetinová et al., 2019)
Understanding the data set feature by adopting
descriptive analysis is essential before applying the
clustering. Clustering is a technique to different
entities into a subset of groups. The entities inside the
same group or cluster share the same properties. K-
means algorithm is a popular classification algorithm
(Gurusamy et al., 2017).
3 METHODOLOGY
This research investigates and analyses the Instagram
account page of small businesses and retails from
Oman’s fashion industry.
3.1 Dataset Collection
To identify the main Omani fashion industry business
account on Instagram, WhatsApp Groups was created
to ask regular purchasers from online customers to
suggest three different accounts from the fashion
industry that follow and purchase from them. These
accounts must be Omani ones. In addition to that, the
researchers relied on suggestions of accounts done by
the Instagram platform. As a result of identifying the
fashion industry accounts, 305 were selected. After
checking all the accounts’ status, the researchers
decided to reject some of the accounts because they
were inactive, making the final number of accounts
296. The total number of the collected posts was
530,366 from all the 296 Instagram business accounts
published in a period above seven years from
11/12/2012 until 10/7/2020.
3.2 Dataset Features
The data set’s input features have been collected
from both the business account profile and the posts
published in the account. It is categorized into two
types directly taken from the business account page
or computed from other features. Table 2. explains
all the selected features used for this research with
its description.
3.3 Calculation of Customer
Engagement
The measure used to evaluate customer engagement
was adopted from (Mariani et al., 2017). The reason
for using this formula is because not all the likes,
comments, shares that the post gets come from the
follower of the business account. It may become from
any visitor to the account, as mentioned in (Mariani
et al., 2017) and (Arora
et al., 2019). Equation 1
illustrates the adopted formula in this study.
ER
Ƥ
=
𝓛
𝓒𝓢
𝓟
100
(1)
Where “ℒ” denotes the number of likes post, “𝒞”
indicates the number of comments, “𝒮” indicates the
number of shares, “𝒫” indicates the number of total
posts in the account, and “ERƤ” denotes Engagement
Rate for each post.
The study is a descriptive analysis. To answer
research questions, the researchers are going to use
statistical measurement and different visualization
techniques. In addition, the data analysis in this
research is adopting K-means to define the prevailing
characteristics of the existing social media accounts.
4 ANALYSIS AND RESULTS
To acquire a general understanding of how Instagram,
brand page accounts are applied to enhance marketing
engagement customers, first investigate the
descriptive statistic for the selected factor variables of
profile feature account. Table 3 provides the
descriptive statistic value for the features.
Regarding the posts published type, graph Image
is most frequently (401731 occurrences, 75.75% of
total), followed by graph side care (96337
occurrences, 18.16%), graph video has the lowest
frequency (32298 occurrences, 6.09% of total). In
aggregated posts published over the seven years,
more than 50000 posts were published in (May, June,
March), and less than 40000 posts were published in
(August, September). The result indicates the trade of
ICAART 2021 - 13th International Conference on Agents and Artificial Intelligence
1154

fashion industry in Oman is booming in May due to
upcoming the season of end of the school year, and
Summer holidays, besides, the trade of fashion
industry decreases in August and September as the
interest of consumers shifts to prepare for the start of
the School year. Figure 2. shows the aggregation of
posts published over the seven years in the month.
280160 posts from all the posts published did not
have any comments or shares. When focusing more
on these posts, why didn’t the posts get any comments
or shares? Finding 12443 posts on the account page,
Instagram users disabled the followers or visitors to
add a comment for these posts, while 267717 did not
interest the followers or visitors to add comments or
share it, even if these posts get several likes.
Table 2: Dataset features.
Feature Type of feature Description
Follower count Directly taken Number of followers who follow the page of the business account.
Following count Directly taken Number of following that the user of account following them.
Posts count Directly taken Total number of posts published that in the business account page.
Post type Directly taken Type of post published (three types of posts published Graph Image, Graph Side care,
and Graph Video)
Video view count Directly taken Total number of views that the video post got.
No of likes Directly taken Total number of likes that the post got.
No of comments Directly taken Total number of comments that post gain it.
No of shares Computed Total number of shares that the post gain it.
Comment disabled Directly taken The boolean type determines of the user disabled the Comment for the followers who
saw the post or not.
Last comment date Computed Date Time type, last date that the posts got Comment.
Time publishing Directly taken At the time that the post published
day Computed Day of the post published (get from Time publishing)
month Computed The month the post published (get from Time publishing)
year Computed The year of post published (get from Time publishing)
Ave_ like Computed The average number of all number of likes that the account got from all posts in the
account.
Ave_ comment Computed Average number of all the number of comments that the account got from all posts
in the account.
Ave_ Share Computed Average number of all number of shares that the account got from all posts in the
account.
Is a business
account
Directly taken Determine if the user of the account makes his/her account business account or not.
This feature provided by Instagram for any account can use this feature and then get
analysis details for the account.
Is private Directly taken Some user makes their profile private, then allowed for who want to follow them or
not.
Table 3: Statistic value of profile feature account.
Posts
count
Video
view
count
No of
likes
No of
share
No
of
Comment
Ave_
video
view
Ave_
like
Ave_
share
Ave_
comments
Followers
count
ER
Count 530,366 322,98 530,366 530,366 530,366 270 296 296 296 296 530,366
Mean 15,140 1,985 62 3 6 2,84 101 15 27 52,62 8
Std 20,090 6,384 324 285 377 11,41 226 175 284 67,56 1,12
Min 18 0 0 0 0 0 1 0 0 175 0
25% 2,123 143 5 0 0 451 17 0 2 10,63 0
50% 6,769 549 13 0 0 1,17 40 1 4 29,68 0
75% 16,009 1,747 38 1 3 2,24 102 3 11 716,9 2
Max 633,02 334,404 30,792 147,07 237,92 169,65 2,96 3,01 4,88 734,53 816,01
The Determinants of Social Media Engagement for Fashion Industry in Oman: A Descriptive Analysis
1155
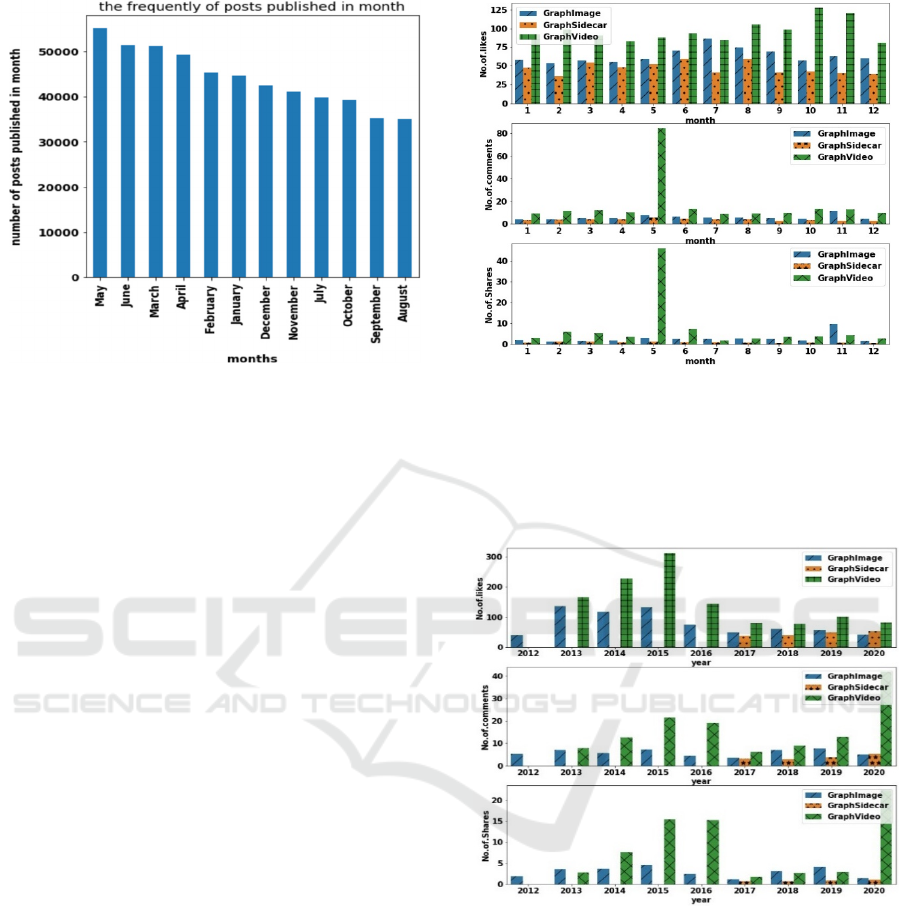
Figure 2: Aggregation of posts published over the 7 years
in the month.
The Comments and Shares take time for the
followers to add, and if the post attracts the follower’s
interest, the follower will add a comment. The result
supports the previous literature in important
comments to make relationships with customers and
improve the interaction between the customers and
the company (Vadivu
& Neelamalar, 2015).
• Which type of posts attracts more interaction,
and at what time of year, these posts get more
interaction?
The posts type “Graph Video” receives the
highest average rate of likes, comments, and shares
overall the months in the year except in November,
the post type “Graph Image” gets the highest average
rate of shares. “Graph Video” gets the highest average
rate of likes in October and November this is because
upcoming of the season end of year discounts and the
National Day, while “Graph Image” gets the highest
average rate of likes in July and August, and “Graph
Sidecar” gets the highest average rate of likes in June
and August. “Graph Video” receives the highest
average rate of comments and shares in May, while
“Graph Image” gets the highest average rate of
comments and shares in November, and “Graph
Sidecar” gets the highest average rate of comments
and shares in May. Posts type “Graph Video” has the
best interaction. Figure 3. illustrates the difference
between the interaction type of posts in the month.
• Is there any difference in interaction on the posts
type according to years?
The posts type “Graph Sidecar” starts appearing
in 2017 and has average increase interaction (likes,
comments, and shares) over the years. “Graph Image”
has an oscillatory performance of interaction over the
years. “Graph video” gets the highest average rate of
Figure 3: The different of the interaction posts type in
month.
likes in 2015 while getting the highest average rate of
comments and shares in 2020. Figure 4. illustrates the
difference between the interaction types of posts in
years.
Figure 4: The different of the interaction posts type in year.
• What are the most influential features on the
customers’ engagement?
Table 4. demonstrates the correlation coefficient
between the Features for every post published, there
is a significant positive correlation between the
engagement rate and the No of Comments and No of
Shares, 0.879, 0.726, respectively. This result means
that the marketer must focus to the comments and
shares to understand what the customers need and
interest. The relationship between number of
comments and number of shares is very high
positively, 0.929 the comments and shares very
ICAART 2021 - 13th International Conference on Agents and Artificial Intelligence
1156
related to each other. This means if the follower or
visitor writes a comment for the post published the
probability to share this post with others is very high.
No relationship between Posts Count and No of
Likes, No of Comments, No of Shares, and
Engagement Rate. The result suggests that it is not
important to publish more posts to get follower’s and
visitor’s interaction.
Table 4: The correlation coefficient between the Features
for every post published.
posts
count
No of
likes
No of
Commen
t
No of
Share
E R
posts
count
1.000 -0.099 -0.009 -0.006 -0.01
No of likes
-0.099 1.000 0.121 0.105 0.09
No of
comment
-0.009 0.121 1.000 0.929 0.88
No of
Share
-0.006 0.105 0.929 1.000 0.73
Engageme
nt Rate
-0.005 0.085 0.879 0.726 1.00
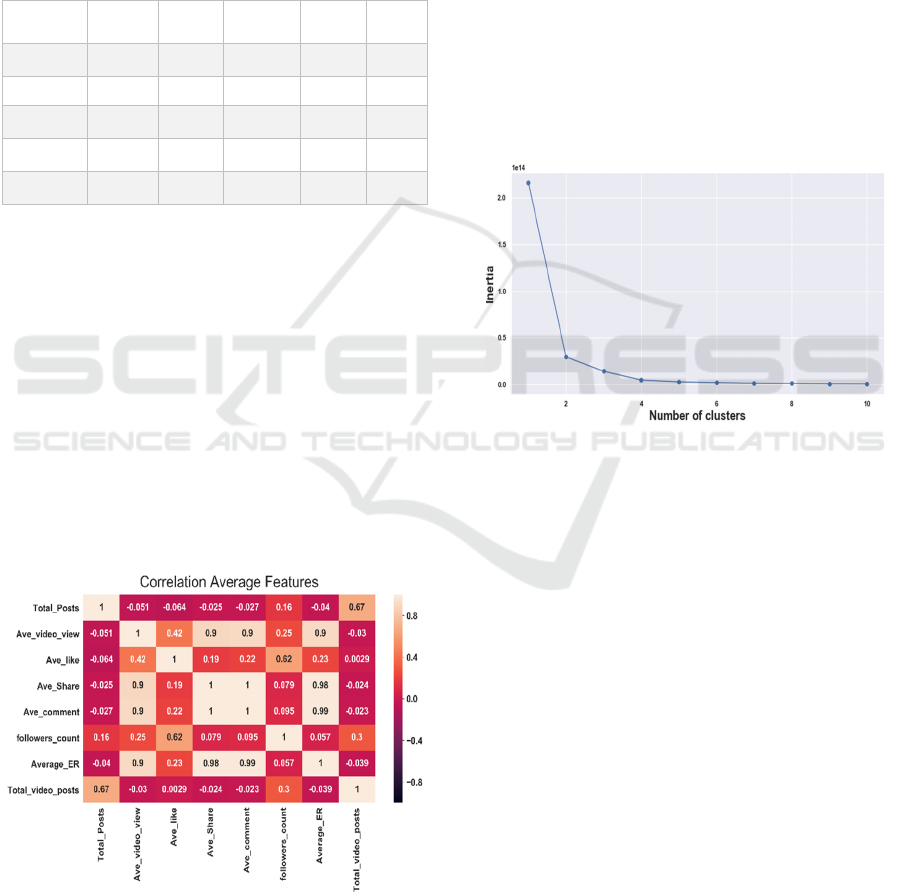
Figure 5. shows the correlation between the
features of average business accounts, there is a
significant positive corelation between Total posts
and Total video posts, 0.67. The Average video view
affects high positively the Average Likes, Comments
and Engagement Rate (0.90) and medium positively
to the average likes (0.42). Followers count affects
high positively to the average likes (0.62). The
Average likes have low positively affected the
Average Comments, Engagement Rate, and Shares,
0.22, 0.23, 0.19, respectively. Average Comment has
a very high positive relationship with the Average
Engagement Rate and Shares, 0.99, 1, respectively.
Average Shares has a very high positive relationship
with the Average Engagement Rate, 0.98.
Figure 5: The correlation between features of average
business accounts.
• What are the prevailing characteristics of the
existing social media accounts in the fashion
industry?
The Elbow curve method helps estimate the
number of prevailing characteristics of the existing
social media accounts in the fashion industry. It is
used to determine the maximum and a minimum
number of clusters in the dataset. This method applied
several K-mean clusters by increasing the number of
K (number of clusters in the dataset) every iteration
and recorded the sum of square error (SSE). The
goodness of cluster function is estimated by
computing the SSE after the centroids coverage. The
SSE is realized as the sum of squared Euclidean of
each point to its adjacent centroid. The lowest value
of SSE is the best for the number of clusters. As a
result, there are two to four different clusters in the
dataset, as figure
6 shows.
Figure 6: Maximum and minimum number of clusters.
Based on clustering analysis adopting K-means
Algorithm (Muhammad et al., 2018), posts published
in business account in Oman’s fashion industry are
divided into three groups. The first cluster has 527921
posts. The second cluster has 62 posts, while in the
third cluster there are 2380 posts. Table 5. describes
the most important features that describe and
categorize the interaction that posts get (Posts type,
Video view count, No of likes, No of shares, No of
comments, day, month, year, and Engagement rate).
For instance, Clusters # 1 shows posts with low
interaction the midpoints of features (posts type of
Graph Image, 55.3 Video view count, 59.6 Likes, 2.2
Shares, 5.3 Comments, the day of Wednesday in June
2017, and 6.1 Engagement Rate). Cluster # 2 shows
posts with high interaction; the midpoints of features
are (posts type Graph Video, 108880.9 Video view
count, 6087.3 likes, 26.9 Shares, 207.3 Comments,
the day of Thursday in May 2018, and 466.9
Engagement Rate). Cluster#3 shows posts with
moderate interaction; the midpoints of features are
(posts type of Graph Video, 11769.6 Video view
The Determinants of Social Media Engagement for Fashion Industry in Oman: A Descriptive Analysis
1157

Table 5: The K-means Features midpoints clusters.
Posts
type
Video view
count
No of
likes
No of
shares
No of
comments
day month Year E_R Interaction type
Cluster0 0.295587 55.32 59.61 2.25 5.37 2.96 6.23 2017.99 6.12 low interaction
cluster1 2 108880.92 6087.32 26.90 207.32 3.65 5.92 2018.76 466.98 high interaction
cluster2 2 11769.66 456.49 24.00 70.61 2.98 5.91 2018.86 60.97
moderate
interaction
count 456.5 likes, 23.9 Shares, 70.6 Comments, the
day of Wednesday, in May 2018, and 60.9
Engagement Rate). Table 5 shows the clusters’
Feature midpoints.
5 CONCLUSION
The current research aims to analyze and investigate
Instagram’s customer engagement in the fashion
industry and who could use Instagram as a marketing
tool. 296 Instagram users account with 530366 posts
published on their Instagram page account was used
in this research. The analysis comes with the
significant result that:
• comments and shares are critical factors that
affect the customer’s engagement on Instagram
fashion industry accounts.
• The interest in publishing more posts does not
lead to attract more customer engagement.
• Most of the posts published get low-
performance interaction. This result shows that the
users of business account pay more attention to
publishing posts than listening to what people say
about their products.
• The post type “Graph Video” attracts more
interaction than the other types of posts.
• When marketers want to establish a marketing
campaign on Instagram, they should adopt the type
post “Graph Video” to receive more followers and
visitors’ interaction.
• When the fashion industry marketers want to
establish a marketing campaign and attract more
interactions and opinions about the products from the
followers or attract new followers to their account, the
best month to develop this campaign in May,
October, or November.
REFERENCES
Anitha, P., & Patil, M. M. (2019).
RFM model for customer purchase behavior using K-
Means algorithm. Journal of King Saud University -
Computer and Information Sciences, 1–8.
https://doi.org/10.1016/j.jksuci.2019.12.011
Arman, A. A., & Sidik, A. P. (2019). Measurement of
Engagement Rate in Instagram (Case Study:
Instagram Indonesian Government Ministry and
Institutions). 2019 International Conference
on ICT for Smart Society (ICISS).
doi:10.1109/iciss48059.2019.8969826
Arora, A., Bansal, S., Kandpal, C., Aswani, R., & Dwivedi,
Y. (2019). Measuring social media influencer index-
insights from facebook, Twitter and Instagram. Journal
of Retailing and Consumer Services, 49, 86-101.
doi:10.1016/j.jretconser.2019.03.012
Barnes, S., & Rutter, R. (2019). Using Big Data and AI to
Examine Product Engagement in Social Media
Influencer Posts. 2019 4th International Conference on
Information Technology, Information Systems
and Electrical Engineering (ICITISEE).
doi:10.1109/icitisee48480.2019.9003991
BİLGİLİER, H. S. (2020, January 29). (PDF)
Instagram in the Context of Dialogic
Communication ... Retrieved February 24, 2020, from
https://www.researchgate.net/publication/341741528_
Instagram_in_the_Context_of_Dialogic_Communicati
on_A_Content_Analysis_for_Top_Performing_Brand
s_on_Instagram.
Dolan, R., Conduit, J., Fahy, J. and Goodman, S., 2015.
Social media engagement behaviour: a uses and
gratifications perspective. Journal of Strategic
Marketing, 24(3-4), pp.261-277.
Gurusamy, V., Kannan, S., & Prabhu, J. R. (2017). Mining
the Attitude of Social Network Users using K-means
Clustering. International Journal of Advanced Research
in Computer Science and Software Engineering, 7(5),
226-230. doi:10.23956/ijarcsse/sv7i5/0231
Huey, L. S., & Yazdanifard, D. (2015). How Instagram Can
Be Used as a Tool in Social Network Marketing.
Social Networking Marketing. Retrieved from
https://www.researchgate.net/publication/265377226.
Janani, P., & Prabhalammbeka, B S. (2017). PREDICTING
THE INFLUENCES OF SOCIAL NETWORKS ON
BRAND BUILDING. International Journal of
Mechanical Engineering and Technology, 8(10), 0976-
6359, 308-317. Retrieved October, 2017.
Jordan, R. S. (2018). Social Media Marketing Strategies
Used by Small Retail Businesses (Master’s thesis,
Walden University, October 2018) (pp. I-110). East
Eisenhower Parkway: ProQuest LLC.
Khan, M. L. (2017). Social media engagement: What
motivates user participation and consumption on
ICAART 2021 - 13th International Conference on Agents and Artificial Intelligence
1158

YouTube? Computers in Human Behavior, 66, 236-
247. doi:10.1016/j.chb.2016.09.024
Kuntara, I., Purwandari, B., Purwaningsih, M., &
Kumaralalita, L. (2019). Factors Influencing Consumer
Engagement on Instagram: A Perspective of Bereal.id.
2019 Fourth International Conference on
Informatics and Computing (ICIC).
doi:10.1109/icic47613.2019.8985730
Laudon, K. C., & Traver, C. G. (2014). E-commerce:
Business, technology, society (Tenth Edition ed.).
Harlow, England: Pearson.
Lee, D., Hosanagar, K., & Nair, H. (2018). Advertising
Content and Consumer Engagement on Social Media:
Evidence from Facebook. SSRN Electronic Journal.
doi:10.2139/ssrn.2290802.
Ližbetinová, L., Štarchoň, P., Lorincová, S., Weberová, D.,
& Průša, P. (2019). Application of Cluster Analysis in
Marketing Communications in Small and Medium-
Sized Enterprises: An Empirical Study in the
Slovak Republic. Sustainability, 11(8), 2302.
https://doi.org/10.3390/su11082302.
Mariani, M. M., Mura, M., & Di Felice, M. (2017). The
determinants of Facebook social engagement for
national tourism organizations’ Facebook pages: A
quantitative approach. Journal of Destination
Marketing & Management, 8, 312–325.
https://doi.org/10.1016/j.jdmm.2017.06.003
Marketo. (2019). The definitive guide to social media
marketing (pp. 1-83, Publication). Adobe.
Muhammad, H., Wahiduddin, F., Budi, N. F., & Hidayanto,
A. N. (2018). An Integrated Framework to Investigate
Influencing Factors of Users Engagements on
Instagram Contents. 2018 Third International
Conference on Informatics and Computing (ICIC).
doi:10.1109/iac.2018.8780511
Oliveira, L. M., & Goussevskaia, O. (2020). Sponsored
content and user engagement dynamics on Instagram.
Proceedings of the 35th Annual ACM Symposium on
Applied Computing. doi:10.1145/3341105.3373956
Perreault, M., & Mosconi, E. (2018). Social Media
Engagement: Content Strategy and Metrics Research
Opportunities. Proceedings of the 51st Hawaii
International Conference on System Sciences, 3668-
3577. doi:10.24251/hicss.2018.451
Segev, N., Avigdor, N., & Avigdor, E. (2018). Measuring
Influence on Instagram. The 41st International ACM
SIGIR Conference on Research & Development
in Information Retrieval, 1009-1012.
doi:10.1145/3209978.3210134
Shehu, M. (2018). Formalizing social media marketing
strategies. Proceedings of the Second African
Conference for Human Computer Interaction on
Thriving Communities - AfriCHI 18, 145-149.
doi:10.1145/3283458.3283485
Sudarsanam, S. K. (2017). Social Media Metrics. Social
Media Listening and Monitoring for Business
Applications Advances in E-Business Research, 131-
149. doi:10.4018/978-1-5225-0846-5.ch007
Vadivu, V. M., & Neelamalar, M. (2015). Digital brand
management — A study on the factors affecting
customers engagement in Facebook pages. 2015
International Conference on Smart Technologies and
Management for Computing, Communication,
Controls, Energy and Materials (ICSTM).
doi:10.1109/icstm.2015.7225392
Volkmann, G., Egger, M., & Schoder, D. (8-14/6/2019).
TOWARDS MINING BRAND ASSOCIATIONS
FROM USER-GENERATED CONTENT (UGC):
EVIDENCE FROM LINGUISTIC
CHARACTERISTICS. European Conference on
Information Systems. Retrieved from
https://aisel.aisnet.org/ecis2019_rp/82.
Vrana, V. G., Kydros, D. A., Kehris, E. C., Theocharidis,
A. T., & Kavavasilis, G. I. (2019). Top Museums on
Instagram. International Journal of Computational
Methods in Heritage Science, 3(2), 18-42.
doi:10.4018/ijcmhs.2019070102
Yew, R. L., Suhaidi, S. B., Seewoochurn, P., & Sevamalai,
V. K. (2018). Social Network Influencers’ Engagement
Rate Algorithm Using Instagram Data. 2018 Fourth
International Conference on Advances in Computing,
Communication & Automation (ICACCA).
doi:10.1109/icaccaf.2018.8776755.
The Determinants of Social Media Engagement for Fashion Industry in Oman: A Descriptive Analysis
1159
