
Identifying Depression Clues using Emotions and AI
Ricardo Martins
a
, Jos
´
e Jo
˜
ao Almeida
b
, Pedro Henriques
c
and Paulo Novais
d
Department of Informatics, Algoritmi Centre, University of Minho, Braga, Portugal
Keywords:
Sentiment Analysis, Natural Language Processing, Machine Learning.
Abstract:
According to the World Health Organization (WHO), close to 300 million people of all ages suffer from de-
pression. Also, for WHO, depression is the leading reason for disability worldwide and is a major contributor
to the global burden of disease. Different than the mood fluctuation raised by the common life’s activities,
depression can be a serious health problem, particularly when it is a long-term and mid/high intensity. Luck-
ily, despite depression is a silent disease, people when suffering leaves some clues. Due to the massive use
of social media, these clues can be collected through the texts posted on social media, such as Twitter, Face-
book, Instagram, and later, analysed to identify if the writing style matches with a depressive pattern. This
paper presents an approach that can be applied by Machine Learning models to help psychologists to identify
depressive clues in texts. The model examines profiles on Twitter based on clues provided by users in their
posts. Combining Sentiment Analysis, Machine Learning and Natural Language Processing techniques, we
achieved a precision of 98% by Machine Learning models when identifying Twitter profiles that post potential
depressive texts.
1 INTRODUCTION
In our social relationships, the chance of knowing
someone who is suffering or suffered from depres-
sive disorders is high. According to United Nations
(UN), the worldwide population is about 7.6 billion
1
habitants, when compared to 300 million
2
of depres-
sive people according to WHO (Organization et al.,
2017), draws attention to the fact that every 25 people
in the world, 1 suffers from depression. Yet according
to WHO, “depressive disorders are characterized by
sadness, loss of interest or pleasure, feelings of guilt
or low self-worth, disturbed sleep or appetite, feelings
of tiredness, and poor concentration. Depression can
be longlasting or recurrent, substantially impairing an
individual’s ability to function at work or school or
cope with daily life. At its most severe, depression
can lead to suicide.”
Having the words of Schafer (Schafer, 2011) in
a
https://orcid.org/0000-0003-1993-5343
b
https://orcid.org/0000-0002-0722-2031
c
https://orcid.org/0000-0002-3208-0207
d
https://orcid.org/0000-0002-3549-0754
1
https://news.un.org/pt/story/2017/06/1589091-populacao-
mundial-atingiu-76-bilhoes-de-habitantes
2
https://www.who.int/news-room/fact-sheets/detail/
depression
mind (“if the eyes are the window to the soul, then
words are the gateway to the mind”), the symptoms
associated with depressive disorders are evident in
texts produced by depressive people. So, Twitter,
Facebook and web forums are an excellent source of
information to collect clues about the messages au-
thors’ mental wellness. Automated analysis of social
media can provide detection methods, and, once iden-
tified an individual as depressive, an assessment, sup-
port and treatment can be provided sooner.
In this paper, we present an approach based on
Machine Learning, Sentiment Analysis and Natural
Language Processing to identify depressive profiles
on Twitter, based on the messages posted. It is not
our intention to identify different levels of depres-
sion which authors can have. To reach this objective,
we adopted the emotion model defined by Plutchik
(Plutchik, 1984), because we consider more realis-
tic due to it differentiate the emotions in more cat-
egories than Ekman (Ekman, 1992), despite easy to
use and able to represent different emotions through
dyads emotion.
The remainder of this paper is as follows: Section
2 presents some recent research works on depression
identification and points out the most relevant differ-
ences holding among them and our proposal. Sec-
tion 3 introduces the concept of emotional profile, and
Martins, R., Almeida, J., Henriques, P. and Novais, P.
Identifying Depression Clues using Emotions and AI.
DOI: 10.5220/0010332811371143
In Proceedings of the 13th International Conference on Agents and Artificial Intelligence (ICAART 2021) - Volume 2, pages 1137-1143
ISBN: 978-989-758-484-8
Copyright
c
2021 by SCITEPRESS – Science and Technology Publications, Lda. All rights reserved
1137

the dataset creation process. Section 4 presents an
exploratory data analysis to understand in detail the
dataset and its potential, using classification and clus-
tering techniques; this section also discusses a differ-
ent analysis regarding the collected dataset based on a
deep learning approach. The paper ends at Section 5,
where the conclusion and future work are presented.
2 RELATED WORK
Identifying depression using artificial intelligence is
not a new research area. During the last years, works
that handled aspects of depression, such as identifi-
cation, degree estimation and treatment monitoring,
through Machine Learning or Deep Learning tech-
niques have been produced.
De Choudhury et al(De Choudhury et al., 2013)
was a pioneer to describe how to construct a classi-
fier to identify Twitter depressive users based on the
analysis of their activities in social media. That re-
search introduced social media as a source of data for
recognizing symptoms of depression in a user, using
measures as user engagement and emotion, egocentric
social graph, linguistic style, depressive language use,
and mentions of antidepressant medications, reaching
70% accuracy and precision of 0.74.
The work of Tsugawa introduced an approach to
identify the level of depression in Twitter users with
an accuracy of 69% (Tsugawa et al., 2015). Based
on the user’s historical activities, he constructed an
SVM model fed by topics inferred from word fre-
quencies. These words were supplied by volunteers,
which filled a questionnaire to analyse the degree of
depression, and the history activities were gathered
through the Twitter API.
Orabi presented an approach using the CLPsych
2015 Shared task data that considers Twitter posts
from authors to detect depression (Orabi et al., 2018).
His approach created different word vectors ap-
proaches (Skip-Gram, CBOW, Optimized and Ran-
dom) and applied these word vectors to different Deep
Learning architectures, such as a Convolutional Neu-
ral Network (CNN) and Recurrent Neural Network
(RNN), reaching an accuracy of 87.957% and preci-
sion of 87.435% as better results.
The works of Arora (Arora and Arora, 2019), Zi-
wei (Ziwei and Chua, 2019), Tao (Tao et al., 2019)
and others, despite handling depression in Twitter us-
ing sentiment analysis, only consider the sentences
polarities (positive, negative or neutral).
All these works inspired and contributed with
some thoughts to our solution, but they do not con-
sider emotions as important information to identify
Figure 1: Plutchik’s wheel of emotions. Source (Maupom
´
e
and Isyutina, 2013).
depression, that is our contribution to this approach.
3 IDENTIFICATION OF
DEPRESSIVE PROFILES
People have in their personalities, characteristics that
distinguish them from others. Some people are shy,
others more enthusiastic or sarcastic in its remarks.
All these characteristics determine their personalities,
and according to discrete emotional theorists, this per-
sonality is present in our expressions - facial, speech,
dress - and can be described as a set of independent
and basic emotions.
In the literature, a well-known model proposed by
Ekman states that all emotion is composed of 6 basic
emotions: happiness, sadness, fear, anger, surprise,
and disgust (Ekman, 1992). For Plutchik, any senti-
ment is a combination of 8 basic emotions: Anger,
Anticipation, Disgust, Fear, Joy, Sadness, Surprise
and Trust, and can be mapped as a wheel in emo-
tions”. Additionally, Plutchik introduces a dimension
of intensity which differentiates all basic emotions ac-
cording to the intensity degree, introducing a 3D emo-
tional model, as exhibited in Fig. 1.
.
3.1 Emotional Profile
When handling with emotions, there is common
thinking that exists a straight connection between
emotions and mood, and it is true because mood ex-
presses emotions. However, the mood is different
from the emotional profile: while the emotional pro-
file of a person stays rigid throughout our life, the
mood is more open to change, influenced by the cur-
rent emotions. Therefore, it is not possible to consider
ICAART 2021 - 13th International Conference on Agents and Artificial Intelligence
1138

that the emotional profile could be detected in a short
period. Moreover, when reminding the definition of
WHO about depression (depression can be longlast-
ing or recurrent), we must consider a relevant time
interval to detect the emotional profile of an individ-
ual. Moreover the depression affects the emotional
profile of a person, not his mood.
In this work, we considered the emotional pro-
file of an individual as the set of the eight Plutchik’s
basic emotions, in a distribution where the sum of
all these emotions results in 100%. We decided to
use Plutchik’s model because we believe that it repre-
sents better a way to handle the emotions and provides
mechanisms to differentiate levels of each emotion.
3.2 Data Sample Creation
Dealing with depression in social media requires the
ability to identify a pattern in the writings of some-
one who is suffering. However, as well as depression
is known as the “silent killer” illness, it is very diffi-
cult to find data on social media posted by clinically
identified people with depression. For this reason,
we have adopted the strategy of searching in Twitter
all messages containing the text “I have depression”
in English. The objective of this approach is to col-
lect messages from authors self-declared depressives
for training a model using Natural Language Process-
ing and Machine Learning to identify the depressive
emotional profile. Of course that this approach can
lead some undesired messages or some “fake depres-
sive messages” - i.e. people posting that has depres-
sion but it is not true. For this reason, in this study,
we consider that all messages in Twitter are veridi-
cal (i.e. they are not ironic and not lying) and each
author which posted “I have depression” in Twitter
is a potential depressive. However, to minimize the
possibility of fake depressive authors, we decide to
perform an emotional profile validation across a re-
liable source. An example of a collected tweet is pre-
sented in Fig. 2.
Figure 2: Example of tweet collected.
The results from Twitter were manually analysed to
identify in which context the sentence was mentioned,
the authors of these sentences classified as “depres-
sives”, and they had all their tweets collected in a time
interval of 9 months.
For identifying non-depressive authors, we col-
lected messages from aleatory authors (initially iden-
tified these authors searching authors who posted any
sentence containing the aleatory word “tree”) in a
time interval of 9 months, as performed for depres-
sive authors.
During the tweets gathering, we discarded all re-
tweets and tweets containing mentions or links. This
is because we intend to detect the emotional profile of
the depressive author with no interferences, i.e., we
wanted the messages those are not a chat with others,
advertisements, neither posts from an influencer (in
case of re-tweets).
The data sample resulted in 622339 tweets of
10416 different profiles.
3.3 Tweets Preprocessing
After collecting a set of tweets messages from self-
declared depressive authors (128745 tweets from
3890 authors) and non-depressive authors ( tweets
from 6526 authors), the next step consisted of a text
preprocessing pipeline to remove unnecessary infor-
mation from the texts. This pipeline, as presented in
Fig. 3 have their steps as:
• Tokenization: converts the texts into a list of sin-
gle words, or tokens;
• Part of Speech: processes all messages for gram-
matical identification and cleaning all tokens
those grammatical categories are different from
nouns, verbs, adverbs and adjectives;
• Lemmatization: identifies the lemma for each to-
ken and saves it for later use;
• Undesired words removal: removes all words
contained in a “blacklist” (stopwords) and those
with 3 or fewer characters.
Figure 3: Preprocessing tasks.
The final result of this pipeline (therefore called pre-
processed text) is a new sentence containing only the
lemmas of words contained in tweets texts classified
as verbs, adverbs, adjectives and nouns, containing at
least 4 characters.
All preprocessing steps were developed under
Python using the Spacy
3
module for automatizing the
processes. We decided to use Spacy due to our expe-
rience in using this library.
3
https://spacy.io/
Identifying Depression Clues using Emotions and AI
1139

3.4 Sentiment Analysis
When the preprocessing is finished, the following step
in the dataset creation was to analyse the emotions
contained in the preprocessed texts. Regarding this
purpose, we developed a tool in Python that identi-
fies the frequency of each word on the preprocessed
text and compares it with an emotional lexicon. The
existence of the word into the lexicon results in the in-
formation of the word has an emotional context. Us-
ing the NRC Emotion lexicon (Mohammad and Tur-
ney, 2013) and NRC Affect Intensity lexicon (Mo-
hammad, 2018), we identified the frequencies of all
emotional words according to Plutchik’s emotional
definition and extracted the distribution of each emo-
tion in a text. Regarding the affect intensity, the ap-
proach was to sum all intensities of each emotion for
each preprocessed text.
Later, we identified the mean emotional profile
from each Twitter depressive author (TAMEP) to val-
idate the depressive authors (and avoid the fake self-
identified depressive). This measure is calculated
by the normalization of each emotion (summation of
each emotion divided by the sum of all emotions).
It results in a 12-dimension vector having values be-
tween 0 and 1, representing the average of each emo-
tion/intensity in a post.
For the emotional profile validation of depres-
sive authors, we created a depressive emotional base-
line using the solution presented by Kim (Kim et al.,
2020), that analysed Reddit’s community r/depression
as a source for depressive texts. In our case, we iden-
tified the mean emotional profile (RMEP) of depres-
sive posts from the last 600 Reddit’s posts and per-
formed the same steps described earlier to create the
emotional profile validator.
To validate if a Twitter depressive author is a valid
depressive profile, we performed a hypothesis test for
each author having TAMEP and RMEP. When the
null hypothesis could not be rejected (i.e., the p-value
between TAMEP and RMEP was less than 0.05), the
author profile in TAMEP was considered as depres-
sive.
For the other hand, to identify the non-depressive
profiles, we adopted a solution of measuring the co-
sine distance between the non-depressive authors in
TAMEP and RMEP. Once each emotional profile is a
12-dimensional vector (each Plutchik’s basic emotion
+ intensities), we defined as non-depressive profile the
ones that cosine distance between TAMEP and RMEP
is less or equal to 0.
This approach resulted in a set of 1788 authors
(947 classified as non-depressive and 841 classified
as depressive) and 492178 tweets collected.
Finally, we created a dataset containing the mean
of all emotions and intensities grouped by author and
trimester, where each author must have posted at least
150 messages. This minimal limit of 150 messages
was defined empirically because it is necessary to col-
lect as many messages as possible, so, authors having
less than this amount could bias the analysis due to
less information about their emotions.
This approach - known as bag-of-words - was
adopted because we intended to identify which emo-
tions and intensities are relevant to detect depression,
besides creating a “depressive emotional fingerprint”
through the words used in the texts.
Some recent NLP techniques - such as Word Vec-
tors and Transfer Learning - were discarded for this
study due to the nature of the problem detection in
the real world. Since a depressive person can be char-
acterized by negative emotions in their comments in
almost all situations in their lives, these techniques,
which can capture the context better than a bag of
words, are not relevant because the context of the
sentences is not relevant too. We consider that when
someone is depressive, their words are loaded of neg-
ative emotions in all situations, and for this reason,
it is relevant an author’s emotional profile snapshot
over the time - exactly as a psychologist does during
the treatment.
The final result was a dataset containing 1250 reg-
isters, divided into 686 non-depressive and 564 de-
pressive authors, indicating the average of emotions
and intensities of all your posts during the trimester.
To avoid problems with data unbalanced, we decided
to remove 11 aleatory non-depressive authors, result-
ing in 564 depressive and non-depressive authors. An
overview of the dataset is presented in Fig. 4.
4 DATA ANALYSIS
The data analysis was divided into two different anal-
ysis: Exploratory Analysis, and Machine Learning-
based analysis.
4.1 Exploratory Analysis
Exploratory analysis is the approach aimed at
analysing datasets to summarize their main features,
often with visual methods, aiming to find pieces of
information hidden in the data.
In this work, the initial approach in the ex-
ploratory analysis was to identify if the emotional data
are represented by a normal distribution. For this pur-
pose, we performed a Shapiro-Wilk test for each emo-
tion and intensity in the dataset. During our tests, all
ICAART 2021 - 13th International Conference on Agents and Artificial Intelligence
1140
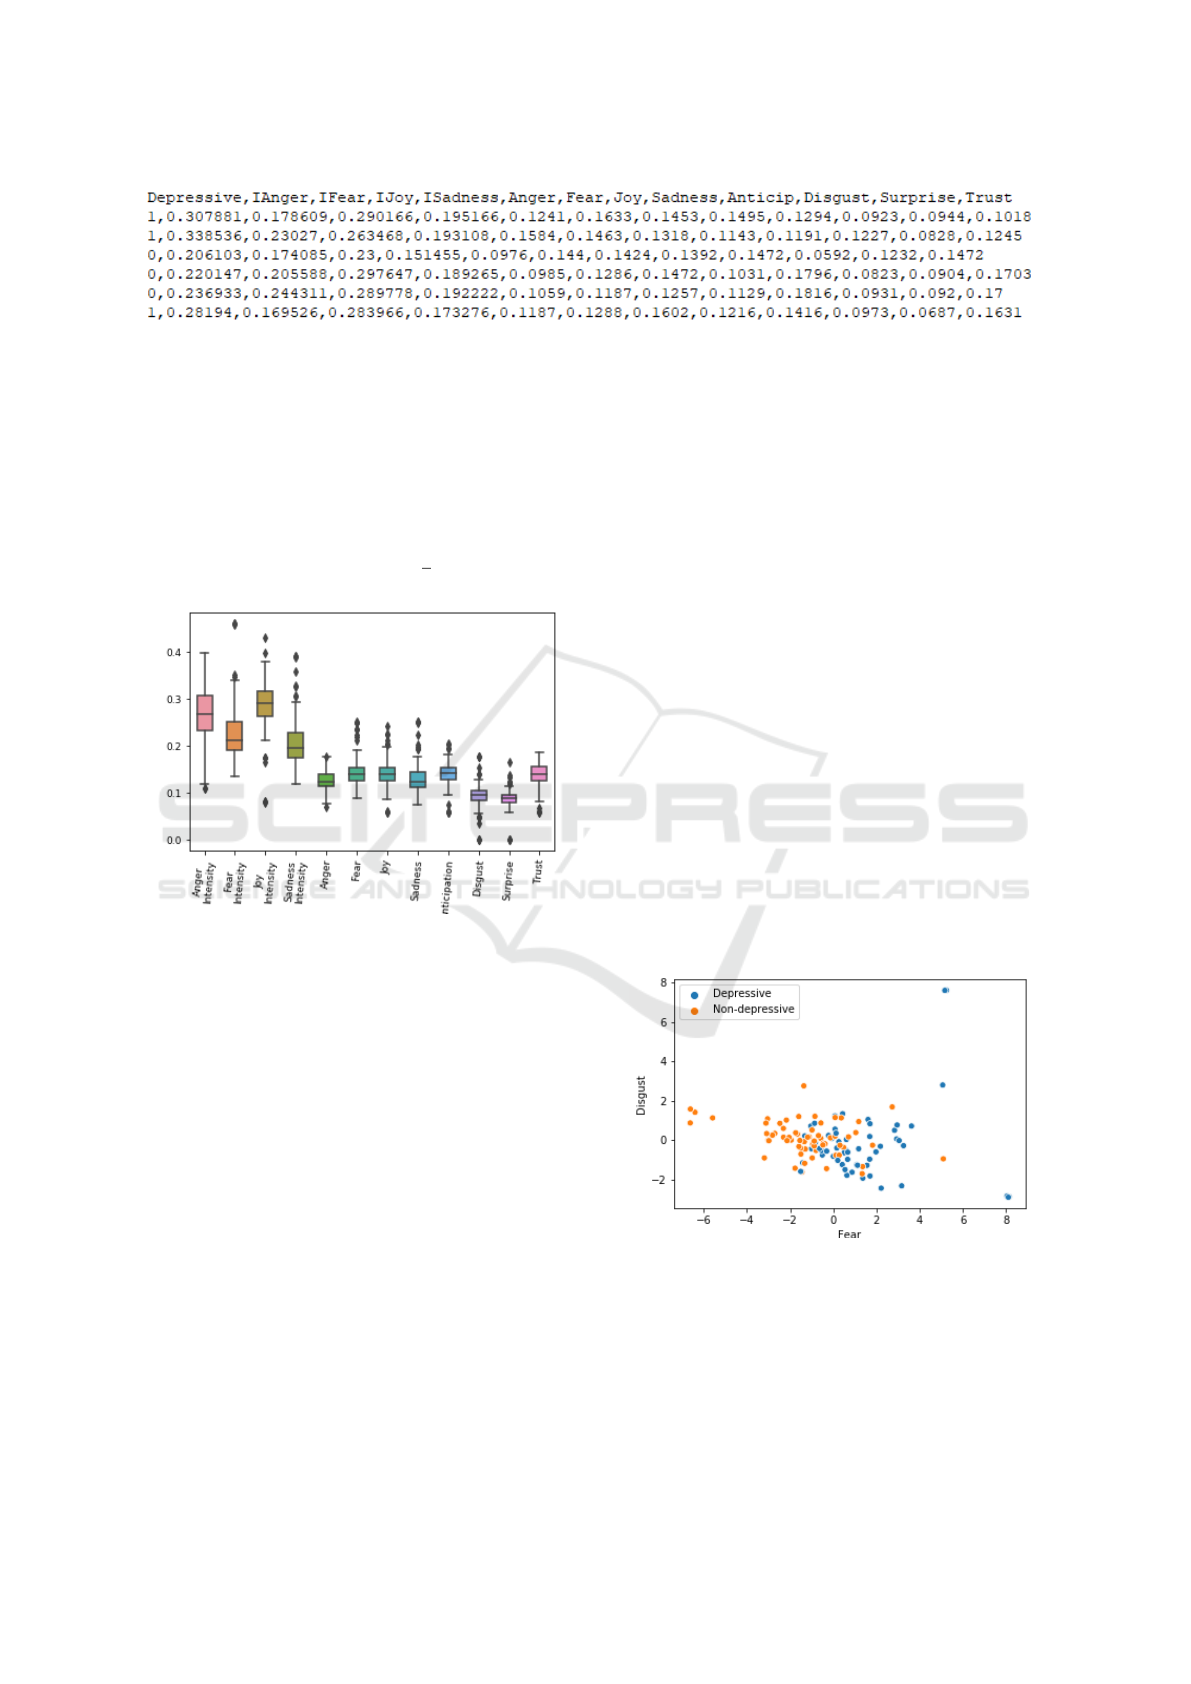
Figure 4: Dataset created.
p-value results were less than 0.05, confirming that
the data are represented as a normal distribution.
Later, the outliers in each emotion and intensity
were identified to remove them from the sample. For
this reason, we created a boxplot to identify visually
the range of each dataset’s dimension and their re-
spective number of outliers, as presented in Fig. 5.
Each emotion was considered as an outlier when its
value was out of the range [-2σ ≤ x ≤ 2σ].
Figure 5: Outliers identification.
Regarding outliers handling, our approach was to
change each outlier value for the mean of each
emotion or intensity category (depressive or non-
depressive). The reason was to avoid that outliers in
some emotion (for example) affect others in case of
removing the entire register.
The next step was to identify the relationship be-
tween the dataset dimensions and the depression indi-
cation. For this purpose, we measured the correlation
between the depressive flag and the emotions, as pre-
sented in Table 1.
These outcomes show that negative emotions
(anger, fear and sadness) have a moderated correla-
tion (r
2
) with depression, whereas positive emotions
(in this case, anticipation and joy) have an inverse
moderated correlation. The same analysis was per-
formed for the emotional intensities, as presented in
Table 2, confirming the same results.
Despite the data values analysed in the correla-
tion are different in their characteristics - emotions
have continuous values while the information about
depression has a nominal value - the Pearson corre-
lation can be applied because these data can be in-
terpreted as a biserial correlation. This is justified
because the depression indicative can only have 2 val-
ues, assuming binary characteristics.
4.2 Clustering Analysis
The objective of the Clustering Analysis is to per-
form data transformations to understand if and how
the data can be grouped. To achieve this, the initial
step was to transform the 12-dimension dataset into
a 2-dimension dataset for visualizing the data as a
scatter plot, and this would be impossible using 12-
dimension data.
Initially, we performed a Principal Component
Analysis (PCA) to reduce the dataset (with no infor-
mation about depressive classification) dimensional-
ity. The PCA algorithm identified that the most rele-
vant dimensions in the dataset were Fear and Disgust,
which can contain 72.33% of the information.
Next, the dataset resultant from PCA analysis fed
the KMeans algorithm used to cluster into two cate-
gories the data and generated a scatter plot. The re-
sultant graphic is presented in Figure 6.
Figure 6: Clusters of information.
This information is important because it shows
that the emotional data about depressive and non-
depressive can be divided into 2 distinct categories,
visually distant, and reinforced the WHO’s definition
about depression (“depressive disorders are charac-
terized by sadness, loss of interest or pleasure, feel-
ings of guilt or low self-worth, disturbed sleep or ap-
Identifying Depression Clues using Emotions and AI
1141

Table 1: Correlations between depressive status and basic emotions.
Basic emotions
Anger Anticipation Disgust Fear Joy Sadness Surprise Trust
0.47 -0.43 0.17 0.45 -0.56 0.32 -0.28 -0.19
Table 2: Correlation between depressive status and intensi-
ties.
Intensities
Anger Fear Joy Sadness
0.49 0.49 -0.43 0.41
petite, feelings of tiredness, and poor concentration”)
because it shows that emotions fear and disgust are
relevant to identify depression.
4.3 Machine and Deep Learning
Analysis
The next analysis consisted of the creation of a clas-
sification model able to identify the depressive emo-
tional profile in messages. To achieve this objective,
we used the dataset created in section 3.4 in some Ma-
chine Learning and Deep Learning algorithms, aim-
ing to identify the best model to classify depression.
Some characteristics from the problem (depres-
sion classification) and the dataset - as few examples -
were relevant in the choice of the algorithms analysed.
Algorithms like LDA (Linear Discriminant Analysis)
and Fisher Linear Discriminant were discarded be-
cause we believe that the problem is not represented
by a linear function.
So, in our analysis, the following algorithms were
considered: Support Vector Machines (SVM), Ran-
dom Forests, Naive Bayes, DNN and 1-D CNN. In
our analysis we just considered the algorithm’s in
their standard configuration and having as input each
emotion and intensities, in a dataset’s division of 30%
for testing and 70% for training. For the Deep Learn-
ing models, we created some different model archi-
tectures using Tensorflow to evaluate the better re-
sults. For DNN, the architecture whose got the best
precision was a 5-layer neural model (12-12-8-6-2
layers), having a dropout of 0.5 between each tier to
avoid overfitting, respectively. Regarding CNN archi-
tectures, the most accurate was a 5-tier 1-D Convo-
lutional Neural Network, using the same strategy of
dropout 0.5 on each tier to avoid overfitting.
The precision and mean squared error (MSE) for
each algorithm with its best result and network archi-
tecture is presented in Table 3.
As a baseline comparison, we performed classifi-
cation using the same algorithms and the same con-
figuration to identify the influence of emotional la-
Table 3: Benchmark of Machine and Deep Learning algo-
rithms.
Algorithm Precision MSE Recall
SVM 0.984 0.126 0.858
Random Forest 0.8 0.176 0.869
Naive Bayes 0.76 0.45 0.745
DNN 0.939 0.076 0.793
CNN 0.915 0.071 0.746
bels on the classification. As input values, all tweets
were transformed to 12-dimension word vectors us-
ing Word2Vec trained for 50 epochs. To calculate
the word embedding representation for each tweet, we
calculated the mean of all 12-dimension vector words
contained in the message. The resulting vector is con-
sidered the 12-dimension representation of the sen-
tence. The results of each algorithm are presented in
Table 4.
Table 4: Benchmark of Machine and Deep Learning algo-
rithms - Word2Vec.
Algorithm Precision MSE Recall
SVM 0.642 0.463 0.642
Random Forest 0.636 0.411 0.509
Naive Bayes 0.731 0.56 0.74
DNN 0.836 0.351 0.698
CNN 0.779 0.221 0.764
These results show that some Machine Learning al-
gorithms such as SVM and Deep Learning algorithms
as DNN can identify the depressive emotional pattern
with good precision. These results are better than the
results observed in Section 2, and the values obtained
in Table 4, reinforcing that the emotional text analysis
to identify depressives can be a promising alternative
to help people that are suffering silently.
5 CONCLUSION
Day after day, depression is becoming an epidemic
disease that affects people of different social levels,
cultures and ethnicities. Due to the nature of silence,
identifying people who ask for help because of this
illness but cannot verbalize that request is quite com-
plicated, and often goes unnoticed even by the person
suffering from depression.
The use of textual sentiment analysis can help
ICAART 2021 - 13th International Conference on Agents and Artificial Intelligence
1142

identify the disease as it is a non-invasive method that
can be continuously monitored. This is a huge help
in the war against depression because it enables us to
identify periods of wellness and sadness without a ne-
cessity to visit a psychologist, enabling a quick action
when necessary.
Despite many works in this research area, the re-
sults obtained for this emotional model to identify de-
pression are promising when compared to the previ-
ous efforts, principally when the precision of 0.984 on
depression classification is presented. However, once
the information was data collected from social me-
dia, we cannot discard the hypothesis of biased data,
because it is not possible to assure that the authors
were true when writing their posts. However, we be-
lieve that this approach when using texts from clin-
ically depressive authors - as the psychologists do -
tend to confirm the depression diagnostic identified
by the psychologist.
As future work, we plan to use this approach
on clinically identified depressive patients, to iden-
tify their emotional profiles and confirm that the
precision-based in social data remains when using
data collected from a controlled situation, as an ap-
pointment with the psychologist.
ACKNOWLEDGEMENTS
We would like to thank to Loggi
4
data team for all in-
teresting discussions about metrics and profile identi-
fication.
This work has been supported by FCT – Fundac¸
˜
ao
para a Ci
ˆ
encia e Tecnologia within the R&D Units
Project Scope: UIDB/00319/2020.
REFERENCES
Arora, P. and Arora, P. (2019). Mining twitter data for de-
pression detection. In 2019 International Conference
on Signal Processing and Communication (ICSC),
pages 186–189. IEEE.
De Choudhury, M., Gamon, M., Counts, S., and Horvitz,
E. (2013). Predicting depression via social media.
In Seventh international AAAI conference on weblogs
and social media.
Ekman, P. (1992). An argument for basic emotions. Cogni-
tion & emotion, 6(3-4):169–200.
Kim, J., Lee, J., Park, E., and Han, J. (2020). A deep learn-
ing model for detecting mental illness from user con-
tent on social media. Scientific Reports, 10(1):1–6.
Maupom
´
e, G. and Isyutina, O. (2013). Dental students’
and faculty members’ concepts and emotions associ-
4
https://www.loggi.com
ated with a caries risk assessment program. Journal of
dental education, 77:1477–87.
Mohammad, S. M. (2018). Word affect intensities. In
Proceedings of the 11th Edition of the Language
Resources and Evaluation Conference (LREC-2018),
Miyazaki, Japan.
Mohammad, S. M. and Turney, P. D. (2013). Crowdsourc-
ing a word-emotion association lexicon. 29(3):436–
465.
Orabi, A. H., Buddhitha, P., Orabi, M. H., and Inkpen,
D. (2018). Deep learning for depression detection of
twitter users. In Proceedings of the Fifth Workshop on
Computational Linguistics and Clinical Psychology:
From Keyboard to Clinic, pages 88–97.
Organization, W. H. et al. (2017). Depression and other
common mental disorders: global health estimates.
Technical report, World Health Organization.
Plutchik, R. (1984). Emotions: A general psychoevolution-
ary theory. Approaches to emotion, 1984:197–219.
Schafer, J. (2011). Reading people by the
words they speak — psychology today.
https://www.psychologytoday.com/us/blog/let-
their-words-do-the-talking/201106/reading-people-
the-words-they-speak. (Accessed on 04/13/2020).
Tao, X., Dharmalingam, R., Zhang, J., Zhou, X., Li, L.,
and Gururajan, R. (2019). Twitter analysis for de-
pression on social networks based on sentiment and
stress. In 2019 6th International Conference on Be-
havioral, Economic and Socio-Cultural Computing
(BESC), pages 1–4. IEEE.
Tsugawa, S., Kikuchi, Y., Kishino, F., Nakajima, K., Itoh,
Y., and Ohsaki, H. (2015). Recognizing depression
from twitter activity. In Proceedings of the 33rd an-
nual ACM conference on human factors in computing
systems, pages 3187–3196. ACM.
Ziwei, B. Y. and Chua, H. N. (2019). An application for
classifying depression in tweets. In Proceedings of
the 2nd International Conference on Computing and
Big Data, pages 37–41.
Identifying Depression Clues using Emotions and AI
1143
