
Towards Visual Sociolinguistic Network Analysis
Kostiantyn Kucher
1,2 a
, Masoud Fatemi
2,3 b
and Mikko Laitinen
2,4 c
1
Department of Computer Science and Media Technology, Linnaeus University, V
¨
axj
¨
o, Sweden
2
Center for Data Intensive Sciences and Applications, Linnaeus University, V
¨
axj
¨
o, Sweden
3
School of Computing, University of Eastern Finland, Kuopio/Joensuu, Finland
4
School of Humanities/English, University of Eastern Finland, Kuopio/Joensuu, Finland
Keywords:
Social Networks, Social Media, Variationist Sociolinguistics, Social Network Analysis, Network
Visualization, Text Visualization, Visual Analytics, Information Visualization.
Abstract:
Investigation of social networks formed by individuals in various contexts provides numerous interesting and
important challenges for researchers and practitioners in multiple disciplines. Within the field of variationist
sociolinguistics, social networks are analyzed in order to reveal the patterns of language variation and change
while taking the social, cultural, and geographical aspects into account. In this field, traditional approaches
usually focusing on small, manually collected data sets can be complemented with computational methods
and large digital data sets extracted from online social network and social media sources. However, increasing
data size does not immediately lead to the qualitative improvement in the understanding of such data. In
this position paper, we propose to address this issue by a joint effort combining variationist sociolinguistics
and computational network analyses with information visualization and visual analytics. In order to lay the
foundation for this interdisciplinary collaboration, we analyse the previous relevant work and discuss the
challenges related to operationalization, processing, and exploration of such social networks and associated
data. As the result, we propose a roadmap towards realization of visual sociolinguistic network analysis.
1 INTRODUCTION
The term social network gained immense popularity
during 2000s due to the emergence of Web 2.0 ser-
vices (Furht, 2010), which allowed users to explic-
itly denote their relations to other users and explore
the relations between other users as well as the digital
content created by them (thus leading to social media
services). However, research on such relations exist-
ing between individuals had already been conducted
within sociology for decades by that point (Gra-
novetter, 1973; Scott, 1988; Scott and Carrington,
2011). Analysis of social networks has also provided
a useful tool—and corresponding challenges—to re-
searchers in linguistics. More specifically, networks
have been studied within variationist sociolinguis-
tics (Milroy and Milroy, 1985; Labov, 2001; Cham-
bers and Schilling, 2013; Laitinen, 2020) as part of
the inquiry into the evolution of languages, their use,
and variation among individuals, groups, and popula-
a
https://orcid.org/0000-0002-1907-7820
b
https://orcid.org/0000-0002-3000-0381
c
https://orcid.org/0000-0003-3123-6932
tions (Milroy, 1980; Milroy, 1992; Marshall, 2004).
The main finding in this field is that social networks
influence how innovations diffuse into communities.
On the one hand, if people are linked with dense and
multiplex ties, their networks are close knit, and such
structures tend to resist change. On the other hand,
network ties can be weak, in which case individuals
are predominantly linked through occasional and in-
significant ties, and the network is loose knit. Em-
pirical evidence shows that loose-knit networks pro-
mote innovation diffusion. This somewhat counter-
intuitive observation builds on the idea that loose-
knit networks consist of people who are on the so-
cial fringes, which means that the cost of adopting an
innovation is low. Adopting an innovation is socially
risky, and people do not want to risk their social stand-
ing in close-knit social structures (Granovetter, 1973).
However, the traditional data sets used for social
network analysis within variationist sociolinguistics
were typically limited to manually collected observa-
tions and questionnaires with less than 50–70 indi-
viduals (Milroy, 1992; Marshall, 2004). Ample ev-
idence from social anthropology suggests that aver-
248
Kucher, K., Fatemi, M. and Laitinen, M.
Towards Visual Sociolinguistic Network Analysis.
DOI: 10.5220/0010328202480255
In Proceedings of the 16th International Joint Conference on Computer Vision, Imaging and Computer Graphics Theory and Applications (VISIGRAPP 2021) - Volume 3: IVAPP, pages
248-255
ISBN: 978-989-758-488-6
Copyright
c
2021 by SCITEPRESS – Science and Technology Publications, Lda. All rights reserved
Language
Users
Traditional, Manual
Data Collection
Approaches
Small-Scale
Data Sets
Knowledge of
Language Use,
Variation, and
Change
Computational
Methods
Sociolinguistics
Experts
Opportunity for
Visual Sociolinguistic Network Analysis
Digital Data
Collection
Approaches
Small-Scale
Sociolinguistic
Networks
Large-Scale
Sociolinguistic
Networks
Large-Scale
Data Sets
Effective Means of
Analyzing and Making
Sense of the Data
Traditional analyses possible for small-scale data sets,
but problematic for larger ones!
Geospatial Tem po ra l MultivariateTextual
Data
Aspects:
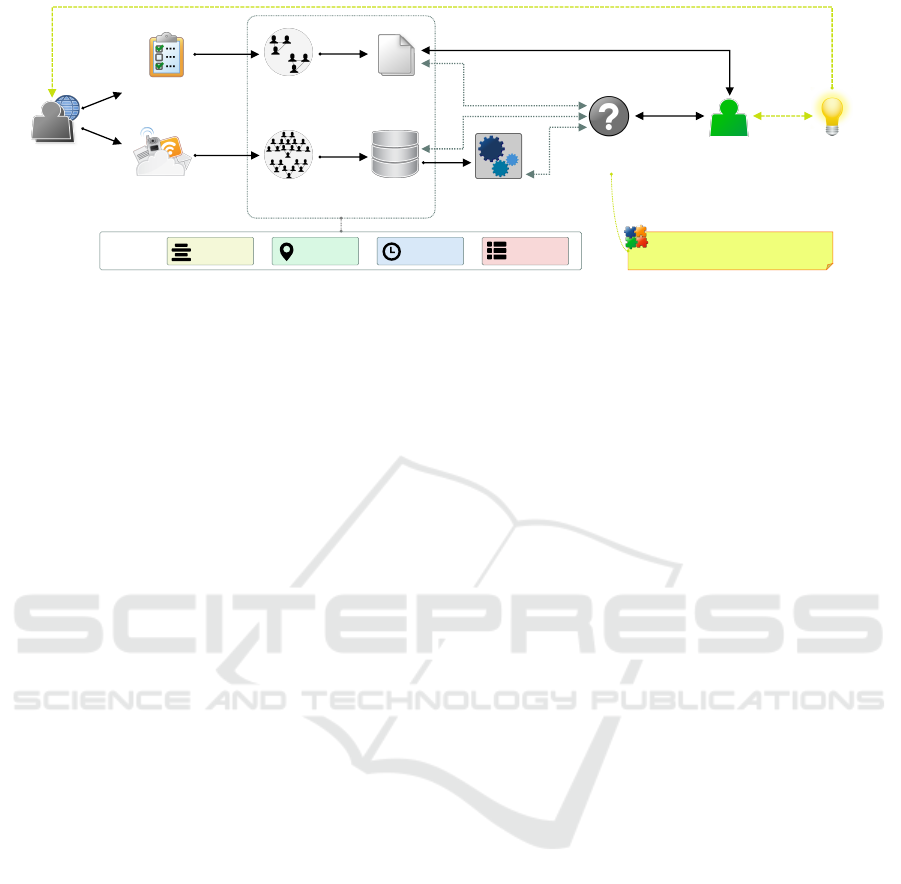
Figure 1: An overview of the concepts and challenges associated with visual sociolinguistic network analysis. While the
traditional, manual investigation methods can be sufficient for smaller data sets, they do not scale up to the large and complex
networks extracted from digital data sources such as social media. In order to make sense of such network data and the
associated metadata, an interdisciplinary approach combining linguistic, computational, and visual perspectives is necessary.
age network size, at least in Western societies, tends
to be over 150 nodes (McCarty et al., 2001). What
is more, the emergence of online social network and
social media services has provided the researchers
in this community—as well as the social sciences
and the humanities in general (Sch
¨
och, 2013)—with
an opportunity to expand the scope of their analyses
to much larger data sets, potentially with additional,
rich multivariate information associated with the net-
works (Hale, 2014; Kim et al., 2014). Such analy-
ses typically rely on computational methods devel-
oped within sociology, computer science, and compu-
tational sociolinguistics (Jurafsky and Martin, 2009;
Newman, 2010; Nguyen et al., 2016), as demon-
strated by the recent work (Laitinen et al., 2020).
The enthusiasm for the opportunities promised by
big data is sometimes met with a more pragmatic po-
sition that stresses the importance of smart data in-
stead (Sch
¨
och, 2013). The large scale and the ability
to process data sets with high speed are not always
sufficient on their own to help the researchers under-
stand the data better, gain useful insights, or formulate
further hypotheses, thus highlighting the importance
of interactive visual analyses.
In this position paper, we propose to look at the
challenge of analyzing social networks for the tasks
of variationist sociolinguistics from the point of view
of information visualization and visual analytics. By
combining the sociolinguistic, computational, and vi-
sual perspectives on social networks and the associ-
ated multivariate data (which can include geospatial,
temporal, and text attributes), we aim to lay the foun-
dation for visual sociolinguistic network analysis (see
Figure 1) and raise the awareness of both visualiza-
tion and sociolinguistic communities.
2 RELATED WORK
In order to understand the challenges and opportuni-
ties for our research problem, in this section, we dis-
cuss the related work on social network analysis and
visualization of network and text data.
2.1 Social Networks in Sociolinguistics
Social networks are studied in variationist soci-
olinguistics in the context of language use and
change (Milroy and Llamas, 2013; Dodsworth and
Benton, 2020). By investigating the structure and
the patterns of interaction between the individuals and
groups in such networks, researchers in sociolinguis-
tics are able to understand how the information prop-
agates, and how it affects the language used by in-
dividuals. One of such interaction aspects is related
to strong vs weak ties between the members of so-
cial networks (Granovetter, 1973), which might lead
either to suppression or facilitation of innovative lan-
guage use in the respective communities. Further as-
pects taken into account can include latent (long-term
and stable) vs emergent (swiftly evolving and rene-
gotiable) networks, coalitions (situational dense clus-
ters), and communities of practice (formed on the ba-
sis of certain group activity) (Bergs, 2006), and so on.
In the past decades, the availability of computa-
tional methods and digital data from online services
has made it possible to investigate not only small-
scale networks (including ego networks), but also
large simulated networks (Fagyal et al., 2010) and
networks extracted from social media data (Grand-
jean, 2016; Laitinen and Lundberg, 2020; Laitinen
et al., 2020). In order to make sense of such larger
networks, both computational and visual methods are
necessary, which are discussed next.
Towards Visual Sociolinguistic Network Analysis
249

2.2 Computational and Exploratory
Network Analysis
Social networks can be viewed from the more general
perspective of network analyses and applied graph
theory in computer science (Brandes and Erlebach,
2005; Newman, 2010), with the focus on the topol-
ogy, structures, and important elements existing in
such networks. The last of these tasks can be achieved
through the analysis of network centralities for the
nodes (such as betweenness or closeness), for in-
stance. In general, multiple network analysis methods
have been proposed and applied for social network
analyses (Scott, 1988; Aggarwal, 2011; Scott and
Carrington, 2011) and relevant aspects of social me-
dia and literary data analyses (Agarwal et al., 2012;
Pitas, 2016). We should also mention the multilayer
network approach (Kivel
¨
a et al., 2014), which pro-
vides a promising unified framework for modeling,
analyzing, and representing complex networks.
From the practical point of view, the tools and li-
braries available for computational analyses of social
networks typically include support for multiple tasks,
including centrality analysis, community detection,
and so on; here, we could list graph-tool (Peixoto,
2014), SNAP (Leskovec and Sosi
ˇ
c, 2016), and scikit-
network (Bonald et al., 2020) as several examples.
Some of the existing tools and libraries also provide
at least some capabilities for visualization and ex-
ploratory analysis (Brath and Jonker, 2015); here, we
could mention the JUNG library (O’Madadhain et al.,
2005) and the tools such as Pajek (Batagelj and Mrvar,
2004; de Nooy et al., 2018), EgoNet (McCarty et al.,
2007), Gephi (Bastian et al., 2009), NetMiner (Ghim
et al., 2014), and NodeXL (Hagberg et al., 2008;
Hansen et al., 2011). Some of the approaches devel-
oped for network analyses in other domains (e.g., bio-
logical network data) have also been successfully ap-
plied to social networks, for instance, Zhou et al. de-
scribe the application of Cytoscape for social network
data analyses as part of the VAST challenge (Zhou
et al., 2009). The recent approaches also provide
support for computational analyses and visualization
of multilayer networks, e.g., MuxViz (De Domenico
et al., 2015) and Py3plex (
ˇ
Skrlj et al., 2019). Further
contributions on representation and interactive anal-
ysis of graphs and networks that originate from the
visualization research community are discussed next.
2.3 Network Data Visualization
The recent research efforts in the fields of graph draw-
ing and network visualization cover a number of im-
portant tasks for representing and interacting with
multivariate networks (Kerren et al., 2014; Nobre
et al., 2019), temporal and dynamic graphs (Beck
et al., 2014; Kerracher et al., 2015; Beck et al., 2017),
group structures (Vehlow et al., 2015), and large-
scale graphs (von Landesberger et al., 2011). Several
frameworks encompassing multiple aspects of com-
plex real-world networks have been proposed as well,
including multi-faceted graph visualization (Had-
lak et al., 2015) and multilayer network visualiza-
tion (McGee et al., 2019).
Some of the tasks even more closely related
to social networks in sociolinguistics have also
been addressed to some extent by the existing ap-
proaches, for instance, visualization of small world
networks (Auber et al., 2003; van Ham and van Wijk,
2004) and visual analysis of centralities (Correa et al.,
2012; Kerren et al., 2012; Zimmer et al., 2012).
Visualization (Vi
´
egas and Donath, 2004) and vi-
sual analysis (Zhao and Tung, 2012) of social net-
works in particular has been in the focus of some
previous works, e.g., NodeTrix (Henry et al., 2007)
and NodeXL (Bonsignore et al., 2009). Several sur-
veys provide further overview of the approaches ex-
isting in this field (Du et al., 2015; Correa, 2017).
Finally, we should note that the interest for the chal-
lenges of social network visualization exists from the
perspective of social media visual analytics (Wu et al.,
2016; Chen et al., 2017), network visualization for the
humanities (B
¨
orner et al., 2019), and visual analysis
of multilayer networks across various disciplines and
domains (Kivel
¨
a et al., 2019).
2.4 Text Data Visualization
While the approaches discussed above focus mainly
on the network data relevant for sociolinguistics, we
should not forget the importance of tasks of visual
representation and interaction with language, speech,
and text data for this research field. The existing
text visualization and visual text analysis techniques
have been covered by several existing surveys (Alen-
car et al., 2012; Kucher and Kerren, 2015; Liu et al.,
2019; Alharbi and Laramee, 2019), including the
surveys focusing on the more specific problems of
topic (Dou and Liu, 2016) or sentiment (Kucher et al.,
2018) visualization, or visual analysis of texts for the
digital humanities (J
¨
anicke et al., 2015; J
¨
anicke et al.,
2017). El-Assady et al. describe their work on a com-
plete software platform that can be used for linguistic
analyses (El-Assady et al., 2019); and Hammarstr
¨
om
et al. make use of visualization in their work that
does not focus on text data per se, but rather the in-
formation about the statuses of languages around the
world (Hammarstr
¨
om et al., 2018).
IVAPP 2021 - 12th International Conference on Information Visualization Theory and Applications
250

As previously mentioned, the information about
social networks can also be extracted from rich so-
cial media data, which also has been in the focus of
multiple visual analytic approaches (Wu et al., 2016;
Chen et al., 2017). Several examples of such systems
that make use of both network and text data include
Whisper (Cao et al., 2012) and Verifi2 (Karduni et al.,
2019), among others; and one recent example that fo-
cuses on the language use trends on Twitter is Story-
wrangler (Alshaabi et al., 2020), for instance.
3 ROADMAP FOR VISUAL
SOCIOLINGUISTIC NETWORK
ANALYSIS
Based on (1) the prior experiences of researchers in
sociolinguistics and computational network analysis
and (2) the analysis of the state of the art in InfoVis
and visual analytics, we can now propose the roadmap
towards realization of visual sociolinguistic network
analysis as an interdisciplinary research effort:
Find the Common Ground. In order to establish
successful interdisciplinary collaboration, it is impor-
tant to be aware of the gaps existing between the
disciplines and domains (van Wijk, 2006), and to
align the goals set by the members of such a col-
laboration (Kirby and Meyer, 2013). Besides our
own prior experiences (Laitinen et al., 2017; Mar-
tins et al., 2017; Kucher et al., 2018; Laitinen et al.,
2018; Kucher et al., 2020; Simaki et al., 2020), we
could also rely on the discussions of previous col-
laborations between the experts in visualization and
the digital humanities (J
¨
anicke, 2016; Hinrichs et al.,
2017; Bradley et al., 2018). When designing applica-
tions and tools as part of such collaboration, it is also
important to consider the gaps between the designers’
and the end-users’ expectations and preferences: in
many cases, “simple is good” (Russell, 2016).
Establish the Design Process. The process for dis-
cussing the requirements of domain experts and de-
signing solutions proposed by the visualization re-
searchers can be structured according to one of the
models proposed in visualization, for instance, Mun-
zner’s nested model for visualization design and eval-
uation (Munzner, 2009). Since the end goal is not
just to design a novel visual representation for net-
work data, but rather to contribute to the efforts by
variationist sociolinguistics experts in making sense
of complex data from digital sources (Laitinen et al.,
2017; Laitinen et al., 2018; Laitinen et al., 2020), the
models and workflows discussed in visual analytics
must be taken into account, too (Sacha et al., 2014;
Andrienko et al., 2018). The visualization design
process can also make use of the categorizations of
user tasks discussed in literature (Shneiderman, 1996;
Brehmer and Munzner, 2013).
Address the Specific Visual Analysis Challenges.
Based on the discussion above, we expect that at least
the following challenges will have to be tackled in the
context of visual analysis of sociolinguistic social net-
works and the associated data:
• Representation and interaction with multiple (and
possibly numerous!) networks, subnetworks, and
network elements (Wang Baldonado et al., 2000;
Roberts, 2007);
• Comparison of such networks and network ele-
ments (Gleicher et al., 2011), including the com-
parison driven by the centrality analyses and de-
tected group structures (Vehlow et al., 2015);
• Facilitation of the complete visual analytic pro-
cess for the users (i.e., experts in sociolinguistics),
including the tasks of provenance, guidance, and
externalization of generated knowledge (Sacha
et al., 2014; Andrienko et al., 2018); and
• Integrating the computational and visual analy-
ses of the network data with the corresponding
analyses of the associated (meta-)data, which can
potentially involve textual (Kucher and Kerren,
2015; J
¨
anicke et al., 2015; J
¨
anicke et al., 2017;
Kucher et al., 2018), temporal or dynamic (Cot-
tam et al., 2012; Beck et al., 2014; Kerracher
et al., 2015; Beck et al., 2017), as well as geospa-
tial (Dykes et al., 2005) aspects.
This list is not conclusive, of course, and we expect
further challenges to be identified in the future.
Evaluate the Resulting Approaches. Besides the
challenges of designing and implementing visual an-
alytic solutions for the tasks discussed above, evalua-
tion of such visual analytic solutions is a major chal-
lenge on its own (Isenberg et al., 2013). Here, we
can use the body of knowledge focusing on task-based
user studies and evaluation of visualization and inter-
action techniques (Purchase, 2012); but also the ap-
proaches related to critical discussion (Kosara et al.,
2008), reflection (Meyer and Dykes, 2018), expert re-
views (Tory and M
¨
oller, 2005), questionnaires (Wall
et al., 2019), and even crowdsourcing (Archambault
et al., 2017) for evaluating InfoVis and visual analytic
approaches. Additionally, previous work focusing on
design and application studies is also available (Sedl-
mair et al., 2012; Weber et al., 2017).
Towards Visual Sociolinguistic Network Analysis
251

Raise Awareness within the Sociolinguistic Com-
munity. The last—but definitely not the least
important!—part of this roadmap is to use the exist-
ing examples, intermediate results, and applications
of new approaches to raise awareness about the value
and applicability of visualization methods (Fekete
et al., 2008) within the sociolinguistic research com-
munity. By nourishing such interdisciplinary collab-
orations (Hinrichs et al., 2017; Bradley et al., 2018),
all of the participants can gain new knowledge and
progress towards novel, important contributions.
4 CONCLUSIONS
In this position paper, we have discussed the problem
of visual analysis of social networks for variationist
sociolinguistics. Given the range and the complex-
ity of theoretical and practical challenges for making
sense and applying the knowledge about such net-
works and all of the associated data, including tex-
tual, temporal, geospatial, and other aspects, we ar-
gue that an interdisciplinary approach is required to
tackle this research problem, and that visual analytics
should be an integral part of that approach. As our fu-
ture work, we intend to proceed with realization of the
steps listed as our roadmap towards visual sociolin-
guistic network analysis, and we hope that both so-
ciolinguistic and visualization communities become
aware and involved in the work on this interesting and
important problem, which can lead to both theoretical
findings and practical applications in the future.
ACKNOWLEDGEMENTS
This research has been partially supported by the
funding of the Center for Data Intensive Sciences and
Applications (DISA) at Linnaeus University. We are
extremely grateful for this support.
REFERENCES
Agarwal, A., Corvalan, A., Jensen, J., and Rambow, O.
(2012). Social network analysis of Alice in Won-
derland. In Proceedings of the NAACL-HLT 2012
Workshop on Computational Linguistics for Litera-
ture, CLFL ’12, pages 88–96. ACL.
Aggarwal, C. C., editor (2011). Social Network Data Ana-
lytics. Springer US.
Alencar, A. B., de Oliveira, M. C. F., and Paulovich, F. V.
(2012). Seeing beyond reading: A survey on visual
text analytics. Wiley Interdisciplinary Reviews: Data
Mining and Knowledge Discovery, 2(6):476–492.
Alharbi, M. and Laramee, R. S. (2019). SoS TextVis:
An extended survey of surveys on text visualization.
Computers, 8(1).
Alshaabi, T., Adams, J. L., Arnold, M. V., Minot, J. R.,
Dewhurst, D. R., Reagan, A. J., Danforth, C. M.,
and Dodds, P. S. (2020). Storywrangler: A massive
exploratorium for sociolinguistic, cultural, socioeco-
nomic, and political timelines using Twitter. arXiv
Preprints, abs/2007.12988.
Andrienko, N., Lammarsch, T., Andrienko, G., Fuchs, G.,
Keim, D. A., Miksch, S., and Rind, A. (2018). View-
ing visual analytics as model building. Computer
Graphics Forum, 37(6):275–299.
Archambault, D., Purchase, H., and Hoßfeld, T., editors
(2017). Evaluation in the Crowd. Crowdsourcing
and Human-Centered Experiments: Dagstuhl Semi-
nar 15481, Dagstuhl Castle, Germany, November 22–
27, 2015, Revised Contributions. Springer.
Auber, D., Chiricota, Y., Jourdan, F., and Melanc¸on, G.
(2003). Multiscale visualization of small world net-
works. In Proceedings of the IEEE Symposium on
Information Visualization, InfoVis ’03, pages 75–81.
IEEE.
Bastian, M., Heymann, S., and Jacomy, M. (2009). Gephi:
An open source software for exploring and manip-
ulating networks. In Proceedings of the Interna-
tional AAAI Conference on Weblogs and Social Me-
dia, ICWSM ’09, pages 361–362. AAAI.
Batagelj, V. and Mrvar, A. (2004). Pajek — Analysis and
visualization of large networks. In J
¨
unger, M. and
Mutzel, P., editors, Graph Drawing Software, pages
77–103. Springer Berlin Heidelberg.
Beck, F., Burch, M., Diehl, S., and Weiskopf, D. (2014).
The state of the art in visualizing dynamic graphs. In
Proceedings of the Eurographics Conference on Visu-
alization — STARs, EuroVis ’14, pages 83–103. The
Eurographics Association.
Beck, F., Burch, M., Diehl, S., and Weiskopf, D. (2017). A
taxonomy and survey of dynamic graph visualization.
Computer Graphics Forum, 36(1):133–159.
Bergs, A. (2006). Analyzing online communication from
a social network point of view: Questions, problems,
perspectives. Language@Internet, 3(3).
Bonald, T., de Lara, N., Lutz, Q., and Charpentier, B.
(2020). Scikit-network: Graph analysis in Python.
Journal of Machine Learning Research, 21(185):1–6.
Bonsignore, E. M., Dunne, C., Rotman, D., Smith, M.,
Capone, T., Hansen, D. L., and Shneiderman, B.
(2009). First steps to NetViz Nirvana: Evaluating so-
cial network analysis with NodeXL. In Proceedings of
the IEEE International Conference on Computational
Science and Engineering, volume 4 of CSE ’09, pages
332–339.
B
¨
orner, K., Eide, O., Mchedlidze, T., Rehbein, M., and
Scheuermann, G. (2019). Network visualization in the
humanities (Dagstuhl Seminar 18482). Dagstuhl Re-
ports, 8(11):139–153.
Bradley, A. J., El-Assady, M., Coles, K., Alexander, E.,
Chen, M., Collins, C., J
¨
anicke, S., and Wrisley, D. J.
(2018). Visualization and the digital humanities:
IVAPP 2021 - 12th International Conference on Information Visualization Theory and Applications
252

Moving toward stronger collaborations. IEEE Com-
puter Graphics and Applications, 38(6):26–38.
Brandes, U. and Erlebach, T., editors (2005). Network Anal-
ysis: Methodological Foundations. Springer Berlin
Heidelberg.
Brath, R. and Jonker, D. (2015). Graph Analysis and Visu-
alization. John Wiley & Sons, Ltd.
Brehmer, M. and Munzner, T. (2013). A multi-level ty-
pology of abstract visualization tasks. IEEE Trans-
actions on Visualization and Computer Graphics,
19(12):2376–2385.
Cao, N., Lin, Y.-R., Sun, X., Lazer, D., Liu, S., and Qu,
H. (2012). Whisper: Tracing the spatiotemporal pro-
cess of information diffusion in real time. IEEE
Transactions on Visualization and Computer Graph-
ics, 18(12):2649–2658.
Chambers, J. and Schilling, N., editors (2013). The Hand-
book of Language Variation and Change. John Wiley
& Sons, Ltd, 2nd edition.
Chen, S., Lin, L., and Yuan, X. (2017). Social media visual
analytics. Computer Graphics Forum, 36(3):563–587.
Correa, C., Crnovrsanin, T., and Ma, K.-L. (2012). Visual
reasoning about social networks using centrality sen-
sitivity. IEEE Transactions on Visualization and Com-
puter Graphics, 18(1):106–120.
Correa, C. D. (2017). History and evolution of social net-
work visualization. In Encyclopedia of Social Net-
work Analysis and Mining. Springer New York, New
York, NY.
Cottam, J. A., Lumsdaine, A., and Weaver, C. (2012).
Watch this: A taxonomy for dynamic data visualiza-
tion. In Proceedings of the IEEE Conference on Visual
Analytics Science and Technology, VAST ’12, pages
193–202. IEEE.
De Domenico, M., Porter, M. A., and Arenas, A. (2015).
MuxViz: A tool for multilayer analysis and visual-
ization of networks. Journal of Complex Networks,
3(2):159–176.
de Nooy, W., Mrvar, A., and Batagelj, V. (2018). Ex-
ploratory Social Network Analysis with Pajek: Re-
vised and Expanded Edition for Updated Software.
Cambridge University Press, 3rd edition.
Dodsworth, R. and Benton, R. A. (2020). Language Varia-
tion and Change in Social Networks: A Bipartite Ap-
proach. Taylor & Francis.
Dou, W. and Liu, S. (2016). Topic- and time-oriented visual
text analysis. IEEE Computer Graphics and Applica-
tions, 36(4):8–13.
Du, J., Xian, Y., and Yang, J. (2015). A survey on social
network visualization. In Proceedings of the 1st Inter-
national Symposium on Social Science, isss-15, pages
419–423. Atlantis Press.
Dykes, J., MacEachren, A. M., and Kraak, M.-J., editors
(2005). Exploring Geovisualization. Elsevier Science.
El-Assady, M., Jentner, W., Sperrle, F., Sevastjanova, R.,
Hautli-Janisz, A., Butt, M., and Keim, D. (2019).
lingvis.io — A linguistic visual analytics framework.
In Proceedings of the 57th Annual Meeting of the
Association for Computational Linguistics: System
Demonstrations, pages 13–18. ACL.
Fagyal, Z., Swarup, S., Escobar, A. M., Gasser, L., and
Lakkaraju, K. (2010). Centers and peripheries: Net-
work roles in language change. Lingua, 120(8):2061–
2079.
Fekete, J.-D., van Wijk, J. J., Stasko, J. T., and North, C.
(2008). The value of information visualization. In In-
formation Visualization: Human-Centered Issues and
Perspectives, pages 1–18. Springer Berlin Heidelberg.
Furht, B., editor (2010). Handbook of Social Network Tech-
nologies and Applications. Springer US.
Ghim, G.-H., Cho, N., and Seo, J. (2014). NetMiner. In
Encyclopedia of Social Network Analysis and Mining,
pages 1025–1037. Springer New York.
Gleicher, M., Albers, D., Walker, R., Jusufi, I., Hansen,
C. D., and Roberts, J. C. (2011). Visual comparison
for information visualization. Information Visualiza-
tion, 10(4):289–309.
Grandjean, M. (2016). A social network analysis of Twitter:
Mapping the digital humanities community. Cogent
Arts & Humanities, 3(1).
Granovetter, M. S. (1973). The strength of weak ties. Amer-
ican Journal of Sociology, 78(6):1360–1380.
Hadlak, S., Schumann, H., and Schulz, H.-J. (2015). A
survey of multi-faceted graph visualization. In Pro-
ceedings of the Eurographics Conference on Visual-
ization — STARs, EuroVis ’15. The Eurographics As-
sociation.
Hagberg, A. A., Schult, D. A., and Swart, P. J. (2008). Ex-
ploring network structure, dynamics, and function us-
ing NetworkX. In Proceedings of the Python in Sci-
ence Conference, SciPy ’08, pages 11–15.
Hale, S. A. (2014). Global connectivity and multilinguals
in the Twitter network. In Proceedings of the SIGCHI
Conference on Human Factors in Computing Systems,
CHI ’14, pages 833–842. ACM.
Hammarstr
¨
om, H., Castermans, T., Forkel, R., Verbeek, K.,
Westenberg, M. A., and Speckmann, B. (2018). Si-
multaneous visualization of language endangerment
and language description. Language Documentation
& Conservation, 12:359–392.
Hansen, D. L., Shneiderman, B., and Smith, M. A. (2011).
Analyzing Social Media Networks with NodeXL: In-
sights from a Connected World. Morgan Kaufmann.
Henry, N., Fekete, J.-D., and McGuffin, M. J. (2007). Node-
Trix: A hybrid visualization of social networks. IEEE
Transactions on Visualization and Computer Graph-
ics, 13(6):1302–1309.
Hinrichs, U., El-Assady, M., Bradley, A. J., Forlini, S., and
Collins, C. (2017). Risk the drift! Stretching disci-
plinary boundaries through critical collaborations be-
tween the humanities and visualization. In Proceed-
ings of the 2nd Workshop on Visualization for the Dig-
ital Humanities, VIS4DH ’17.
Isenberg, T., Isenberg, P., Chen, J., Sedlmair, M., and
M
¨
oller, T. (2013). A systematic review on the prac-
tice of evaluating visualization. IEEE Transactions on
Visualization and Computer Graphics, 19(12):2818–
2827.
J
¨
anicke, S. (2016). Valuable research for visualization and
digital humanities: A balancing act. In Proceedings
Towards Visual Sociolinguistic Network Analysis
253

of the 1st Workshop on Visualization for the Digital
Humanities, VIS4DH ’16.
J
¨
anicke, S., Franzini, G., Cheema, M. F., and Scheuermann,
G. (2015). On close and distant reading in digital hu-
manities: A survey and future challenges. In Proceed-
ings of the EG/VGTC Conference on Visualization —
STARs, EuroVis ’15. The Eurographics Association.
J
¨
anicke, S., Franzini, G., Cheema, M. F., and Scheuermann,
G. (2017). Visual text analysis in digital humanities.
Computer Graphics Forum, 36(6):226–250.
Jurafsky, D. and Martin, J. H. (2009). Speech and Language
Processing. Prentice-Hall, Inc., 2nd edition.
Karduni, A., Cho, I., Wesslen, R., Santhanam, S., Volkova,
S., Arendt, D. L., Shaikh, S., and Dou, W. (2019). Vul-
nerable to misinformation? Verifi! In Proceedings of
the 24th International Conference on Intelligent User
Interfaces, IUI ’19, pages 312–323. ACM.
Kerracher, N., Kennedy, J., and Chalmers, K. (2015). A
task taxonomy for temporal graph visualisation. IEEE
Transactions on Visualization and Computer Graph-
ics, 21(10):1160–1172.
Kerren, A., K
¨
ostinger, H., and Zimmer, B. (2012). ViN-
Cent — Visualization of network centralities. In Pro-
ceedings of the International Conference on Computer
Graphics Theory and Applications and International
Conference on Information Visualization Theory and
Applications (VISIGRAPP ’12) — Volume 1: IVAPP,
IVAPP ’12, pages 703–712. SciTePress.
Kerren, A., Purchase, H., and Ward, M. O., editors (2014).
Multivariate Network Visualization. Springer.
Kim, S., Weber, I., Wei, L., and Oh, A. (2014). Sociolin-
guistic analysis of Twitter in multilingual societies. In
Proceedings of the ACM Conference on Hypertext and
Social Media, HT ’14, pages 243–248. ACM.
Kirby, R. M. and Meyer, M. (2013). Visualization col-
laborations: What works and why. IEEE Computer
Graphics and Applications, 33(6):82–88.
Kivel
¨
a, M., Arenas, A., Barthelemy, M., Gleeson, J. P.,
Moreno, Y., and Porter, M. A. (2014). Multilayer net-
works. Journal of Complex Networks, 2(3):203–271.
Kivel
¨
a, M., McGee, F., Melanc¸on, G., Riche, N. H., and
von Landesberger, T. (2019). Visual analytics of mul-
tilayer networks across disciplines (Dagstuhl Seminar
19061). Dagstuhl Reports, 9(2):1–26.
Kosara, R., Drury, F., Holmquist, L. E., and Laidlaw, D. H.
(2008). Visualization criticism. IEEE Computer
Graphics and Applications, 28(3):13–15.
Kucher, K. and Kerren, A. (2015). Text visualization tech-
niques: Taxonomy, visual survey, and community in-
sights. In Proceedings of the IEEE Pacific Visual-
ization Symposium, PacificVis ’15, pages 117–121.
IEEE.
Kucher, K., Martins, R. M., Paradis, C., and Kerren, A.
(2020). StanceVis Prime: Visual analysis of sentiment
and stance in social media texts. Journal of Visualiza-
tion, 23(6):1015–1034.
Kucher, K., Paradis, C., and Kerren, A. (2018). The state of
the art in sentiment visualization. Computer Graphics
Forum, 37(1):71–96.
Labov, W. (2001). Principles of Linguistic Change, Volume
2: Social Factors. Wiley.
Laitinen, M. (2020). Empirical perspectives on English
as a lingua franca (ELF) grammar. World Englishes,
39(3):427–442.
Laitinen, M., Fatemi, M., and Lundberg, J. (2020). Size
matters: Digital social networks and language change.
Frontiers in Artificial Intelligence, 3:46.
Laitinen, M. and Lundberg, J. (2020). ELF, language
change and social networks: Evidence from real-time
social media data. In Language Change: The Impact
of English as a Lingua Franca, pages 179–204. Cam-
bridge University Press.
Laitinen, M., Lundberg, J., Levin, M., and Lakaw, A.
(2017). Revisiting weak ties: Using present-day social
media data in variationist studies. In Exploring Future
Paths for Historical Sociolinguistics, pages 303–325.
John Benjamins Publishing Company.
Laitinen, M., Lundberg, J., Levin, M., and Martins, R. M.
(2018). The Nordic Tweet Stream: A dynamic real-
time monitor corpus of big and rich language data.
In Proceedings of the 3rd Digital Humanities in the
Nordic Countries Conference, DHN ’18, pages 349–
362. CEUR-WS.org.
Leskovec, J. and Sosi
ˇ
c, R. (2016). SNAP: A general-
purpose network analysis and graph-mining library.
ACM Transactions on Intelligent Systems and Tech-
nology, 8(1).
Liu, S., Wang, X., Collins, C., Dou, W., Ouyang, F., El-
Assady, M., Jiang, L., and Keim, D. A. (2019). Bridg-
ing text visualization and mining: A task-driven sur-
vey. IEEE Transactions on Visualization and Com-
puter Graphics, 25(7):2482–2504.
Marshall, J. (2004). Language Change and Sociolinguis-
tics: Rethinking Social Networks. Palgrave Macmillan
UK.
Martins, R. M., Simaki, V., Kucher, K., Paradis, C., and
Kerren, A. (2017). StanceXplore: Visualization for
the interactive exploration of stance in social media.
In Proceedings of the 2nd Workshop on Visualization
for the Digital Humanities, VIS4DH ’17.
McCarty, C., Killworth, P. D., Bernard, H. R., Johnsen,
E. C., and Shelley, G. A. (2001). Comparing two
methods for estimating network size. Human Orga-
nization, 60(1):28–39.
McCarty, C., Molina, J. L., Aguilar, C., and Rota, L. (2007).
A comparison of social network mapping and personal
network visualization. Field Methods, 19(2):145–162.
McGee, F., Ghoniem, M., Melanc¸on, G., Otjacques, B., and
Pinaud, B. (2019). The state of the art in multilayer
network visualization. Computer Graphics Forum,
38(6):125–149.
Meyer, M. and Dykes, J. (2018). Reflection on reflec-
tion in applied visualization research. IEEE Computer
Graphics and Applications, 38(6):9–16.
Milroy, J. (1992). Linguistic Variation and Change: On the
Historical Sociolinguistics of English. Blackwell.
Milroy, J. and Milroy, L. (1985). Linguistic change, social
network and speaker innovation. Journal of Linguis-
tics, 21(2):339–384.
IVAPP 2021 - 12th International Conference on Information Visualization Theory and Applications
254

Milroy, L. (1980). Language and Social Networks. Black-
well, 1st edition.
Milroy, L. and Llamas, C. (2013). Social networks. In The
Handbook of Language Variation and Change, chap-
ter 19, pages 407–427. John Wiley & Sons, Ltd, 2nd
edition.
Munzner, T. (2009). A nested model for visualization de-
sign and validation. IEEE Transactions on Visualiza-
tion and Computer Graphics, 15(6):921–928.
Newman, M. E. J. (2010). Networks: An Introduction. Ox-
ford University Press.
Nguyen, D., Do
˘
gru
¨
oz, A. S., Ros
´
e, C. P., and de Jong,
F. (2016). Computational sociolinguistics: A survey.
Computational Linguistics, 42(3):537–593.
Nobre, C., Meyer, M., Streit, M., and Lex, A. (2019). The
state of the art in visualizing multivariate networks.
Computer Graphics Forum, 38(3):807–832.
O’Madadhain, J., Fisher, D., White, S., Smyth, P., and
Boey, Y.-B. (2005). Analysis and visualization of net-
work data using JUNG. Unpublished preprint.
Peixoto, T. P. (2014). The graph-tool Python library.
figshare.
Pitas, I., editor (2016). Graph-Based Social Media Analy-
sis. CRC Press.
Purchase, H. C. (2012). Experimental Human-Computer
Interaction: A Practical Guide with Visual Examples.
Cambridge University Press.
Roberts, J. C. (2007). State of the art: Coordinated & mul-
tiple views in exploratory visualization. In Proceed-
ings of the Fifth International Conference on Coor-
dinated and Multiple Views in Exploratory Visualiza-
tion, CMV 2007, pages 61–71. IEEE.
Russell, D. M. (2016). Simple is good: Observations of
visualization use amongst the Big Data digerati. In
Proceedings of the International Working Conference
on Advanced Visual Interfaces, AVI ’16, pages 7–12.
ACM.
Sacha, D., Stoffel, A., Stoffel, F., Kwon, B. C., Ellis, G., and
Keim, D. A. (2014). Knowledge generation model for
visual analytics. IEEE Transactions on Visualization
and Computer Graphics, 20(12):1604–1613.
Sch
¨
och, C. (2013). Big? Smart? Clean? Messy? Data in the
humanities. Journal of Digital Humanities, 2(3):2–13.
Scott, J. (1988). Social network analysis. Sociology,
22(1):109–127.
Scott, J. and Carrington, P. J., editors (2011). The SAGE
Handbook of Social Network Analysis. SAGE Publi-
cations.
Sedlmair, M., Meyer, M., and Munzner, T. (2012). Design
study methodology: Reflections from the trenches and
the stacks. IEEE Transactions on Visualization and
Computer Graphics, 18(12):2431–2440.
Shneiderman, B. (1996). The eyes have it: A task by
data type taxonomy for information visualizations. In
Proceedings of the IEEE Symposium on Visual Lan-
guages, VL ’96, pages 336–343.
Simaki, V., Paradis, C., Skeppstedt, M., Sahlgren, M.,
Kucher, K., and Kerren, A. (2020). Annotating
speaker stance in discourse: The Brexit Blog Corpus.
Corpus Linguistics and Linguistic Theory, 16(2):215–
248.
ˇ
Skrlj, B., Kralj, J., and Lavra
ˇ
c, N. (2019). Py3plex toolkit
for visualization and analysis of multilayer networks.
Applied Network Science, 4(94).
Tory, M. and M
¨
oller, T. (2005). Evaluating visualizations:
Do expert reviews work? IEEE Computer Graphics
and Applications, 25(5):8–11.
van Ham, F. and van Wijk, J. J. (2004). Interactive visual-
ization of small world graphs. In Proceedings of the
IEEE Symposium on Information Visualization, Info-
Vis ’04, pages 199–206. IEEE.
van Wijk, J. J. (2006). Bridging the gaps. IEEE Computer
Graphics and Applications, 26(6):6–9.
Vehlow, C., Beck, F., and Weiskopf, D. (2015). The state
of the art in visualizing group structures in graphs. In
Proceedings of the Eurographics Conference on Vi-
sualization — STARs, EuroVis ’15. The Eurographics
Association.
Vi
´
egas, F. B. and Donath, J. (2004). Social network visual-
ization: Can we go beyond the graph? In Proceedings
of the CSCW ’04 Workshop on Social Networks.
von Landesberger, T., Kuijper, A., Schreck, T., Kohlham-
mer, J., van Wijk, J. J., Fekete, J.-D., and Fellner,
D. W. (2011). Visual analysis of large graphs: State-
of-the-art and future research challenges. Computer
Graphics Forum, 30(6):1719–1749.
Wall, E., Agnihotri, M., Matzen, L., Divis, K., Haass, M.,
Endert, A., and Stasko, J. (2019). A heuristic approach
to value-driven evaluation of visualizations. IEEE
Transactions on Visualization and Computer Graph-
ics, 25(1):491–500.
Wang Baldonado, M. Q., Woodruff, A., and Kuchinsky, A.
(2000). Guidelines for using multiple views in infor-
mation visualization. In Proceedings of the Working
Conference on Advanced Visual Interfaces, AVI ’00,
pages 110–119. ACM.
Weber, G. H., Carpendale, S., Ebert, D., Fisher, B., Hagen,
H., Shneiderman, B., and Ynnerman, A. (2017). Ap-
ply or die: On the role and assessment of application
papers in visualization. IEEE Computer Graphics and
Applications, 37(3):96–104.
Wu, Y., Cao, N., Gotz, D., Tan, Y.-P., and Keim, D. A.
(2016). A survey on visual analytics of social
media data. IEEE Transactions on Multimedia,
18(11):2135–2148.
Zhao, F. and Tung, A. K. H. (2012). Large scale cohesive
subgraphs discovery for social network visual analy-
sis. Proceedings of the VLDB Endowment, 6(2):85–
96.
Zhou, H., Shaverdian, A. A., Jagadish, H. V., and Michai-
lidis, G. (2009). Multiple step social structure analy-
sis with Cytoscape. In Proceedings of the IEEE Sym-
posium on Visual Analytics Science and Technology,
VAST ’09, pages 263–264. IEEE.
Zimmer, B., Jusufi, I., and Kerren, A. (2012). Analyzing
multiple network centralities with ViNCent. In Pro-
ceedings of the SIGRAD 2012 Conference on Inter-
active Visual Analysis of Data, SIGRAD ’12, pages
87–90. Link
¨
oping University Electronic Press.
Towards Visual Sociolinguistic Network Analysis
255
