
On the Optimal Strategy for Tackling Head Motion in fMRI Data
Júlia F. Soares
1 a
, Rodolfo Abreu
1 b
Ana Cláudia Lima
2
, Sónia Batista
2,3
, Lívia Sousa
2,3
,
Miguel Castelo-Branco
1,3 c
and João Valente Duarte
1,3 d
1
Coimbra Institute for Biomedical Imaging and Translational Research (CIBIT),
Institute for Nuclear Sciences Applied to Health (ICNAS), University of Coimbra, Coimbra, Portugal
2
Neurology Department, Centro Hospitalar e Universitário de Coimbra, Coimbra, Portugal
3
Faculty of Medicine, University of Coimbra, Coimbra, Portugal
Keywords: Head Motion, Task-fMRI, Modelling, Interpolation.
Abstract: Head motion critically hampers the quality of functional magnetic resonance imaging (fMRI) data, with
several methods for its correction being already available in the literature. Head shifts are usually corrected
by realigning all functional volumes with relation to a reference volume using affine transformations, from
which the estimated motion parameters (MPs) can be additionally regressed out from fMRI data. However, a
consensus regarding the number of MPs to regress has not been achieved yet. More critically, abrupt head
motion induces the so-called motion outliers in the data, which cannot be accounted for by affine
transformations. Two common approaches are widely used to tackle this type of motion, namely modelling
strategies such as censoring, and volume interpolation. However, a direct comparison between strategies to
tackle motion outliers has not been performed so far. Importantly, to our knowledge no study has focused on
determining the extent at which the effects of different head motion correction methods differ between groups
in clinical studies. This is particularly relevant in task-related functional connectivity fMRI studies, which are
rapidly increasing in clinical research. In this study, we started by determining the optimal number of MPs
(between 6 and 24) to be regressed out from fMRI data collected from 8 participants (4 patients with Multiple
Sclerosis and 4 healthy controls) performing a perceptual decision-making task. Then we tested motion
censoring and volume interpolation for correcting motion outliers, using FD and DVARS metrics to detect
the outlier volumes. We found that task-specific activated brain regions were detected with higher sensitivity
when using 6 MPs relatively to using 24 MPs. As for the correction of motion outliers, our results suggest
that volume interpolation is the best method to use, however more data and external validation is needed to
achieve a definite conclusion. Importantly, the performance of motion correction algorithms was irrespective
of the subject group (patients and healthy participants). Our results pave the way towards finding an optimal
motion correction strategy, which is required to improve the accuracy of fMRI analyses in healthy and patient
populations and are an encouragement to test comprehensively different approaches.
1 INTRODUCTION
The blood oxygen-level-dependent (BOLD) signal
measured with functional magnetic resonance
imaging (fMRI) in the brain is a mixture of
fluctuations from both neuronal and non-neuronal
origins, the latter being responsible for inducing
BOLD signal changes that account for a substantial
amount of its variance (Caballero-Gaudes and
Reynolds 2017).
a
https://orcid.org/0000-0002-8960-7794
b
https://orcid.org/0000-0001-9496-3534
c
https://orcid.org/0000-0003-4364-6373
d
https://orcid.org/0000-0001-8586-9554
One of the most problematic sources of noise is head
motion. Because fMRI volumes are acquired over
multiple slices, the movement of the head causes
excitation of different slices at subsequent time points
relative to previous ones. These so-called ‘spin
history’ effects lead to motion-related changes in
BOLD signal intensity that obfuscate the
measurement of localized haemodynamic responses
(Parkes et al. 2018). This will cause distortions and
signal dropouts in brain regions prone to these effects.
306
Soares, J., Abreu, R., Lima, A., Batista, S., Sousa, L., Castelo-Branco, M. and Duarte, J.
On the Optimal Strategy for Tackling Head Motion in fMRI Data.
DOI: 10.5220/0010327803060313
In Proceedings of the 14th International Joint Conference on Biomedical Engineering Systems and Technologies (BIOSTEC 2021) - Volume 4: BIOSIGNALS, pages 306-313
ISBN: 978-989-758-490-9
Copyright
c
2021 by SCITEPRESS – Science and Technology Publications, Lda. All rights reserved

In general, the effect of head motion is predominantly
seen in voxels at the edges of the brain and in voxels
lying close to tissue boundaries due to the differences
in proton density and relaxation parameters across
brain tissues (Liu 2016)
. Nonetheless, any brain
region might suffer from detrimental effects of head
motion.
There are two main types of head motion: gradual
head shifts and sudden movements of the head known
as motion outliers (Liu 2016). To compensate for
head shifts, it is common practice to realign the data
(as part of typical fMRI preprocessing) by estimating
the position of the head in space at each volume
relatively to a reference volume using rigid body
transformations. In a rigid body transformation, head
position is described at each timepoint by six motion
parameters (MPs): translational displacements along
X, Y, and Z axes; and rotational displacements of
pitch, yaw, and roll. In order to exclude the variance
of the BOLD signal associated with head shifts, these
6 MPs are commonly included as nuisance regressors
in a General Linear Model (GLM) analysis of the
fMRI data. Because residual BOLD variance
associated with head shifts can still be present,
additional MP-derived regressors have been
suggested, namely the temporal derivatives of the
MPs (Power et al. 2013). Motion outliers induce the
most critical BOLD signal changes. These can be
identified as spikes in the data and cause large
variations in image intensity. Such spikes are not
accurately estimated using rigid body
transformations, and thus the motion correction step
or the regression of the MPs fail to account for them.
As a solution, several metrics have been proposed for
the detection of motion outliers, the most common
being the Framewise Displacement (FD) and the
Derivative or root mean square VARiance over
voxelS (DVARS) (Power et al. 2013). Then, motion
outliers can be corrected through motion censoring
(or scrubbing), whereby additional scan nulling
regressors (with 1s at the volumes where motion
spikes are detected and thus to be censored, and 0s
elsewhere) are regressed out from the fMRI data
(Siegel et al. 2014). Alternatively, volumes associated
with motion outliers can be interpolated based on
non-corrupted volumes (Rudas et al. 2020;
Mckechanie et al. 2019; Mazaika et al. 2009;
Caballero-Gaudes and Reynolds 2017).
Both task-related activation maps and measures of
functional connectivity depending on both short- and
long-range connections might be affected by both
types of head motion (Power et al. 2014; Seto et al.
2001). Resting-state fMRI studies have demonstrated
that head motion can introduce systematic bias to
connectivity estimates by creating spurious but
spatially structured patterns in functional
connectivity (Maknojia et al. 2019; Parkes et al. 2018;
Power et al. 2014). In
task-based fMRI studies, head
motion is particularly problematic when it correlates
with the experimental tasks leading to false brain
activations. If not properly accounted for, head
motion will bias the statistical results, reducing the
sensitivity and specificity for detecting task-specific
BOLD responses (Caballero-Gaudes and Reynolds
2017; Power et al. 2014; Seto et al. 2001).
Despite all the known effects of head motion on
the quality of fMRI data, and several correction
options, there is still no consensus regarding the
optimal number of MP-related regressors to consider
for tackling head shifts, nor the most appropriate
approach to mitigate motion outliers.
Also, there is a lack of studies in determining the
extent at which the effects of head motion differ
between groups in clinical studies. This is particularly
relevant in task-related functional connectivity fMRI
studies, which are rapidly increasing in clinical
research.
In this study, we started by testing the number of
MPs (between 6 and 24) that would improve the
ability to accurately detect task-specific BOLD
responses on fMRI data collected from 8 participants
performing a perceptual decision-making task. Then,
we tested motion censoring and volume interpolation
approaches for tackling motion outliers, with the
volumes to be censored detected with the FD and
DVARS metrics, whereas volumes to be interpolated
were identified with FD. The best approach (and
metric) was also determined based on the quality of
the data analyses. The effect of different approaches
for correction of head motion on task-related
activation maps was also compared between a control
group of healthy participants and a clinical group of
patients with Multiple Sclerosis.
2 METHODS
2.1 Participants
This study includes 4 patients with Multiple Sclerosis
(MS) and 4 healthy controls. Patients were recruited
at the Coimbra Hospital and Universitary Centre
(CHUC) and met the criteria for MS diagnosis
according to McDonald Criteria (Thompson et al.
2018). All participants gave written informed
consent. Local ethics committee approved the study.
On the Optimal Strategy for Tackling Head Motion in fMRI Data
307
2.2 Data Acquisition
Imaging was performed on a 3T Siemens
MAGNETOM Prisma Fit MRI scanner (Siemens,
Erlangen) using a 64-channel RF receive coil, at the
Portuguese Brain Imaging Network (Coimbra,
Portugal). fMRI data was acquired using a 2D
simultaneous multi-slice (SMS) gradient-echo echo-
planar imaging (GE-EPI) sequence (6× SMS and 2×
in-plane GRAPPA accelerations), with the following
parameters: TR/TE = 1000/37 ms, voxel size =
2.0×2.0×2.0 mm
3
, 72 axial slices (whole-brain
coverage), FOV = 200×200 mm
2
, FA = 68°, and
phase encoding in the anterior-posterior direction. A
short EPI acquisition (10 volumes) with reversed
phase encoding direction (posterior-anterior) was
also performed prior to each fMRI run, for image
distortion correction. A 3D anatomical T1-weighted
MP2RAGE (TR = 5000 ms, TE = 3.11 ms; 192
interleaved slices with isotropic voxel size of 1 mm)
was also collected for subsequent image registration.
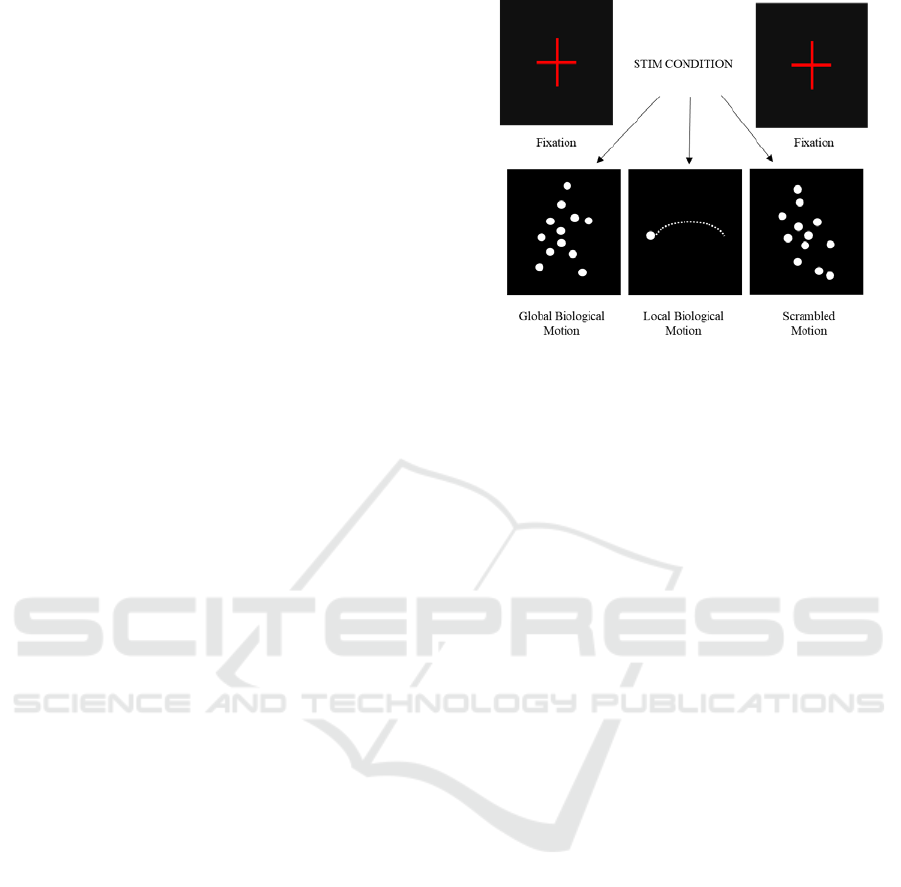
2.3 Behavioral Task
The imaging session contained two functional runs
for collection of BOLD signals during the
performance of a perceptual decision-making task on
biological motion (BM), each consisting of 507
volumes (approximately 8.37 minutes). This task
comprised three categories of visual motion stimuli:
global biological motion; local biological motion; and
scrambled motion. Biological motion stimuli were
built based on human motion capture data collected at
60 Hz, comprising 12 point-lights placed at the main
joints of a male walker. Each BM perception run
consisted of 12 blocks of 40 seconds: 4 or 5 blocks
(depending on the starting block) of the point-light
walker facing rightwards or leftwards (global
biological motion), 4 or 5 blocks showing only the
point-light located at the right ankle and moving
rightwards of leftwards (local biological motion), and
3 blocks of point lights randomly positioned across
the y axis, while maintaining their true trajectory
across the x axis (scrambled motion). After each
stimulus presentation, the participants reported the
direction of motion of the dots (left or right) by
pressing one of two buttons. Figure 1 is a schematic
representation of the visual stimuli.
Figure 1: Schematic representation of the visual stimuli.
2.4 Data Processing
2.4.1 Pre-processing Steps
fMRI data were preprocessed using the MATLAB®
software, with SPM12 and the PhysIO toolbox
(Kasper et al. 2017), except for image distortion
correction which was performed using FMRIB
Software Library (FSL). The first part of the pre-
processing pipeline included: 1) slice timing
correction; 2) realignment of all fMRI volumes
relative to the first volume; 3) correction of geometric
distortions caused by magnetic field inhomogeneity;
4) bias field correction. The second part of the
preprocessing was related to regression of non-
neuronal fluctuations such as cardiac and respiratory
signals, WM and ventricular CSF average BOLD
fluctuations and head motion spikes. First, image
coregistration (anatomical to functional) and
segmentation of the structural image were done to
extract WM and ventricular CSF masks. Noise
fluctuations (cardiac and respiratory signals, WM and
CSF average BOLD fluctuations) including 6 and 24
MPs were computed with PhysIO toolbox and then
regressed out of the BOLD signal. After determining
the optimal set of MPs, motion outliers were either
regressed out of the BOLD signal (by adding scan
nulling regressors consisting of 1 at the volume to be
censored and 0s elsewhere) or interpolated. These
were identified with the FD or DVARS metrics. The
pre-processing was completed with spatial smoothing
with a 3 mm full-width-at-half-maximum (FWHM)
isotropic Gaussian kernel and high-pass temporal
filtering with a cut-off period of 108 s.
BIOSIGNALS 2021 - 14th International Conference on Bio-inspired Systems and Signal Processing
308

2.4.2 Motion Processing
The first step is to study the number of MPs (between
6 and 24) needed to correct the effects caused by head
shifts and consequently which one would improve the
ability of our models to accurately detect task-specific
BOLD. Here, we tested 6 and 24 MPs because they
represent the two extreme cases complexity-wise
(Maknojia et al. 2019). The 6 MPs were computed as
part of the volume realignment step and the 24 MPs
which correspond to squares of the 6 MPs and
temporal derivatives were computed with PhysIO
toolbox. Then we regressed out these MPs from the
BOLD signal.
To test which strategy is best to correct the motion
outliers’ effects (modelling or interpolation), we start
by detecting the outlier’s volumes with the two most
used metrics: FD and DVARS.
FD is a scalar quantity to express instantaneous
head motion and it is computed through the time
series of the six MPs obtained during the motion
correction step (Power et al. 2013).
DVARS is a measure computed from the data
itself and does not depend on the MPs. It represents
how much the intensity of a volume changes in
comparison to the previous one (Power et al. 2013).
After identification of motion outliers, we tested
modelling strategies through motion censoring (with
1s at the volumes where motion spikes are detected
and thus to be censored, and 0s elsewhere) and
regression and volume interpolation to correct motion
outliers’ effects in data.
Modelling strategies were firstly implemented
with motion outliers being identified with FD and
secondly with motion outliers being detected by
DVARS. We used PhysIO toolbox to apply FD metric
with a threshold of 0.5mm and FSL utility
fsl_motion_outliers to compute the DVARS for all
volumes; motion outliers were identified by
thresholding the DVARS at the 75th percentile plus
1.5 times the inter-quartile range.
The last method we used to repair the volumes
most affected by movement was a linear interpolation
(INTERP) with the ArtRepair software (Mazaika et
al. 2009). Motion outliers were identified with FD
metric with a threshold of 0.5mm.
2.5 Statistical Analysis
For the purpose of mapping the regions involved in
our perceptual task, the GLM framework was used.
GLM is a common way to analyse fMRI and it is
basically a linear regression represented by:
= + (1)
with y the time series from one voxel, X the design
matrix, β the model parameters, ε, the normally
distributed error (or residuals) with zero mean (Pernet
2014).Onsets and durations of each experimental
condition were included in the model of the BOLD
signal as regressors of interest representative of our
task. We ended up with three regressors representing
periods showing global biological motion, local
biological motion, and scrambled motion. These
regressors were built based on unit boxcar functions
with ones during the respective periods, and zeros
elsewhere and convolved with a canonical, double-
gamma hemodynamic response function (HRF). The
HRF-convolved regressors were then included in a
GLM (X, the design matrix) that was subsequently
fitted to the fMRI data. After the fitting, the β’s are
estimated, weighting the relevance of each regressor
in explaining the variance of the data. Here, we set to
study brain regions that are activated when global
biological motion stimuli are present more than when
scrambled motion versions appears. Thus, the areas
associated with this condition were localized
according to the following contrast: [global biological
motion – scrambled motion].
Because many voxels are tested simultaneously,
the chance of observing false positives (i.e., the
Family Wise Error (FWE) rate) is very high in the
absence of any correction. To address this issue, we
used a FEW correction method based on Random
Field Theory (RFT), and we only considered
activations as significant those with a threshold of p
< 0.05 (the probability that we will observe a false
positive is only 5%).
GLMs were estimated for each participant
containing the two runs of the behavioral task and
statistical maps with voxels exhibiting significant
changes specified by the contrast [global biological
motion – scrambled motion] were identified with a
cluster threshold of p < 0.05 (FWE corrected).
After determining the optimal set of MPs (6, see
Results below), the subsequent analyses regarding
motion outliers were performed only considering 6
MPs. In this way, each participant ended up with 5
GLMs consisting of: 1) only 6 MPs, 2) only 24 MPs,
3) 6 MPs and motion outliers regressors detected with
FD, 4) 6 MPs and motion outliers regressors detected
with DVARS, 5) interpolated volumes.
From the resulting activation maps, the maximum
(Z-max) and mean (Z-mean) Z-score values were
extracted. Also, we quantified the amount of variance
of the average BOLD signal
On the Optimal Strategy for Tackling Head Motion in fMRI Data
309

across each activation map that was explained by the
MPs
2
( BOLD/Motion). Despite the MPs are
regressed out from the data and motion outliers
corrected, head motion may not be fully corrected,
thus leaving residual contributions in the BOLD
signal (Abreu 2017). The
2
( BOLD/Motion)
measure was estimated by the coefficient of
determination adjusted for the degrees of freedom,
2
which is defined according to (Montgomery,
Peck, and Vining 2012):
2
= 1 −
− 1
− − 1
∑
2
=1
∑ (
− �
)
2
=1
(2)
where � is the average BOLD signal, N is the number
of volumes and P the number of motion regressors; ε
denotes the residual of the model under analysis,
which is described by = − , where is the
matrix containing the MPs, and β the associated
weights estimated using a GLM framework.
These were the metrics we compared to assess the
quality of each method. The Z values indicate the
sensitivity of the model in detecting brain regions that
are associated with our behavioral task. The higher
the values of Z the higher is the quality of the method.
The lower the values of
2
(BOLD/Motion) the less
variance of the BOLD signal is explained by motion
so the better is the method.
In order to statistically compare the performance
of the methods tested here, a two-way mixed
ANOVA (one between-subjects and one within-
subjects factors) was performed. Prior to these
analyses, the requirements of the statistical tests
described next were verified. For the two
comparisons the between-subjects factor is “Group”,
which has two nominal unrelated or independent
categories: Multiple Sclerosis (MSC) and control
(CNT) participants. The within-subjects factors are
the “MPs” (number of motion parameters) and
“Correction Method” for the first and second
comparison respectively.
3 RESULTS
3.1 6 MPs vs 24 MPs
Group mean Z-max, Z-mean and
2
(BOLD/Motion)
values of the models with 6 MPs and 24 MPs are
represented in Table 1. As evidenced, the Z-max and
Z-mean values are systematically higher when using
6 MPs. No differences were found in the
2
( BOLD/Motion) values. The two-way mixed
ANOVA showed that the comparison between these
values concerning the main effect “MPs” was
statistically significant (p<0.05). The “Group” main
effect proved to be non-significant (p>0.05) for this
2
( BOLD/Motion) values. The two-way mixed
ANOVA showed that the comparison between these
values concerning the main effect “MPs” was
statistically significant (p<0.05). The “Group” main
effect proved to be non-significant (p>0.05) for this
comparison. There was also no statistically
significant interaction between “Group” and “MPs”
(p>0.05). Figure 2 shows the activation maps of one
participant when using 6 vs 24 MPs.
Table 1: Metrics to assess the quality of the models using 6
MPs and 24 MPs. Values are presented as mean ± standard
deviation in each group of participants.
Metrics
MPs Group Z-max Z-mean
2
(BOLD/Motion)
6
MSC
8.015
±
0.500
5.974
±
0.317
-0.012
±
0.000
CNT
7.094
±
1.050
5.631
±
0.300
-0.011
±
0.001
24
MSC
7.648
±
0.766
5.814
±
0.283
-0.012
±
0.000
CNT
6.875
±
1.264
5.536
±
0.365
-0.011
±
0.001
3.2 FD vs DVARS vs INTERP
Table 2 depicts group mean Z-max, Z-mean and
2
(BOLD/Motion) values of the models used to test
the different methods for correction of motion
outliers. Despite Z-max and Z-mean values are higher
for the interpolation method, the two-way mixed
ANOVA showed that the comparison between these
values was not statistically significant (p>0.05)
considering both “Correction Method” and “Group”
main effects. No statistically significant differences
were found to the
2
(BOLD/Motion) values. There
was also no statistically significant interaction
between “Group” and “Correction Method” (p>0.05).
BIOSIGNALS 2021 - 14th International Conference on Bio-inspired Systems and Signal Processing
310
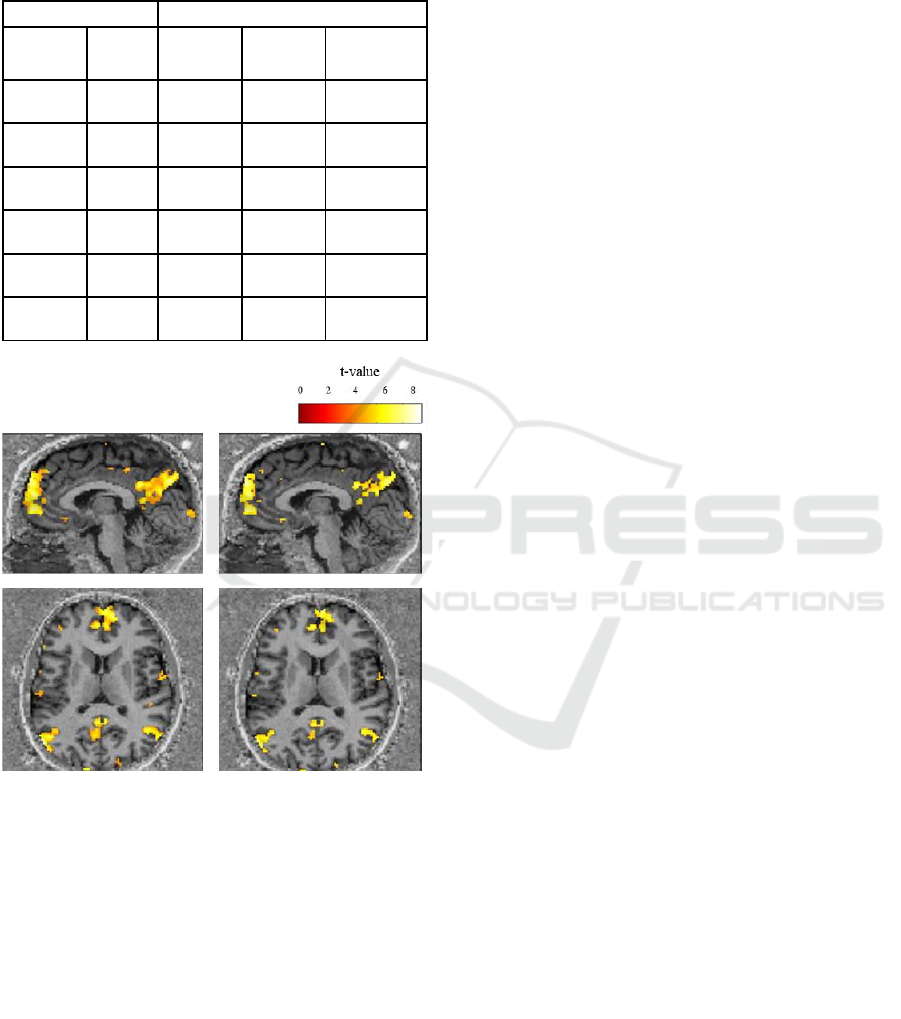
Table 2: Metrics to assess the quality of the models using
FD, DVARS and INTERP methods to correct motion
outliers’ effects. Values are present Values are presented as
mean ± standard deviation in each group of participants.
Metrics
Correction
Method
Group Z-max Z-mean
2
(
BOLD/
Motion)
FD MSC
8.015
± 0.496
5.971
± 0.311
-0.012
± 0.000
FD CNT
7.070
± 1.213
5.632
± 0.310
-0.011
± 0.001
DVARS MSC
8.015
± 0.500
5.974
± 0.317
-0.012
± 0.000
DVARS CNT
6.983
± 1.234
5.603
± 0.336
-0.005
± 0.017
INTERP MSC
8.035
± 0.505
6.022
± 0.321
-0.012
± 0.000
INTERP CNT
7.105
± 1.054
5.641
± 0.288
-0.006
± 0.011
Figure 2: Activation maps of one participant, resulting from
the contrast [global biological motion – scrambled motion].
On the left is represented an activation map resulting from
a model with 6 MPs. On the right is represented an
activation map resulting from a model with 24 MPs. The
model with 6 MPs (left side) shows that task-specific brain
regions are detected with higher sensitivity relatively to
using 24 MPs (right side). Results are presented at a voxel
p-value < 0.05, FWE corrected for multiple comparisons.
Color bar scale represents t-values. The t-value is the result
of the statistical test (t-test) in each voxel and measures the
size of the difference calculated between the BOLD signal
in the presence of biological motion stimulus and the
BOLD signal during the presence of scrambled motion
stimulus. The higher the t-value the most correlated is the
BOLD signal with the task condition or the specified
contrast in a given brain region, thus more sensitive is that
(group of) voxel(s).
4 DISCUSSION
Due to the lack of consensus on how to deal with the
head motion effects in fMRI data analysis, in this
study we compared different strategies to compensate
for head motion, in the context of a perceptual
decision task performance between MS patients and
controls. We started by testing if including temporal
derivatives of MPs would improve the results of our
analyses. Next, we compared three methods to correct
the effects of motion outliers. Two of them were
modelling approaches (censoring) based on two
different motion outliers detection algorithms: FD
and DVARS. The third strategy used was
interpolation of volumes affected by motion,
INTERP.
The first comparison, 6 vs 24 MPs, revealed that
higher Z-score values are obtained when considering
6 MPs, suggesting that task-specific brain regions are
detected with higher sensitivity relatively to using 24
MPs. This is further supported by the activation maps
resultant from both models. Head shifts are usually
corrected through regression of MPs, but there is still
no consensus regarding the optimal number of MPs
to include. Our results using just 6 MPs are consistent
with literature reporting that adding temporal
derivatives can result in loss of degrees of freedom
and therefore loss of valuable information. (Yang et
al. 2019).
Regarding the second comparison, the Z-max and
Z-mean values are higher for the interpolation
method. Although the two-way mixed ANOVA
showed that the comparison between the values
obtained with the different methods was not
statistically significant (p>0.05), we suggest the use
of the interpolation method. However, further studies
with more data are needed to reach a definite
conclusion about which method is best to correct the
effects of motion outliers. Furthermore, it is
important to discuss the impact of modelling motion
outliers and interpolation in the data.
Modelling motion outliers is a widely used
technique to correct sudden movements of the head,
however it creates temporal discontinuities.
Interpolation overcomes this problem and avoids side
effects in the high-pass filter (Michielsen et al. 2011).
However, volume interpolation induces synthetic
data, and the duration of the censored segment, as
well as the type of interpolation (linear, Fourier,
wavelets or splines), may produce different effects
that depend on the choice of these parameters
(Caballero-Gaudes and Reynolds 2017). To our
On the Optimal Strategy for Tackling Head Motion in fMRI Data
311

knowledge these effects and the negative impacts of
using interpolation are still largely unknown.
Although the two approaches are widely used, to our
knowledge there are no studies that contemplate the
question, with a direct comparison on the same data,
about which strategy is best to correct motion
outliers: modelling or interpolation. Because there are
no negative effects reported when using interpolation
and that it appears as an alternative to solve the data
loss caused by censoring, we further suggest that this
method may be the best one to adopt to mitigate the
effects of motion outliers. Nevertheless, we believe
further studies with a higher number of participants
will allow to derive conclusive results and to a greater
consensus on which strategy to use. Thus, our study
paves the way towards finding an optimal motion
correction strategy.
In both comparisons, the main effect of group and
also the interaction of correction approach with group
proved to be not significant, which means that there
are no differences provoked by head motion
correction effects between groups. So, the quality of
head motion correction is mainly due to the method.
This is an important issue to consider in fMRI studies
in clinical context, as previous reports show group
differences in head motion between control and
patient groups (Seto et al. 2001). This is particularly
relevant in task-related and resting-state (RS)
functional connectivity fMRI studies, which are
rapidly increasing in clinical research (Goto et al.
2016). Previous studies show that group differences
in head motion between control and patient groups
cause group differences in the resting-state network
with RS-fMRI (Lee, Smyser, and Shimony 2014;
Song et al. 2012; Maknojia et al. 2019). To our
knowledge there is a lack of this kind of studies in the
MS context. Furthermore, our study raises the
importance of this processing step in functional
connectivity studies, where one wants to study
functionally connected networks throughout the brain
that are correlated only due to the stimulation or
cognitive processing, in task-based fMRI, or due their
intrinsic functional organization, not because of head
motion.
We decided to compare these approaches,
however there are other techniques that can be
implemented. External optical tracking systems that
constantly measure the position of the head or the use
of dedicated sequences with navigators echoes or
active markers (Maknojia et al. 2019; Caballero-
Gaudes and Reynolds 2017) are such examples. Data
driven approaches can also be used, namely
algorithms such as Principal Component Analysis
(PCA) or Independent Components Analysis (ICA),
which first decompose the data into a set of
components, then the corrected fMRI data is obtained
by removing the contribution of motion-related
components (Caballero-Gaudes and Reynolds 2017;
Liu 2016). Yet, we focused on study the number of
MPs that would better characterize the head shifts to
be regressed out from fMRI data and on comparing
modelling vs interpolation methods to tackle the
motion outliers’ effects since these are the most used
in the literature, and as such, are of greater relevance.
5 CONCLUSIONS
In this paper, we aimed at applying different
techniques to tackle head motion in fMRI data in
order to reach a consensus on the best strategies to
use. We compared common approaches to correct
head motion effects such as motion regression,
motion censoring and data interpolation. Our results
pave the way towards finding an optimal motion
correction strategy, which is required to improve the
accuracy of fMRI analyses, crucially in clinical
studies with patient populations, and are an
encouragement to test comprehensively different
approaches.
ACKNOWLEDGEMENTS
This work was supported by Grants Funded by
Fundação para a Ciência e Tecnologia, CIBIT
strategic plan UIDP/04950/2020 and BIOMUSCLE
PTDC/MEC-NEU/31973/2017. FCT also funded an
individual grant to JVD (Individual Scientific
Employment Stimulus 2017 -
CEECIND/00581/2017).
REFERENCES
Abreu, Rodolfo. 2017. “Study of the Spatiotemporal
Dynamics of Epileptic Activity Using Simultaneous
EEG-FMRI : Towards Clinical Applications.”
Caballero-Gaudes, César, and Richard C Reynolds. 2017.
“NeuroImage Methods for Cleaning the BOLD FMRI
Signal.” NeuroImage 154 (December 2016): 128–49.
https://doi.org/10.1016/j.neuroimage.2016.12.018.
Goto, Masami, Osamu Abe, Tosiaki Miyati, Hidenori
Yamasue, Tsutomu Gomi, and Tohoru Takeda. 2016.
“Head Motion and Correction Methods in Resting-State
Functional MRI.” Magnetic Resonance in Medical
BIOSIGNALS 2021 - 14th International Conference on Bio-inspired Systems and Signal Processing
312

Sciences 15 (2): 178–86. https://doi.org/10.2463/
mrms.rev.2015-0060.
Kasper, Lars, Steffen Bollmann, Andreea O Diaconescu,
Chloe Hutton, Jakob Heinzle, Sandra Iglesias, Tobias U
Hauser, et al. 2017. “The PhysIO Toolbox for Modeling
Physiological Noise in FMRI Data.” Journal of
Neuroscience Methods 276: 56–72. https://doi.org/
10.1016/j.jneumeth.2016.10.019.
Lee, Megan H, Christopher D Smyser, and Joshua S
Shimony. 2014. “Resting State FMRI: A Review of
Methods and Clinical Applications.” AJNR Am J
Neuroradiol 34 (10): 1866–72. https://doi.org/10.31
74/ajnr.A3263.Resting.
Liu, Thomas T. 2016. “NeuroImage Noise Contributions to
the FMRI Signal : An Overview.” NeuroImage 143:
141–51. https://doi.org/10.1016/j.neuroimage.2016
.09.008.
Maknojia, Sanam, Nathan W Churchill, Tom A Schweizer,
and S J Graham. 2019. “Resting State FMRI : Going
Through the Motions.” Frontiers in Neurology 13
(August): 1–13. https://doi.org/10.3389/fnins.
2019.00825.
Mazaika, Paul K, Fumiko Hoeft, Gary H Glover, and Allan
L Reiss. 2009. “Methods and Software for FMRI
Analysis for Clinical Subjects.”
Mckechanie, Andrew G, Sonya Campbell, Sarah E A Eley,
and Andrew C Stanfield. 2019. “Autism in Fragile X
Syndrome ; A Functional MRI Study of Facial
Emotion-Processing.” Genes.
Michielsen, Marian E, Ruud W Selles, Jos N Van Der
Geest, Martine Eckhardt, Gunes Yavuzer, Henk J Stam,
Marion Smits, Gerard M Ribbers, and Johannes B J
Bussmann. 2011. “Motor Recovery and Cortical
Reorganization After Mirror Therapy in Chronic Stroke
Patients : A Phase II Randomized Controlled Trial.”
Neurorehabilitation and Neural Repair 25 (3): 223–33.
https://doi.org/10.1177/1545968310385127.
Montgomery, Douglas C., Elizabeth A. Peck, and G.
Geoffrey Vining. 2012. Introduction to Linear
Regression Analysis. John Wiley & Sons, Ltd.
Parkes, Linden, Ben Fulcher, Murat Yücel, and Alex
Fornito. 2018. “NeuroImage An Evaluation of the Ef Fi
Cacy , Reliability , and Sensitivity of Motion
Correction Strategies for Resting-State Functional
MRI.” NeuroImage 171 (December 2017): 415–36.
https://doi.org/10.1016/j.neuroimage.2017.12.073.
Pernet, Cyril R. 2014. “Misconceptions in the Use of the
General Linear Model Applied to Functional MRI: A
Tutorial for Junior Neuro-Imagers.” Frontiers in
Neuroscience 8 (1): 1–12. https://doi.org/
10.3389/fnins.2014.00001.
Power, Jonathan D, Kelly A Barnes, Abraham Z Snyder,
Bradley L Schlaggar, and Steven E Petersen. 2013.
“Spurious but Systematic Correlations in Functional
Connectivity MRI Networks Arise from Subject
Motion.” NeuroImage 59 (3): 2142–54. https://doi
.org/10.1016/j.neuroimage.2011.10.018.Spurious.
Power, Jonathan D, Anish Mitra, Timothy O Laumann,
Abraham Z Snyder, Bradley L Schlaggar, and Steven E
Petersen. 2014. “NeuroImage Methods to Detect ,
Characterize , and Remove Motion Artifact in Resting
State FMRI.” NeuroImage 84: 320–41. https://
doi.org/10.1016/j.neuroimage.2013.08.048.
Rudas, Jorge, Darwin Martı, Gabriel Castellanos, Athena
Demertzi, Charlotte Martial, and Manon Carrie. 2020.
“Time-Delay Latency of Resting-State Blood Oxygen
Level-Dependent Signal Related to the Level of
Consciousness in Patients with Severe Consciousness
Impairment.” Brain Connectivity 10 (2): 83–94.
https://doi.org/10.1089/brain.2019.0716.
Seto, E, G Sela, W E Mcilroy, S E Black, W R Staines, and
M J Bronskill. 2001. “Quantifying Head Motion
Associated with Motor Tasks Used in FMRI.”
NeuroImage 297: 284–97. https://doi.org/1
0.1006/nimg.2001.0829.
Siegel, Joshua S, Jonathan D Power, Joseph W Dubis,
Alecia C Vogel, Jessica A Church, Bradley L
Schlaggar, and Steven E Petersen. 2014. “Statistical
Improvements in Functional Magnetic Resonance
Imaging Analyses Produced by Censoring High-
Motion Data Points.” Human Brain Mapping, no. 35:
1981–96. https://doi.org/10.1002/hbm.22307.
Song, Jie, Alok S. Desphande, Timothy B. Meier, Dana L.
Tudorascu, Svyatoslav Vergun, Veena A. Nair, Bharat
B. Biswal, et al. 2012. “Age-Related Differences in
Test-Retest Reliability in Resting-State Brain
Functional Connectivity.” PLoS ONE 7 (12): 1–16.
https://doi.org/10.1371/journal.pone.0049847.
Thompson, A. J, B. L Banwell, F Barkhof, and et.al. 2018.
“Diagnosis of Multiple Sclerosis: Revision of the
McDonald Criteria 2017.” The Lancet Neurology 17 (2):
162–73. https://doi.org/10.1007/s00115-018-0550-0.
Yang, Zhengshi, Xiaowei Zhuang, Karthik Sreenivasan,
and Virendra Mishra. 2019. “Robust Motion
Regression of Resting-State Data Using a
Convolutional Neural Network Model.” Frontiers in
Neuroscience 13 (February): 1–14. https://doi.org
/10.3389/fnins.2019.00169.
On the Optimal Strategy for Tackling Head Motion in fMRI Data
313
