
Boundary Burr Phenomenon for Long-path Time Domain OCT
Tatsuo Shiina
a
Graduate School of Engineering, Chiba University, 1-33 Yayoi-cho, Inage-ku, Chiba-shi, Chiba 263-8522, Japan
Keywords: OCT, Long Path, Boundary, Diffraction.
Abstract: Long-path OCT measurement system has been developed for industrial use. We aim to measure time change
of the concentration and refractive index of the target solution with a certain volume. As the fundamental
experiment, we put the glass plate in the solution to obtain the glass position and its thickness, and got the
interesting result. That is, the vibration mitigating waveform like a diffraction pattern by a knife-edge was
observed. The OCT measurement consists of inline signals from the back-reflected (scattered) light, the
diffraction pattern by a knife-edge is appeared on a screen. Although this phenomenon causes the boundary
burr on the target detection, while the diffraction pattern has the information of the refractive index difference
of the target. In this study, the characteristics of the boundary burr phenomenon is examined. Its origin is
considered experimentally and analytically.
1 INTRODUCTION
The optical coherence tomography: OCT technology
is the low coherent interferometer and it obtains the
cross-sectional image by non-invasive and non-
destructive measurement. It is invented by Tanno and
Fujimoto (Tanno N., 1990 and Huang D., 1991)
Mainly it is developed for ophthalmology (Danielson
1991, Brezinski, 1999) After that, it is adapted to the
industrial use.(Song 2012) The combination of super
luminescent diode: SLD and optical fiber
interferometer adds the flexibility of measurement to
the device and also compactness.
In this study, a portable OCT scanner has been
developed for industrial use.(Shiina T., 2003, 2009,
2014, Yoshizawa T., 2015, Saeki K., 2020) The long
path TD-OCT was aimed to measure the refractive
index difference due to the solution condition such as
temperature and density change or convective flow.
The system has a measurement range of up to 100mm
with 5-digit accuracy. And the target is not a drop of
liquid, but a certain volume of the solution to catch
the partial change in a volume and its temporal
change. Long optical path measurement leads the
sensitive detection to enlarge the small difference.
Recently, we conducted the fundamental
experiment to evaluate the refractive index change
due to the solution temperature (Shiina T. 2019) and
a
https://orcid.org/0000-0001-9292-4523
the aqueous solution of the ethanol was examined too
with the unique characteristics of its refractive index
variation. To expand the measurement to the
concentration change and erratic distribution of
solution, as an initial approach, a glass plate was
inserted into a pure water to obtain the glass position
and its thickness. There, the interesting result was
observed, that is, the vibration mitigating waveform
like a diffraction pattern by a knife-edge was
observed. The OCT measurement consists of inline
signals from the back-reflected (scattered) light,
while the diffraction pattern by a knife-edge is
appeared on a screen. This phenomenon causes the
boundary burr on the target detection, while the
diffraction pattern has the information of the
refractive index difference of the target. We shift the
experiment to more simple arrangement to examine
this unique phenomenon. With the actual knife-edge
diffraction conditions, we discussed the boundary
burr phenomenon of the OCT signal. The numerical
analysis approach was started, too.
In this report, the characteristics of the boundary
burr phenomenon is examined and analyzed. Its
origin is considered experimentally and analytically.
The influence and benefit of this boundary burr
phenomenon was discussed, too.
Shiina, T.
Boundary Burr Phenomenon for Long-path Time Domain OCT.
DOI: 10.5220/0010327201150121
In Proceedings of the 9th International Conference on Photonics, Optics and Laser Technology (PHOTOPTICS 2021), pages 115-121
ISBN: 978-989-758-492-3
Copyright
c
2021 by SCITEPRESS – Science and Technology Publications, Lda. All rights reserved
115
2 LONG-PATH TD-OCT SYSTEM
The time-domain OCT is classical and scanning
speed is lower than the current trend Spectral Domain
OCT, but it has a simple structure and linear signal
magnification, and higher flexibility of optical probe
design independent to the other OCT specification
such as scan speed, wavelength and scanning range.
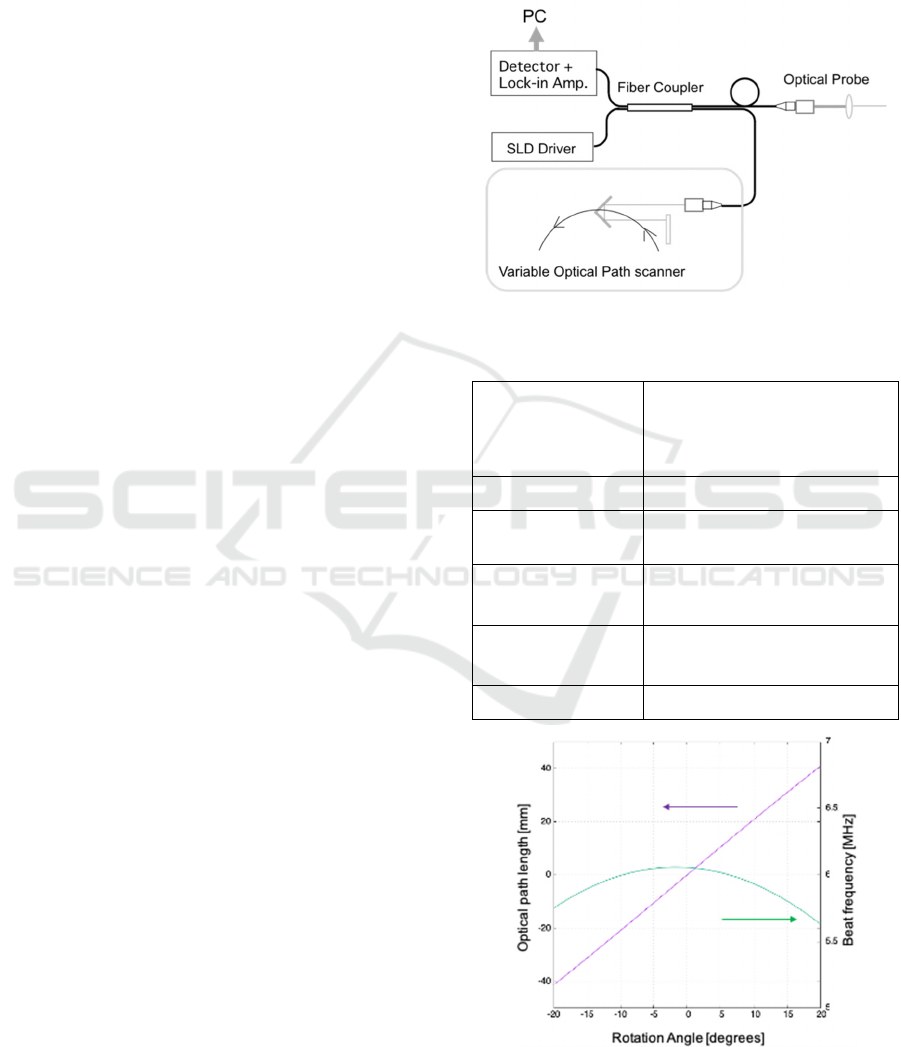
The optical setup of the long path TD-OCT is
illustrated in Fig.1. The SLD (Super Luminescent
Diode) light source of 800nm-band is installed into
the long path TD-OCT. The cylindrical can-package
designed original SLD has been developed for our
industrial OCT. Peltier device for cooler was
excluded in this SLD device to keep the cheaper cost.
Even without a cooler, its optical intensity and
operation are stable for industrial use. It is produced
by Anritsu Co, Ltd. The interference signal is
detected as the Gaussian envelope through the
specialized amplifier and filter circuit.
The long path TD-OCT utilizes the rotational
optical path change mechanism. (Shiina, 2002) This
scanning mechanism consists of a rotating corner
reflector and a fixed mirror. The rotation radius and
its speed decide the measurement range and scan rate,
respectively. The fixed mirror reflects the thrown
beam to the same path. The optical path change
becomes approximately linear motion. The distortion
is about 1 – 2% within the rotation angle of +/-20
degrees. It causes the beat frequency change, too, as
shown in Fig.2. The long-path OCT has a rotation
disk of 60mm radius, of which maximum
measurement range reaches 100mm. Here it is
restricted to 80mm by the reflector size. The rotation
speed is 200rpm. A servo motor is installed to
stabilize the rotation. The rotation disk has a ballast
weight to keep a valanced rotation. Even that, the
rotation sometimes fluctuates slightly as a rotation
jitter due to the timing of the excitation control. The
interference signal was examined via a PC automatic
measurement program. Such a fluctuated signal was
trimmed away and took an average to minimize the
standard deviation by the program. As a result, the
total error restricted within 1μm.
In the last time, the OCT measurement probe was
set to enter the small tank within the measurement
range. The interference signals of the small tank were
obtained at four positions from its glass walls (each
side of the walls). The refractive index was calculated
by the optical path length between the inner water
sides of the small tank walls. The temperature was
controlled to observe the change of refractive index
and estimate the concentration of the solution.
The boundary burr could be observed when the
additional glass plate inserted into the tank solution.
This time, the experimental condition was simplified
to make the boundary burr phenomenon clear
compared with the usual knife-edge pattern.
Figure 1: Structure of long path TD-OCT.
Table 1: Specification of long-path TD-OCT system.
SLD
Anritsu AS8E210GP30M
Center wavelength 830nm
Spectral Half Width 15nm
Optical Output Power 1.2mW
Fiber Assembly 2 x 2 coupler with Collimator
Scanning
Mechanism
DC Servo motor with
(Chiba Motor)
Rotation Disk Diameter 120mmf
Rotation Speed 200 rpm
Resolution 7μm for layer recognition
1μm for positioning accuracy
Scanning Range 100mm with +/- 20 degrees
Figure 2: Optical path length and beat frequency with
optical scanning mechanism at 200rpm.
PHOTOPTICS 2021 - 9th International Conference on Photonics, Optics and Laser Technology
116
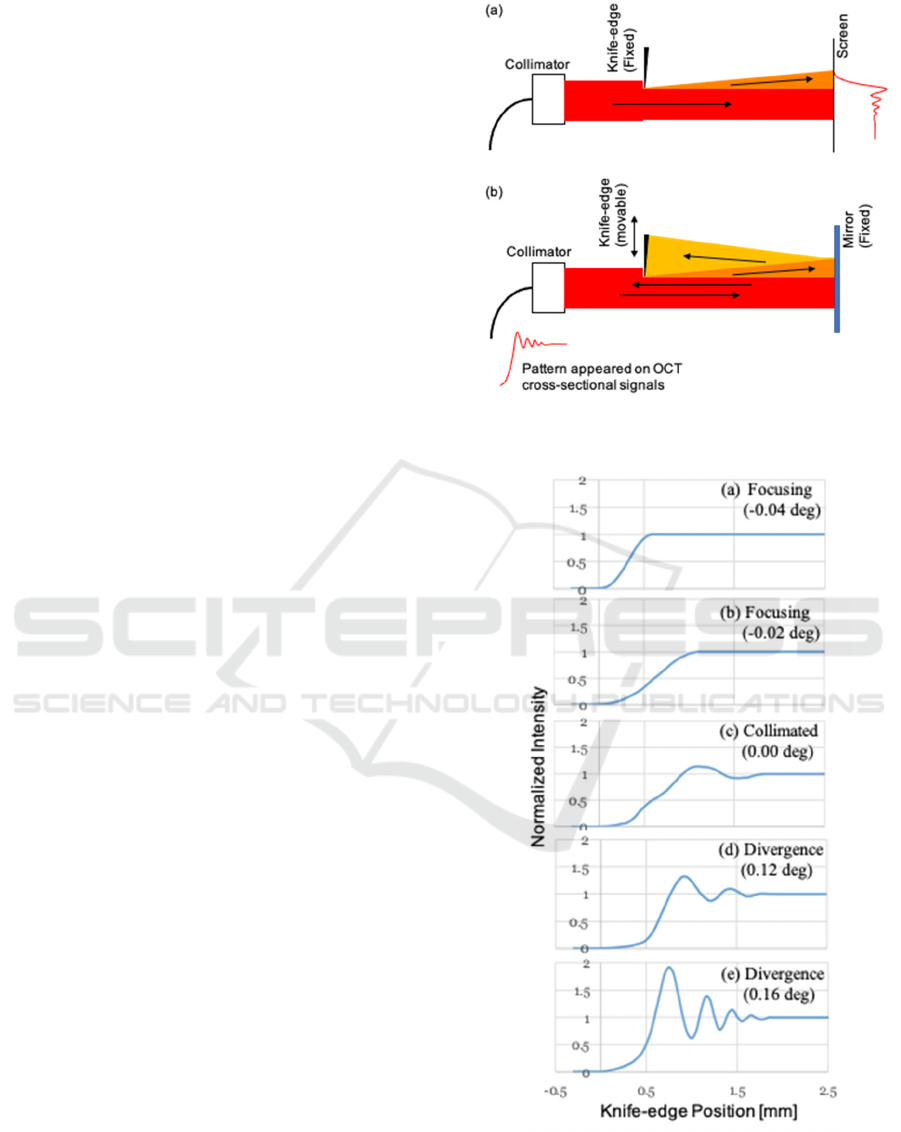
3 EXPERIMENT
To make this boundary burr phenomenon clear, the
water tank was removed and put the knife-edge, for
which was substituted a movable thin mirror, and the
fixed mirror plate to return the light to the probe. The
experimental setup is shown in Fig. 3. Figure 3(a) is
the usual setup to observe the knife-edge diffraction
and Figure 3(b) is this experimental setup to observe
the boundary burr phenomenon with the OCT probe.
In the usual knife-edge observation, the knife-edge is
fixed and the diffraction pattern is appeared on the
screen, which is set after the knife-edge. The distance
between the knife-edge and the screen decide the
diffraction pattern enlargement. On contrary, the
OCT measurement is a point measurement and it
catches the back reflected light. The collimator is
utilized as a transmitting and receiving aperture. To
obtain the pattern, the knife-edge changes its position
by crossing the OCT beam.
The divergence of the optical probe beam was
controlled with the adjustable collimator. The
divergence was adjusted from focusing condition to
spreading condition. The measurement was
conducted by shifting the knife-edge mirror to be
crossed the beam orthogonally. At each knife-edge
mirror position, the OCT interference signal returned
from the fixed mirror was stored. The diffraction like
vibration mitigating waveform will be appeared in the
cross-sectional graph. In the experiment, the direction
crossing the beam was changed appropriately. The
knife-edge position was changed during the optical
probe collimator and the fixed mirror, too.
Figure 4 shows cross-sectional waveforms at each
beam divergence. The horizontal axis was started
with fully covered with the knife-edge mirror as
initial position of “0” and when the knife-edge mirror
was shifted fully from the beam, the intensity
becomes constant as the right side of the graph. The
interference intensity was normalized with the
constant intensity.
It is clear that the boundary burr waveforms ware
appeared at the beam spreading conditions. The beam
focusing condition of Fig. 4(a)-(c), the propagating
beam size should be smaller at the fixed mirror
position, and the waveform was rising up earlier when
the beam focusing becomes stronger. The beam
divergence condition of Fig. 4(c)-(e), the vibration is
getting stronger due to the beam divergence. Their
rising up is getting earlier due to the divergence, too.
In general, the distance between the knife-edge and
the fixed mirror is constant, and the diffraction pattern
of knife-edge never change its rising up condition at
any crossing position of the knife-edge on the beam
.
Figure 3: Experimental setup for boundary burr observation
with long-path OCT.
Figure 4: Observation Results due to the beam divergence.
As the rising up is getting earlier, the vibration
was getting higher, while the vibration period is
Boundary Burr Phenomenon for Long-path Time Domain OCT
117
getting shorter. This feature is different from the
diffraction pattern of knife-edge.
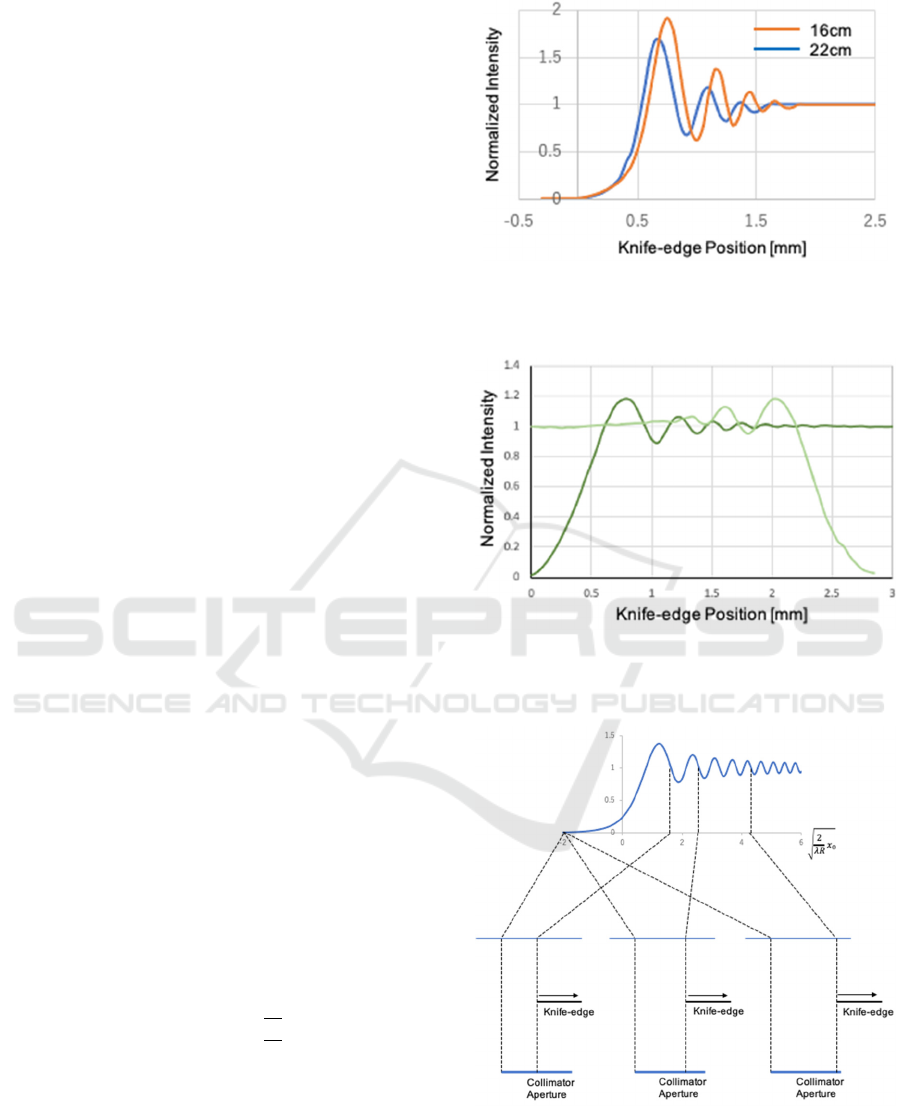
Figure 5 shows the pattern difference due to the
distance between the knife-edge and the collimator.
The beam divergence is 0.16 degrees. This result has
the same feature with the diffraction pattern of knife-
edge, that is, the distance is getting longer, the pattern
is enlarged and the peak intensities of the vibration is
smaller. The vibration period is followed with the
same manner, too.
For check, the pattern observation was conducted
with both of left and right side scan of the knife-edge.
The result is shown in Fig. 6. The beam divergence
was 0.16 degrees. It is natural that both of the
boundary burr patterns are same vibration, while we
can discuss the beam size. It will burr the boundary of
the target. It will be important to distinguish the time
variation of the refractive index and concentration.
How this boundary burr phenomenon will occur?
We considered the experimental condition with the
long-path TD-OCT. Off course, it is particular
condition on long-path OCT. Beam divergence will
be effective on the longer optical path when it is
detected on the inline collimator aperture. When the
knife-edge will start from the covered position, the
interference intensity rises up due to the uncovered
area of the collimator aperture. Then the diffraction
pattern is reflected at the fixed mirror and goes back
to the collimator. At that time, as the first peak area
occupies on the collimator aperture as shown in
Fig. 7(i), the interference intensity rises up at
maximum. The diffraction pattern of knife-edge
repeats the vibration peaks equally plus and minus
against the average intensity. When the knife-edge
position gradually uncovers the collimator aperture
area like fig. 7(ii), the interference intensity generated
by the reflected beam just passed through the
uncovered area will causes the vibration, too. When
the number of the peaks increases, the interference
intensity reaches to the average, that is, settle down to
the constant (Fig. 7(iii)). The distance R between the
knife-edge and the collimator via the fixed mirror,
wavelength 𝜆 and the adequate knife-edge position 𝑥
to cover the collimator aperture, that is, forming the
non-unit diffraction parameter
𝑥
will decide the
boundary burr phenomenon. The long-path OCT had
such parameters balance and observed those patterns.
Figure 5: Pattern variation due to the distance between the
knife-edge and the fixed mirror. The beam divergence is
0.16 degrees.
Figure 6: Left and right sides boundary burr patterns. The
distance between the knife-edge and the collimator was
22cm.
Figure 7: Principle of boundary burr phenomenon on long-
path OCT observation.
(i)
(ii)
(iii)
PHOTOPTICS 2021 - 9th International Conference on Photonics, Optics and Laser Technology
118
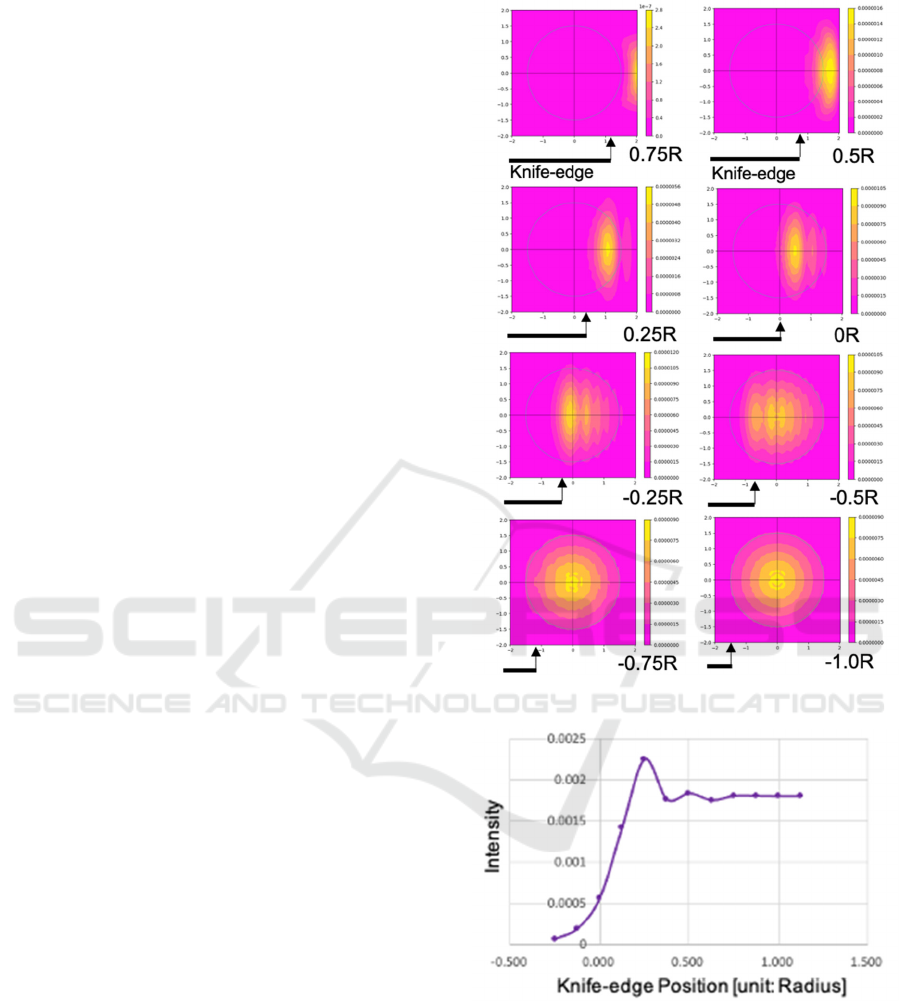
4 SIMULATION
To make this boundary burr phenomenon clear, we
conducted the numerical simulation. The
experimental condition is considered in the
simulation, for example, wavelength, knife-edge
setup, propagation distance, aperture size, etc. The
diffracted beam propagates to a certain distance. This
diffracting intensity distribution is visualized. We set
the orbicular beam and the orbicular collimator
aperture, and calculate the 2 dimensional intensity
distribution. The Gaussian distribution was used in
the calculation. Larger the intensity to renter into the
aperture is, Stronger the interreference intensity is.
The parameters are propagation distance between the
knife-edge and the collimator via the fixed mirror.
The core size of the optical fiber was considered with
the focal length of the collimator lens, too.
The intensity distribution at variation of the knife-
edge position is shown in Fig.8. Each image indicates
4𝜇𝑚 × 4𝜇𝑚 cross sectional area at the focal point of
the collimator. The center circle indicates the core
area, which estimates the intensity passed through the
core. The back arrow with a line represents the
shadow of the knife-edge, that is, the knife-edge
inserted from the left side. Its position is shown in the
unit of radius R. The distance between the knife-edge
and the collimator via the fixed mirror was adjusted
to reflect the experimental condition.
When the knife-edge is placed at the position of
0.5R, where 3/4 area was covered. Although 1/4 of
the aperture area is still remained, the intensity will
not rise up. The peak intensity is clear, while it shifts
outside from the knife-edge position. From the knife-
edge position of 0.25R, the returned beam could pass
through the collimator. When the knife-edge position
of -0.25R, the vibration of intensity was started.
Figure 9 shows the intensity distribution due to the
knife-edge position. The same boundary burr pattern
can be simulated, while the concrete matching is not
discussed with intensity ratio and knife-edge
positions. Nevertheless, the feature of the pattern
reflects the phenomenon. The intensity rises up when
the reflected beam passes through more than 1/4 area
of the aperture. The intensity peak was obtained at
0.25R, where the peak intensity in the distribution
reach at the center. After that, the small vibration still
remained but soon settle down to the average. The
rising up period is matched with the experimental
result. The vibration period looks similar to the
experiment, but the second peak is small. The pattern
variation was discussed with the change of beam
divergence and the combination of the collimator lens
focal length and the core size of the optical fiber.
Figure 8: Intensity distributions at each knife-edge position.
Figure 9: Intensity distribution of simulated result.
5 DISCUSSIONS
As the result of this experiment, for sensing purpose,
when the target in the media tank will be detected, its
size and boundary will be burr with this experimental
condition. Such situation is depicted in Fig. 10(a). In
such a case, the beam can be focused to avoid the
Boundary Burr Phenomenon for Long-path Time Domain OCT
119
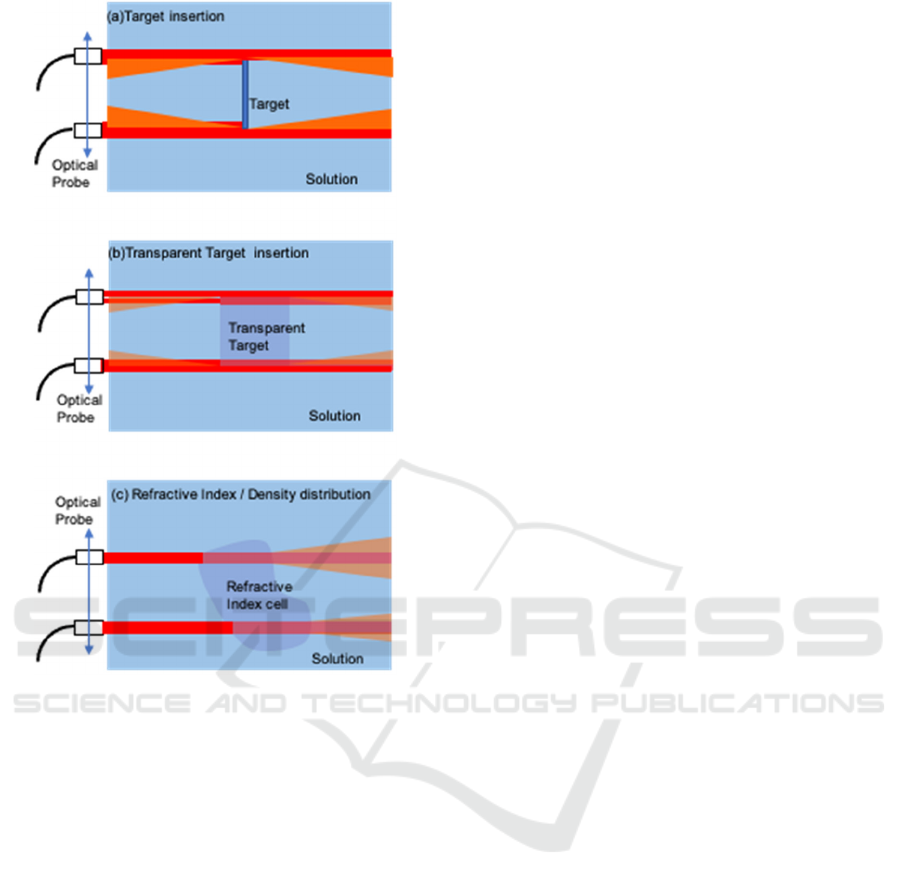
Figure 10: Step up procedure of the experiment.
boundary burr phenomenon. The focused beam,
however, change the resolution, especially it should
be careful in the long-path measurement. The
boundary burr phenomenon is not only observed at
the fixed mirror, but also at the target reflected signal
itself. It is caused by the propagation of the target
reflected signal to the collimator. It is observed at the
experimental result (Shiina, 2020).
The boundary burr pattern has the information of
the optical property conditions such as refractive
index, target hitting angle, at so on. The known
material target is inserted into the solution to reveal
the phenomenon about the combination of target
material and the solution as shown in Fig.10(b). The
refractive index of the target will change the
diffraction condition. It is helpful to tie up with the
numerical analysis with the theory.
The goal of this project is to visualize the
distribution of the refractive index and concentration
of the target solution as shown in Fig.10(c). They
change due to the temperature and chemical reaction.
The boundary burr pattern reflects them. The
sensitivity and resolution is quite high, and this
system can catch the small difference of the ignition
of change such as freezing reaction and convective
flow, and so on.
6 CONCLUSIONS
In this report, we have developed the long-path TD-
OCT with the positioning accuracy of 1μm and
measurement range of >80mm. With this
experimental set up, the vibration mitigating
waveform like a diffraction pattern by a knife-edge
was observed. The boundary burr phenomenon is
caused by the propagation of the diffraction pattern.
It is proved experimentally and analytically.
The goal of this project is to visualize the
distribution of the refractive index and concentration
of the target solution. Now the experiment shifts to
the next step, that is, the target is inserted into the
solution to obtain its distribution with the information
of refractive index, position and concentration change
due to the temperature and chemical reaction.
REFERENCES
Brezinski M. E. and Fujimoto J. G., 1999, “Optical
Coherence Tomography: High-Resolution Imaging in
Nontransparent Tissue”, IEEE J. Quant. Electron.,
Vol. 5, No. 4, pp.1185-1192.
Danielson B. L. and Boisrobert C. Y. 1991, “Absolute
optical ranging using low coherence interferometry”,
App. Opt. Vol. 30, No.21 pp.2975-2979.
Harvey A. H., Gallagher J. S., and J. M. H. L.,
1998, ”Revised Formulation for the Refractive Index
of Water and Steam as a Function of Wavelength,
Temperature and Density”, J. Phys. Chem. Ref. Data,
Vol.27, pp.761-774.
Huang D., Swanson E. A., Lin C. P., Schuman J. S., Stinson
W. G., Chang W., Hee M. R., Flotte T., Gregory K.,
Puliafito C. A., J. G. Fujimoto, 1991, “Optical
Coherence Tomography”, Science, Vol. 254,
pp.1178- 1181.
Saeki K., Huyan D., Sawada M., Sun Y., Nakamura A.,
Kimura M., Kubota S., Uno K., Ohnuma K., and
Shiina T., 2020, “Measurement algorithm for real
front and back curved surfaces of contact lenses”,
Applied Optics, Vol. 59, No. 28, pp.9051-9059.
Shiina T., Moritani Y ., Ito M., and Okamura Y ., 2003,
"Long optical path scanning mechanism for optical
coherence tomography", Applied Optics, Vol.42, No.
19, pp.3795-3799.
Shiina T., Miyazaki H., and Honda T., 2009, “Factory built-
in type simplified OCT system for industrial
PHOTOPTICS 2021 - 9th International Conference on Photonics, Optics and Laser Technology
120

application”, IEEJ C、Vol.129, No.7, pp.1276-1281,
(Japanese)
Shiina T., 2014, “Optical Coherence Tomography for
industrial application” Handbook of Optical
Metrology 2
nd
Edition, CRC Press, Chapter 30,
pp.769 – 790.
Shiina T. 2019, “Solution Concentration and Temperature
Measurements by Long-path Optical Coherence
Tomography”, Photoptics 2020, 20-RP-33.
Song G. and Harding K G, 2012, “OCT for industrial
applications”, Proc. Of SPIE, 8536.
Tanno N. 1990, Japanese Patent 2010042.
Yoshizawa t. Eds, 2015, Handbook of optical metrology:
principles and applications, second edition, CRC
Press.
Boundary Burr Phenomenon for Long-path Time Domain OCT
121
