
Quantitative Analysis of Skin using Diffuse Reflectance for Non-invasive
Pigments Detection
Shiwei Li
1 a
, Mohsen Ardabilian
1 b
and Abdelmalek Zine
2 c
1
Ecole Centrale de Lyon, LIRIS CNRS, France
2
Ecole Centrale de Lyon, ICJ CNRS, France
Keywords:
Artificial Neural Networks, Biomedical Engineering, Bioinformatics, Biomedical Signal Processing.
Abstract:
Skin diagnosis has become a significant part of research topics in biomedical engineering and informatics,
since many conditions or symptoms of diseases, such as melanoma and jaundice, are indicated by skin appear-
ance. In the past, an invasive method (i.e. Biopsy) is widely used for pathological diagnosis by removing a
small amount of living tissue. Recently, non-invasive methods have been studied based on diffuse reflectance
for detecting skin inner information. With the development of machine learning techniques, non-invasive
methods can be further improved in many aspects, such as the speed and accuracy. Our research focuses on
analyzing and improving non-invasive skin pigments detection using neural networks. The relation between
skin pigments content and skin diffuse reflectance has been studied. Moreover, the computational time has
been accelerated significantly after using the inverse mapping neural network instead of the forward mapping
one. The results show that our proposed method can obtain favorable results in estimating melanin content,
blood content, and oxygen saturation from synthetic skin diffuse reflectance for all lightly, moderately, and
darkly pigmented skin types compared to Monte Carlo simulations. And it turns out that our method works
well when using a measured skin reflectance database from National Institute of Standards and Technology
for the second validation.
1 INTRODUCTION
Skin, one of the most important human body or-
gans, protects us from external invasion, keeps us
warm, and regulates the balance of water. Skin
health has become a significant issue. For exam-
ple, there have been many computer vision-based
tasks which focus on analyzing different facial fea-
tures (Leo et al., 2020). Some diseases reflect the
abnormal content of the pigment inside the skin, for
instance, melanoma is caused by a large amount of
melanin produced by exposure to sunlight. To give an
intuitive and quantitative expression, evaluating pig-
ments content is required. Traditional method for
pigments detection is examined under a microscope
or analyzed based on a series of chemical processes
by taking a small skin sample from the individuals,
and is called biopsy (Zerbino, 1994). As skin ap-
pearance can be affected by many pigments, such
as melanin, hemoglobin, etc., researchers found that
a
https://orcid.org/0000-0002-8765-9283
b
https://orcid.org/0000-0002-1842-0404
c
https://orcid.org/0000-0002-0353-8995
light waves can penetrate the skin, and the outgoing
wave (also called diffuse reflectance) which is scat-
tered back, carries the inner information. In the past
two decades, the non-invasive detection of pigments
deposited inside the skin has progressed based on
skin diffuse reflectance. Combined with skin mod-
els, light-skin interaction approaches are applied to
analyze skin diffuse reflectance monitored by diffuse
reflectance spectroscopy (DRS) instruments and ob-
tain the pigments content. These light-skin interac-
tion approaches describe how light transports inside
the tissue, and derive diffuse reflectance based on
the optical parameters of skin models, which gener-
ally are formed as a function of volume fractions of
skin pigments. With the development of DRS tech-
niques and hyper-spectral sensors, the acquisition of
diffuse reflectance with high resolution (usually 1-20
nm) becomes easier and cost-effective. These tech-
niques have been applied to diagnose skin diseases,
etc. (Mazzoli et al., 2010; Mehr
¨
ubeo
˘
glu et al., 2002;
Salomatina et al., 2006; Wallace et al., 2000).
Light-skin interaction approaches have been stud-
ied and improved over the past four decades, such
as diffuse approximation (DA), kubelka-munk theory,
604
Li, S., Ardabilian, M. and Zine, A.
Quantitative Analysis of Skin using Diffuse Reflectance for Non-invasive Pigments Detection.
DOI: 10.5220/0010326806040614
In Proceedings of the 16th International Joint Conference on Computer Vision, Imaging and Computer Graphics Theory and Applications (VISIGRAPP 2021) - Volume 4: VISAPP, pages
604-614
ISBN: 978-989-758-488-6
Copyright
c
2021 by SCITEPRESS – Science and Technology Publications, Lda. All rights reserved

and Monte Carlo simulations (MC) (Sharma et al.,
2014; Zonios et al., 2008; Vyas et al., 2013; Ishi-
maru, 1978). Besides, machine learning methods
have also been applied more commonly to map dif-
fuse reflectance and skin physiological parameters
(Zhang et al., 2010; Chen et al., 2016). Among these
approaches, MC is mostly used to validate other ap-
proaches as the first verification because it simulates
the movement of energy packets that obey radiative
transport rules and has a good fitting performance
with the measured data (Jacques, 1996). Fredriksson,
Larsson, and Strmberg presented a 3-layered analy-
sis model based on MC which is able to estimate mi-
cro circulatory parameters (Fredriksson et al., 2012).
Sharma et al. proposed a 2-layered lookup table
based on MC, which is generalized to be used for a
wide variety of probe-geometries with the error of ab-
sorption properties varying from 12 to 25% (Sharma
et al., 2014). Nonetheless, MC accelerated by GPU
(Alerstam et al., 2008) needs around a day to run the
curve-fitting process for only one hyper-spectral dif-
fuse reflectance. With this in mind, it is inefficient
when processing amounts of diffuse reflectance spec-
tra data and cannot satisfy the demand to extract skin
physiological parameters rapidly. DA is known to
be a second-order differential equation that gives ap-
proximate solutions of the Boltzmann transport equa-
tion on the basis of spherical harmonics. Spott and
Svaasand focused on collimated light sources in tur-
bid media and proposed a hybrid approach by refining
the source terms or increasing the approximation or-
der in DA (Spott and Svaasand, 2000). Nagli et al.
tested the suitability of DA for fitting the diffuse re-
flectance spectra and extracting bio-parameters from
human skin in vivo (Nagli
ˇ
c et al., 2019). DA as-
sumes that the scattering dominates light-skin inter-
action over the absorption and is much faster than
MC. However, its not appropriate when light source
is near the interface of skin tissue (Furutsu, 1980) or
the tissue is highly anisotropic and lowly scattered
(Zherebtsov et al., 2019). Yudovsky and Pilon de-
veloped a semi-empirical model to relate the diffuse
reflectance to the radiative properties and thickness of
2-layered media [18,19]. However, this model is lim-
ited to that the scattering must be strongly forward.
Zonios et al. found that the optical absorption spec-
trum of in vivo melanin exhibits an exponential de-
pendence on wavelength and presented a new method
for studying melanin but is assumes skin is a homo-
geneous semi-infinite medium with one layer (Zonios
et al., 2008). The empirical models usually have many
restrictions, which means the feasibility and the prac-
ticability are not enough for applications. Recently,
with the development of machine learning and deep
learning, support vector regression, artificial neural
networks, etc. have been applied in this domain fre-
quently. Yudovsky, Nguyen, and Durkin simulated
spatial frequency domain reflectance of skin for mul-
tiple wavelength with a forward neural network and
found that the optical properties could be determined
independently with minimal coupling (Yudovsky and
Durkin, 2011; Yudovsky et al., 2012). This model-
ing method is not only precise but also robust (Tsui
et al., 2018) when dealing with the reflectance col-
lected by a separated source detectors system, how-
ever, it suffers from some limitations, for example,
fixing the thickness of skin layers. The inverse neural
network is also applied to solve the problem, which
is faster than forward neural network but with large
prediction errors (Wang et al., 2012). There are still
many potentials in applying neural networks to detect
skin physiological parameters.
Two categories have been designed based on the
mapping directions. The forward one is to map skin
physiological parameters to skin diffuse reflectance,
and the inverse one is the reverse. We have built a 3-
layered skin model composed of 12 parameters and
generated a skin diffuse reflectance database using
MC. This database, which contains 50000 samples to
avoid overfitting, was then used for training a forward
mapping neural network (FNN). Afterward, we tested
the performance of FNN compared with MC in three
skin types. In total 30 samples from lightly pigmented
to darkly pigmented were created with the help of MC
and then used for the first validation. The measured
skin reflectance database was used for the second vali-
dation. Moreover, an inverse mapping neural network
(INN) was also proposed and studied in our research
for speeding up the detection of melanin content. Our
research aims at: 1) applying both FNN and INN in
non-invasively extracting melanin, hemoglobin, etc.
based on DRS; 2) analyzing the effects of skin physi-
ological parameters on reconstructing skin diffuse re-
flectance; 3) testing the suitability of neural networks
when dealing with three different skin types.
2 METHODOLOGY
2.1 Skin Model
For quantitative analysis of skin, we first need to build
a skin model. Human skin is a multi-layered biologi-
cal tissue, which generally is divided into three layers:
the epidermis, the dermis, and the subcutis. These
three layers can be detailed with many sub-layers.
To our best knowledge, a maximum 9-layered skin
model has been researched by refining the epidermis
and the dermis which consists of stratum corneum,
Quantitative Analysis of Skin using Diffuse Reflectance for Non-invasive Pigments Detection
605

stratum granulosum, stratum basal, papillary dermis,
subpapillary dermis, upper blood net dermis, reticular
dermis, deep blood net dermis, and subcutis (Maeda
et al., 2010). Although a complex structure contains
more information, it increases the computational time
especially using MC. In our research, a 3-layered
model including the epidermis, the dermis, and the
subcutis is taken into account.
Skin appearance is mainly influenced by the op-
tical properties of each layer. Following this, we
defined each layer with thickness, absorption coef-
ficient, scattering coefficient, refractive index, and
anisotropic factor. The thickness of the epidermis
varies from 0.027 to 0.15 mm (Baranoski and Krish-
naswamy, 2010). Light propagating in this layer is ab-
sorbed mostly by melanin, which is a common natural
biological pigment. There are two types of melanin,
of which the absorption spectra are not identical. Eu-
melanin and pheomelanin exhibit differences in color.
The absorption coefficient of the epidermis can be ex-
plained as a linear wavelength-dependent function as:
µ
a epi
= C
m
∗ (µ
a pheo
∗ β+ µ
a eu
∗ (1 − β))
+C
w epi
∗ µ
a w
+ (1 − C
m
− C
w epi
) ∗ µ
a base
(1)
where C
m
and C
w epi
represent the volume fraction
of melanin and water in the epidermis; β is the ratio
between pheomelanin and eumelanin; µ
a pheo
, µ
a eu
,
and µ
a w
are the absorption coefficient of pheome-
lanin, eumelanin, and water respectively; the absorp-
tion of skin baseline µ
a base
is an approximation given
by (Jacques, 1996) and it can be considered as the
absorption of collagen fibers inside skin without any
skin pigments.
The dermis is composed of dense, irregular con-
nective tissue, and blood vessels. The thickness of
the dermis is from 0.6 to 3 mm (Baranoski and Kr-
ishnaswamy, 2010). The dominant pigment in this
layer is hemoglobin in the blood. Hemoglobin can
also be divided into two types based on if it is oxy-
genated. The absorption spectra of oxy-hemoglobin
and deoxy-hemoglobin differ clearly in the visible
light range. The absorption coefficient of the dermis
is a weighted combination of the primary hemoglobin
absorption and the minor absorption of skin baseline
and water, given by:
µ
a der
= C
bl der
∗ (µ
a oxy
∗ S + µ
a deoxy
∗ (1 − S))
+ (1 − C
bl der
) ∗ C
w der
∗ µ
a w
+ (1 − C
bl der
) ∗ (1 − C
w der
) ∗ µ
a base
(2)
where C
bl der
and C
w der
are the volume fraction of
blood and water in the dermis; S indicates the oxy-
gen saturation in the blood; µ
a oxy
and µ
a deoxy
stand
for the absorption coefficient of oxy-hemoglobin and
deoxy-hemoglobin respectively considering the con-
centration of hemoglobin in the blood.
Lastly, the subcutis is assumed to be an up to 5
mm thick tissue. The absorption elements in the sub-
cutis include blood, fat, water, and skin baseline. The
absorption coefficient of this layer is similar to the
dermis by adding the extra absorption of fat, given
by:
µ
a sub
= C
bl sub
∗ (µ
a oxy
∗ S + µ
a deoxy
∗ (1 − S))
+ (1 − C
bl sub
) ∗ C
f at
∗ µ
a f at
+ (1 − C
bl sub
) ∗ (1 − C
f at
) ∗ C
w sub
∗ µ
a w
+ (1 − C
bl sub
) ∗ (1 − C
f at
) ∗ (1 − C
w sub
)
∗ µ
a base
(3)
Note that all absorption coefficients of skin pigments
are taken from in vivo experimentation (Jacques and
Prahl, ). And for (2) and (3), we introduced a mathe-
matical method residual volume fraction to avoid that
the sum of volume fractions of all pigments surpasses
1. We assume that µ
i
a
is the absorption coefficient of
the i-th pigment with the volume fraction C
i
in one
layer. Then, the absorption coefficient of this layer
µ
a layer
is generally defined as a linear form:
µ
a
layer
=
n
∑
i=1
µ
i
a
C
i
+ (1 −
n
∑
i=1
C
i
)µ
a base
s.t.
n
∑
i=1
C
i
< 100%
(4)
where n is the total number of pigments types in this
layer. However, when n is too large, it’s quite normal
that the condition can not be satisfied. That’s why we
introduce residual volume fraction. And the modified
equation is shown as:
µ
a layer
=
n
∑
i=1
"
i−1
∏
j=1
(1 − C
j
)
#
C
i
µ
i
a
+
n
∏
i=1
(1 − C
i
)µ
a base
(5)
Besides the absorption, the scattering events oc-
cur massively inside skin. To define these events,
Rayleigh scattering and Mie scattering are commonly
used in skin optics. The scattering coefficient is fit
with an equation to match those experimentation re-
sults according to (Jacques, 2013):
µ
s
= µ
s
500(nm)
∗ ( f
Ray
∗ (
λ
500(nm)
)
−4
+ (1 − f
Ray
) ∗ (
λ
500(nm)
)
−b
Mie
)
(6)
where µ
s
500(nm)
is the scattering coefficient measured at
500 nm; f
Ray
indicates the fraction of Rayleigh scat-
tering, and clearly 1 − f
Ray
is that of Mie scattering;
b
Mie
is called the scattering power which is acquired
by fitting the measured data.
VISAPP 2021 - 16th International Conference on Computer Vision Theory and Applications
606
The refractive index (n
epi
, n
der
, n
sub
) and the
anisotropic factors (g
epi
, g
der
, g
sub
) of each layer are
fixed as 1.44, 1.37, 1.37 and 0.8, 0.86, 0.75 respec-
tively. All parameters in skin model are given in Ta-
ble. I with descriptions and ranges.
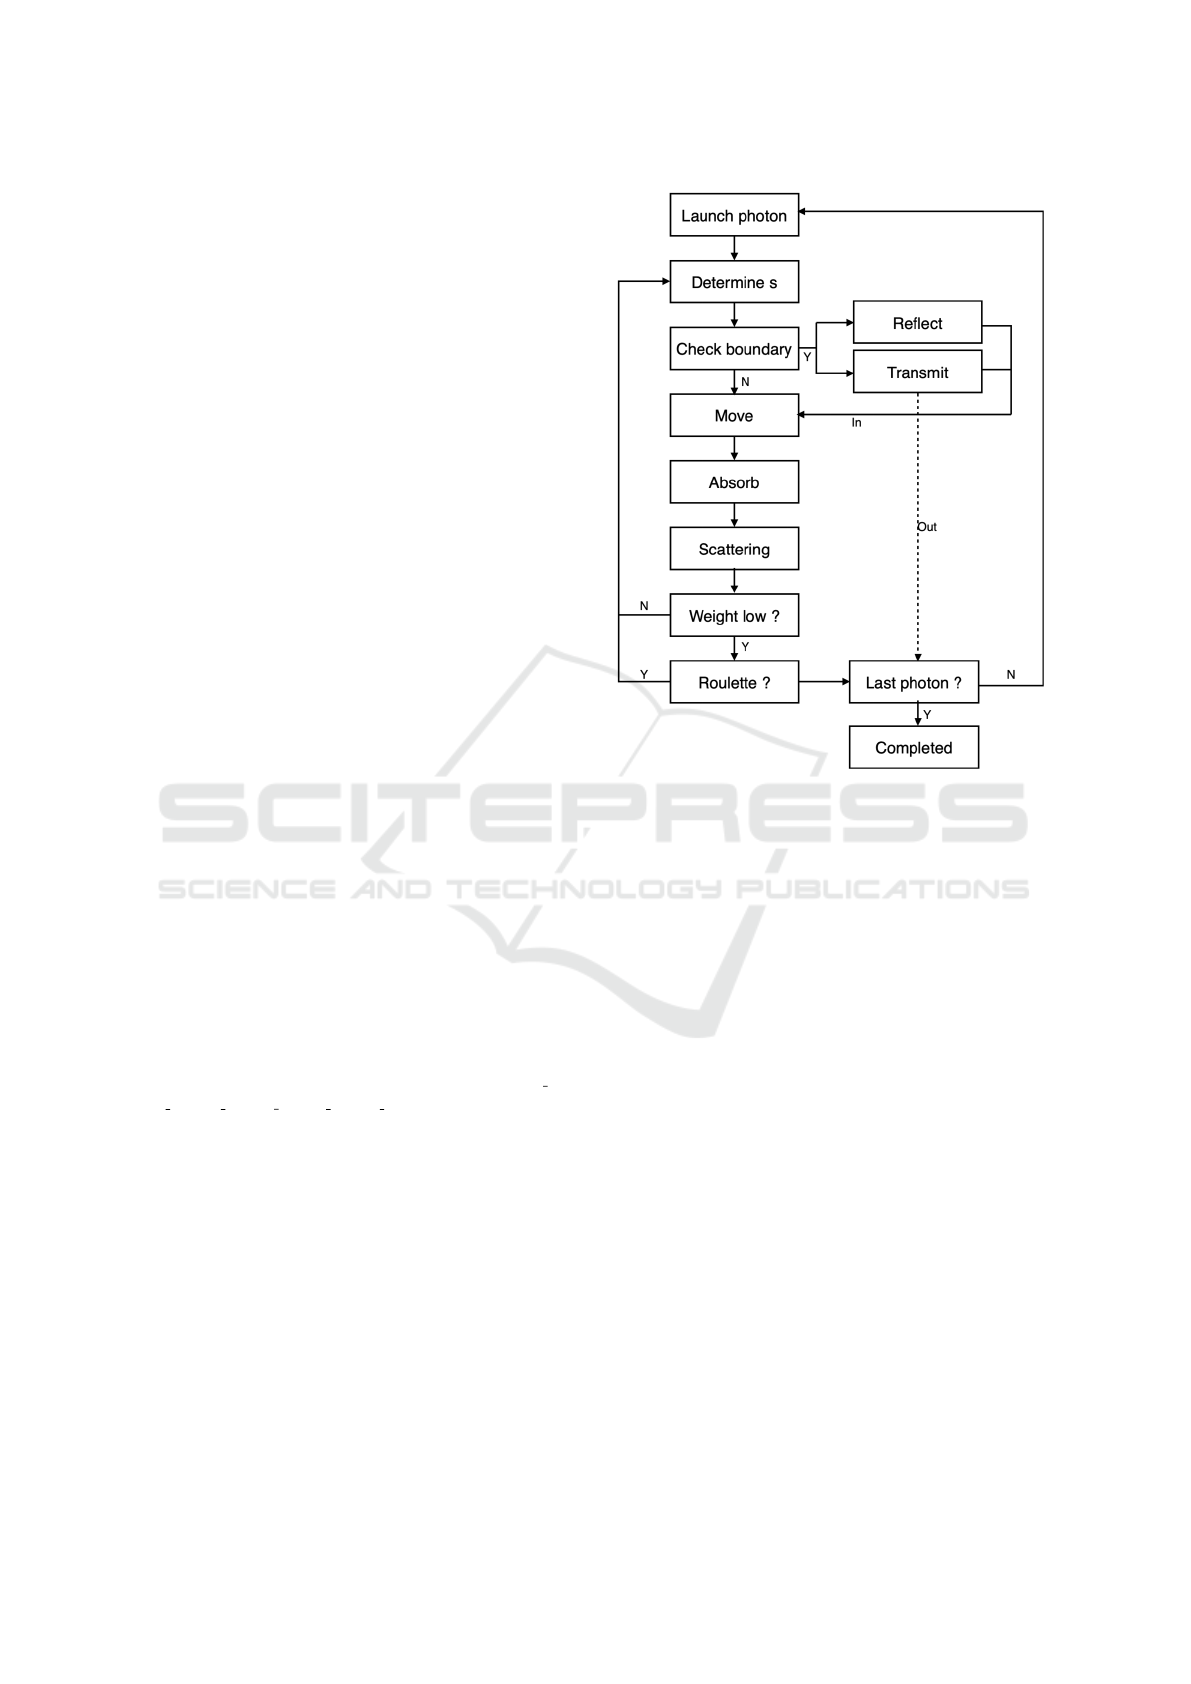
2.2 Monte Carlo Simulations
With a well-defined skin model, we then implemented
MC for reconstructing skin diffuse reflectance. The
MC was coded in Python v3.6.4, following the man-
ual of MCML (Wang et al., 1995). Fig. 1 shows the
detailed flowchart of MC. To speed up the computa-
tional time, we reduced trigonometry operations by
creating an array for indexing which directly stores
the results. And GPU techniques were then applied
to accelerate MC with almost 1000 times faster (Fang
and Boas, 2009). For each simulation, 1E07 energy
packets (or photons) were emitted perpendicular to
the interface of tissue. Detection window was set
as a circle with a radius 2 cm to ensure the total
diffuse reflectance. The optical properties of tissue
were calculated and set based on our 3-layered skin
model. 50000 samples were simulated using MC by
randomly defining 12 skin physiological parameters
and the wavelength in the range from 450 to 700 nm.
It took in total 18.2 hours for generating the skin re-
flectance database with Intel Core i7-7700HQ CPU
and Nvidia GeForce GTX1060 GPU.
2.3 Neural Networks
Two neural networks have been built in our research
with opposite mapping directions using the Deep
Learning Toolbox in MATLAB R2018a. They are
both composed of two hidden layers with 55 neurons
(Tsui et al., 2018), one input layer and one output
layer. For FNN, the inputs are the optical parame-
ters of skin model with nine dimensions (e.g. µ
a epi
,
µ
a der
, µ
a sub
, µ
s epi
, µ
s der
, µ
s sub
, d
epi
, d
der
, and d
sub
)
and the output is skin diffuse reflectance at one spec-
ified wavelength. For INN, the input is skin diffuse
reflectance spectrum from 450 to 700 nm and the out-
put are the volume fractions of skin pigments. The
training function was set as the scaled conjugate gra-
dient method. Besides this, normalization and ran-
dom data division were applied to databases. Note
that the database generated by MC was applied for
training FNN, and another database generated with
the help of FNN was then applied for training INN
since MC needs a significant amount of time to re-
produce the reflectance spectrum, and FNN provides
very similar results to MC and works much faster than
MC.
Figure 1: Flowchart of Monte Carlo simulations: energy
packets are considered as photons with an initial weight 1.
3 EXPERIMENTATION AND
RESULTS
The FNN was trained using the database generated
by MC based on 3-layered skin model. Fig. 2 shows
the performance which is the mean squared error dur-
ing the training process. As illustrated, the error de-
creases dramatically at the start, then it tends to fall
smoothly after 5000 epochs, and eventually, it holds
steady. After FNN training was completed, the dif-
fuse reflectance can be reproduced by predefining
skin physiological parameters. Then we tested FNN
on the performance of reconstructing skin diffuse re-
flectance. Taking pigmented degree into account, we
sampled 10 times for lightly, moderately, and darkly
pigmented in turn. The volume fraction of melanin
varies from [1.3% 3%], [11% 16%], and [18% 43%]
respectively (Jacques et al., 1996). 30 samples in to-
tal were created consequently. Starting from the same
randomly assigned 12 parameters of skin model, FNN
and MC reconstructed skin diffuse reflectance in the
range from 450 to 700 nm. As can be seen in Fig. 3,
the reconstructed diffuse reflectance curve gradually
increases in the range from 450 to 500 nm, and a W
pattern comes out from 500 to 600 nm. This is due
Quantitative Analysis of Skin using Diffuse Reflectance for Non-invasive Pigments Detection
607
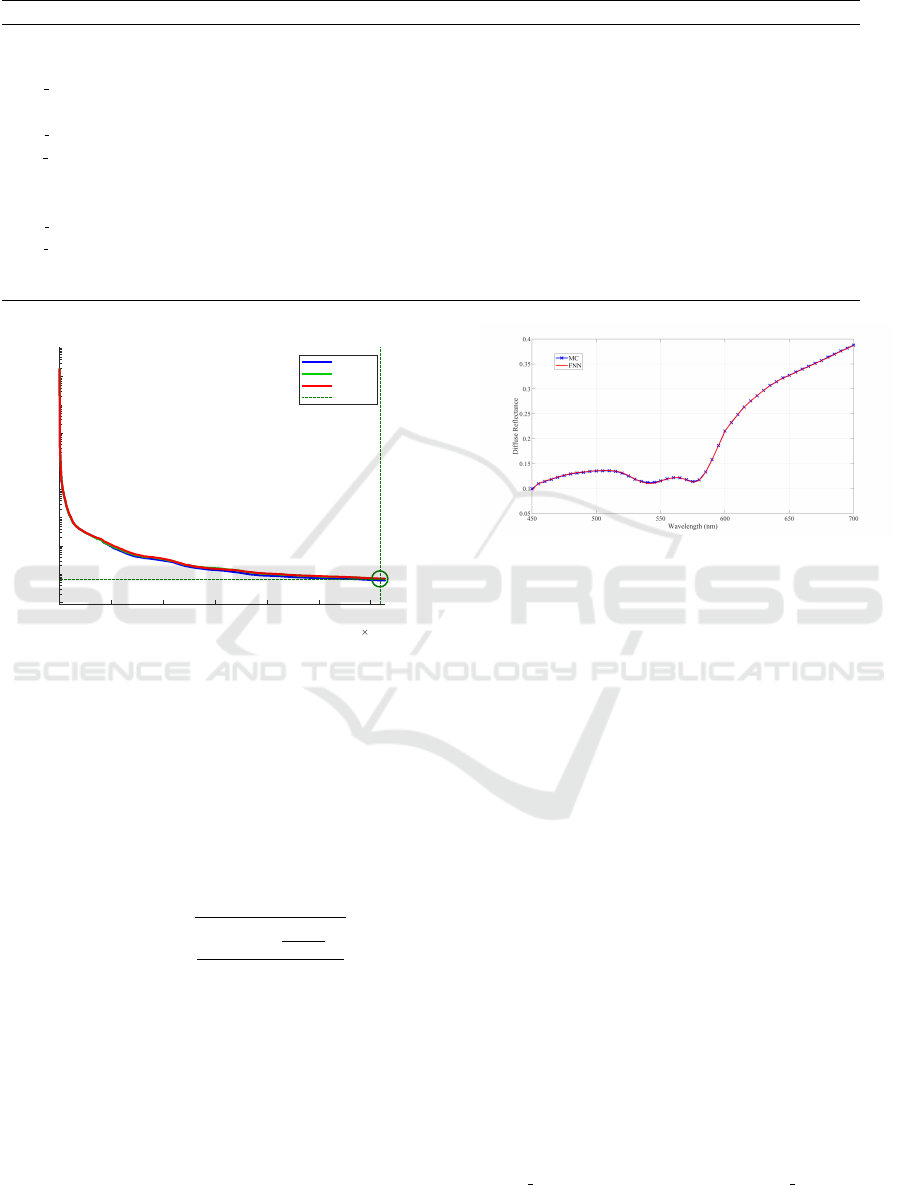
Table 1: Descriptions, symbols, and ranges of parameters in skin model.
Symbol Description Range
C
m
volume fraction of melanin 1.3-43% (Jacques, 1996)
β ratio of pheomelanin to eumelanin 4.9-36% (Parsad et al., 2003)
C
w epi
volume fraction of water in epidermis 10-20%
d
epi
thickness of epidermis 0.027-0.15mm (Baranoski and Krishnaswamy, 2010)
C
bl der
volume fraction of blood in dermis 0.2-7% (Flewelling, 2000)
C
w der
volume fraction of water in dermis 40-90%
S oxygen saturation 50-95% (Angelopoulou, 2001)
d
der
thickness of dermis 0.6-3mm (Baranoski and Krishnaswamy, 2010)
C
bl sub
volume fraction of blood in subcutis 5-20%
C
w sub
volume fraction of water in subcutis 40-90%
C
f at
volume fraction of fat 40-70%
d
sub
thickness of subcutis 1-5mm
0 0.5 1 1.5 2 2.5 3
31391 Epochs
10
4
10
-8
10
-6
10
-4
10
-2
10
0
Mean Squared Error (mse)
Best Validation Performance is 6.8471e-08 at epoch 30891
Train
Validation
Test
Best
Figure 2: Performance for FNN trained by the MC
database.
to the unique absorption of oxy-hemoglobin. Here,
for sample no.1, the oxygen saturation in the blood
is 65.1%. Generally, the higher the volume fraction
of blood and oxy-hemoglobin, the more apparent this
W pattern. When melanin dominates the absorption,
the ”W” pattern is no longer apparent. The root mean
squared relative error (RMSRE) was used for evaluat-
ing the fitting performance, given by:
RMSRE =
v
u
u
t
∑
λ=700nm
λ=450nm
(
R
λ
−T
λ
T
λ
)
2
N
λ
(7)
where R
λ
and T
λ
are respectively the diffuse re-
flectance produced by our method and the target
reflectance; N
λ
is number of wavelengths (bands),
equaling 251 in our research. Then the RMSRE were
calculated for all 30 samples in different groups. The
average values of RMSRE using FNN are 0.0033,
0.0037, and 0.0061 for three groups. It turns out
that FNN can yield skin diffuse reflectance extremely
close to the target reflectance simulated by MC start-
ing from the same skin physiological parameters.
Figure 3: Reconstructing skin reflectance by MC and FNN:
sample no.1.
3.1 Effects Analysis of Skin Parameters
on Reconstructing Reflectance
Before detecting pigments information, we would like
to first analyze the effects of skin parameters on re-
constructing skin diffuse reflectance. One parameter
is analyzed by varying its value while all other pa-
rameters are fixed. All parameters are initialized as
the lower limit in Table. I.
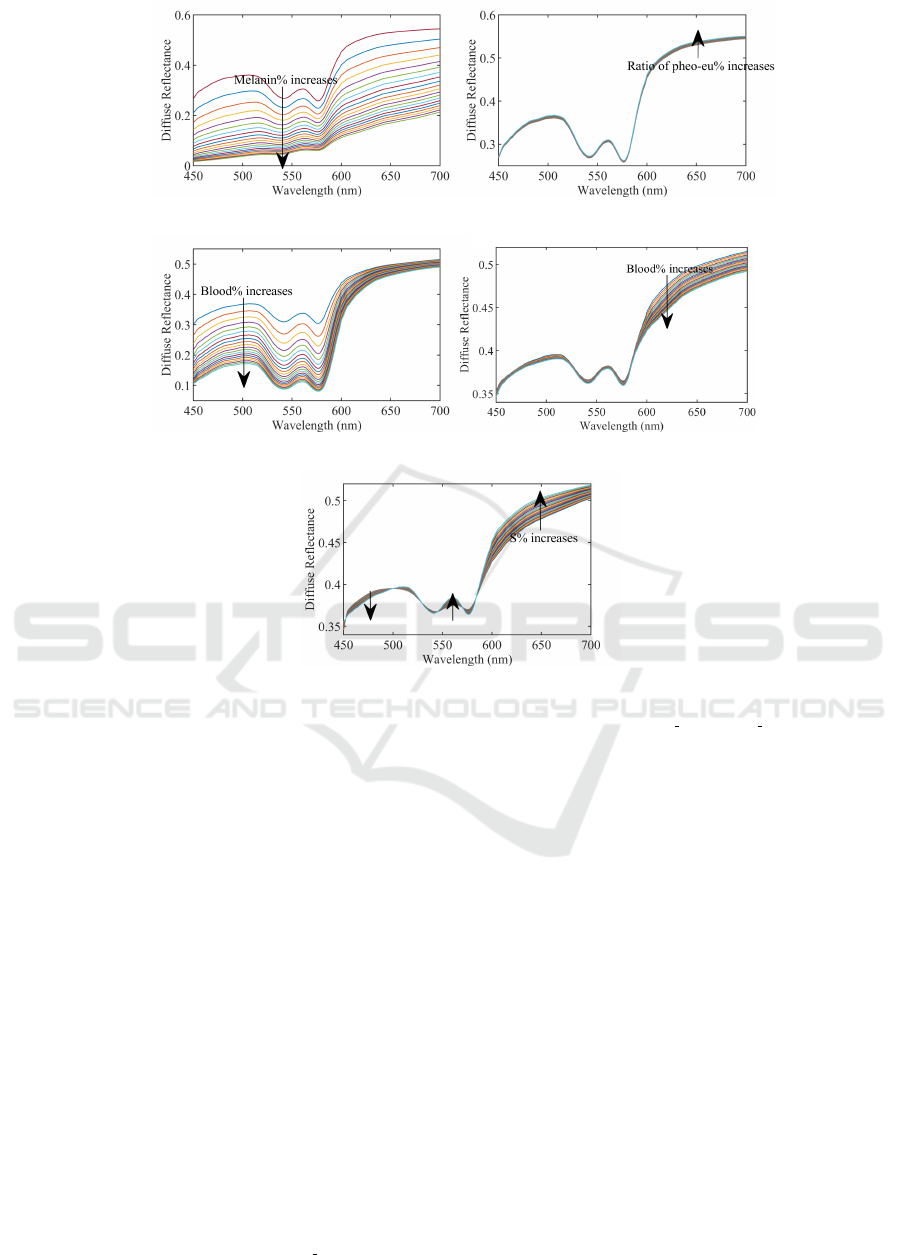
The volume fraction of melanin is set from 1.3 to
43% with 2% increment in turn. Fig. 4(a) shows
the results of reconstructing diffuse reflectance with
varying C
m
. We find that in general the reflectance
decreases when C
m
increases. The reflectance curve
tends to be more flattened, and typical W pattern be-
comes less evident. The absorption coefficient of
melanin decreases gradually and steadily over 450-
700 nm. Accordingly, the diffuse reflectance in-
creases gradually and steadily while C
m
is too large
and melanin dominates the absorption. Changing β
does not really affects the shape of reflectance curve
as shown in Fig. 4(b) since two types of melanin have
similar absorption spectra in the visible light range,
and µ
a pheo
is slightly smaller than µ
a eu
. When β
increases, the proportion of pheomelanin increases,
thus, the total absorption caused by melanin decreases
VISAPP 2021 - 16th International Conference on Computer Vision Theory and Applications
608

a little. Consequently, the diffuse reflectance grows.
The difference between µ
a pheo
and µ
a eu
becomes
larger in long wavelength range. This is also reflected
in the reconstructed diffuse reflectance, where the dif-
ference in long wavelength range is more evident.
The absorption of blood is mainly expressed as
hemoglobin and oxygen saturation. Fig. 4(c), Fig.
4(d), and Fig. 4(e) illustrate the effects of blood in the
dermis and subcutis, and oxygen saturation on recon-
structing skin diffuse reflectance. With the volume
fraction of blood increasing both in the dermis and
subcutis, skin reflectance decreases. Moreover, the ef-
fects of blood in the dermis are more significant than
in the subcutis since only small parts of light can pen-
etrate into the subcutis and the long-wavelength light
has better penetration. Thats why the effects of blood
in the subcutis mainly locate in the range from 600
to 700 nm. On the other hand, the effects of oxygen
saturation are not uniform since oxy-hemoglobin has
a unique W pattern absorption coefficient. When S
increases, the diffuse reflectance decreases from 450
to nearly 500 nm, increases from about 550 to 575
nm, and increases significantly from 600 to 700 nm.
This can be explained under the comprehensive ab-
sorption of oxy- and deoxy-hemoglobin. From 450 to
500 nm, µ
a oxy
is larger than µ
a deoxy
. The absorption
is enhanced while S grows. From 550 to 575 nm and
above 600 nm, µ
a oxy
is smaller than µ
a deoxy
. Then,
we can see that skin diffuse reflectance increases as S
grows.
The thickness of skin layers are also involved and
the effects of the thickness of each layer are not the
same. Skin diffuse reflectance decreases while d
epi
grows. However, it increases while d
der
, d
sub
grows.
Note that all parameters are initialized as the lower
limit. This means the absorption of skin is possibly
insufficient and the transmitted light is large. The re-
sults may change in realistic condition. Other pig-
ments (e.g. water and fat) are not listed here in this
study because they are less weighted in skin absorp-
tion given that their absorption coefficients are much
smaller than melanin or hemoglobin.
3.2 INN Training and Acceleration
We have proved FNN reconstructs extremely simi-
lar skin diffuse reflectance to MC. Therefore, another
database composed of reflectance spectra from 450
to 700 nm and melanin information was built using
FNN for speeding up. 50000 samples were created
within 4.3 hours by randomly predefining skin phys-
iological parameters. Note that this second database
contains the reflectance spectra but not the reflectance
at one wavelength. It took 57 minutes 38 seconds to
complete the training process for INN. Moreover, we
applied principal components analysis (PCA) for di-
mensionality reduction and speeding up. PCA uses
orthogonal transformation to linearly transform the
observations of a series of possibly related variables,
thereby projecting the values of a series of linear
unrelated variables. These unrelated variables are
called principal components. In our research, we have
50000 observations with 251 variables (from 450 to
700 nm with 1 nm increment), represented by a ma-
trix X (251×50000). Then, a principal components
matrix Y is defined:
Y
T
= X
T
W
= (W DV
T
)
T
W
= V D
T
W
T
W
= V D
T
(8)
where X = W DV
T
is the singular value decomposi-
tion; W is the eigenvector matrix of XX
T
(251×251);
D is a 251×50000 non-negative rectangular diag-
onal matrix; V is the eigenvector matrix of X
T
X
(50000×50000). We calculated the influence of ev-
ery principal component and the first seven principal
components accounted for above 99.53%. Then, a
data matrix X is transformed to a matrix 7×50000
with reduced dimensionality. Another INN was
trained based on this low-dimension matrix within 10
minutes 35 seconds.
3.3 Verification of Pigments Detection
with Synthetic Data
Although our methods give favorable results in re-
gression, to extract or quantify skin physiological pa-
rameters, the inverse problem is undoubtedly more
important. In other words, our methods need to fit
the diffuse reflectance curve precisely without know-
ing those parameters in prior. The flowcharts of two
neural networks are shown in Fig. 5. For FNN,
RMSRE between the target and reconstructed diffuse
reflectance was reduced until reaching the limits of
the optimization process by adjusting the inputs iter-
atively. In our research, the interior-point algorithm
was selected to minimize RMSRE. The maximum
number of iterations was assigned to 1000. The initial
physiological parameters were randomly set within
the proper range and 5 start points were arranged.
For INN, we directly obtained the volume fraction
of melanin based on inputting the diffuse reflectance
spectrum. To validate our methods, we first used 30
samples in three different groups generated by MC as
we mentioned above. We first focused on the results
of FNN. For lightly pigmented group, satisfactory es-
timations were obtained for the volume fraction of
Quantitative Analysis of Skin using Diffuse Reflectance for Non-invasive Pigments Detection
609
(a) (b)
(c) (d)
(e)
Figure 4: Reconstructing skin diffuse reflectance using varying (a) C
m
; (b) β; (c) C
bl der
; (d) C
bl sub
; (e) S.
melanin and blood in the dermis, the oxygen satu-
ration, and the thickness of first two layers. Yet not
every parameter can be extracted accurately. The rest
parameters were not estimated with acceptable errors.
Table II shows some estimation results using FNN.
The prediction error for the volume fraction of water
reaches a maximum of nearly 30%. From the perspec-
tive of the absorption coefficients of skin pigments,
water is less weighted and has less impact on the dif-
fuse reflectance although its volume fraction is large
enough. By contrast, melanin and hemoglobin dom-
inate the light absorption within the skin, thus, the
prediction errors are favorable. The situation is quite
similar in moderately and darkly pigmented groups.
And we find that the estimation of ratio of pheome-
lanin to eumelanin becomes more accurate when the
volume fraction of melanin grows. The average rel-
ative errors of β is reduced to almost 5% for darkly
pigmented group. Moreover, the thickness of first two
layers can be also estimated correctly with the aver-
age relative errors 1.11%, 4.80% for d
epi
and d
der
.
The average relative errors of C
m
, C
bl der
, and S for
all three groups are 1.36%, 8.69%, and 3.37% respec-
tively. For the volume fraction of blood in the subcutis
and fat, the estimation errors are less than 10%. Dur-
ing this optimization process, the average RMSRE
for 30 samples equals to 0.0078, which means FNN
can accurately fit the synthetic reflectance curve with-
out knowing skin physiological parameters in prior.
Besides, it costs an average of 17 seconds to fit the
curve and quantify parameters for one sample. Given
that MC needs roughly 332 seconds to reconstruct a
spectrum while FNN needs only 0.0019 seconds in
our experimentation, using inverse MC probably costs
dozens of hours to finish the detection task.
To furthermore speed up the detection, INN was
applied to estimate the volume fraction of melanin
from 30 samples. Both INN and INN+PCA were
tested. Table III gives the detection results for
all groups. For lightly pigmented group, the root-
mean-square errors (RMSE) and standard deviations
(STD) of INN and INN+PCA are 0.30%±0.30% and
0.21%±0.42% respectively. The small values of
RMSE and STD imply that two methods are robust
VISAPP 2021 - 16th International Conference on Computer Vision Theory and Applications
610
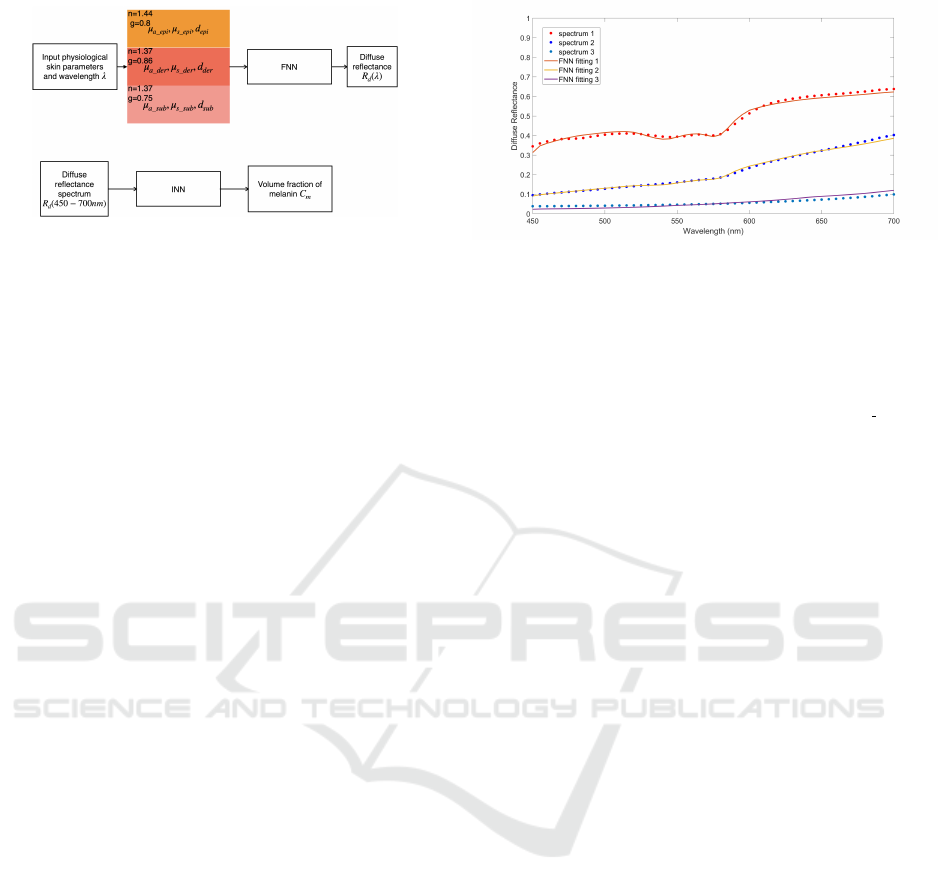
Figure 5: The flowcharts of FNN and INN.
when estimating the volume fraction of melanin. For
moderately pigmented group, RMSE and STD of INN
and INN+PCA are 0.40%±0.39% and 0.5%±1.34%.
Both two methods have acceptable results and INN
becomes more accurate than INN+PCA. For darkly
pigmented group, RMSE and STD of INN and
INN+PCA are 2.00%±1.93% and 2.33%±5.6%. The
errors become larger but are still acceptable. Given
that the target volume fraction of melanin for lightly
pigmented group is too low, varying from 1.3% to
3%, the relative errors for this group are the largest
among three groups. To sum up, INN and INN+PCA
estimate close results for three groups most of time.
Although INN is more accurate than INN+PCA, it
costs more training time. FNN can estimate precisely
not only melanin information but also the oxygen
saturation and blood information. However, it costs
more time to finish the estimation task while INN and
INN+PCA cost only about 0.012 seconds.
3.4 Verification of Pigments Detection
with Measured Data
Our methods detect several skin physiological pa-
rameters successfully from the synthetic diffuse re-
flectance. The next step is to detect these parame-
ters from the measured data. NIST skin reflectance
database was used in this part. The skin diffuse re-
flectance spectra were acquired with a commercially
available spectrophotometer with the help of integrat-
ing sphere and this database contains 100 samples
with spanning the wavelength range from 250 to 2500
nm with an increment 3 nm (Cooksey et al., 2017).
These samples were reshaped using the interpolation
algorithm and only the range from 450 to 700 nm was
saved for further uses. Afterward, the curve-fitting
process was applied and the optimization goal was to
minimize RMSRE for FNN and MC. For INN and
INN+PCA, they directly detected the melanin infor-
mation from the target spectrum. Table IV provides
the detection results for three samples from NIST
database. As we can see, FNN and MC obtained ap-
proximate fitting performance. They both need the
Figure 6: The measured and reconstructed spectra by FNN
from NIST.
curve-fitting process to complete the detection task.
INN and INN+PCA also obtained approximate values
compared to FNN and MC. For spectrum 1, all meth-
ods obtained C
m
around 2% which belongs to lightly
pigmented group. The estimation results of C
bl der
and S are also extremely close for FNN and MC. FNN
has a better fitting performance than MC with RM-
SRE equals to 2.08%. For the rest two spectra, C
m
were estimated as about 3% and 10%, which matches
well the spectra as shown in Fig. 6. In the range from
450 to 700 nm, the diffuse reflectance of spectrum 2
is evenly higher than spectrum 3. Overall, our meth-
ods have favorable estimation results in detecting pig-
ments information from the measured spectra.
4 DISCUSSION AND
CONCLUSION
Our research gives a quantitative analysis of skin
based on its diffuse reflectance. MC is used for gen-
erating the synthetic training database based on a 3-
layered skin model. FNN has been trained to solve
the detection task. The absorption of skin is influ-
enced by the combination of various pigments and the
thickness of layers. The effects of several skin pig-
ments are analyzed separately. We find that the unique
”W” pattern absorption of oxy-hemoglobin can be
reflected clearly on the diffuse reflectance spectrum
when the absorption of other pigments is not over
weighted. The results present that FNN has excel-
lent fitting performance when dealing with synthetic
data. And when it comes to the measured data, the fit-
ting performance is also acceptable. The visible light
range from 450 to 700 nm is taken into account in our
experimentation. As we know, the longer-wavelength
light generally has better penetration capacity. The
thicker the skin layers, the less likely light will pene-
trate. A 3-layered skin model is necessary when deal-
ing with thin skin and long-wavelength light. Besides,
the pigments detection for melanin and blood in the
Quantitative Analysis of Skin using Diffuse Reflectance for Non-invasive Pigments Detection
611

Table 2: The fitting results of FNN for one sample in each group.
C
m
β C
water epi
C
water der
C
water sub
C
bl der
Sample no.1 Optimized 0.0251 0.0673 0.1496 0.5549 0.6611 0.0623
Target 0.0251 0.1698 0.1712 0.4724 0.8811 0.0672
Sample no.11 Optimized 0.1577 0.0966 0.1497 0.5545 0.7662 0.0061
Target 0.1563 0.0870 0.1337 0.6185 0.7512 0.0064
Sample no.21 Optimized 0.2859 0.3380 0.1507 0.6576 0.7755 0.0096
Target 0.2865 0.3534 0.1607 0.7400 0.8396 0.0102
C
bl sub
S C
f at
d
epi
d
der
d
sub
Sample no.1 Optimized 0.0676 0.6508 0.5473 0.0107 0.2574 0.2074
Target 0.1455 0.6510 0.4865 0.0108 0.2836 0.2381
Sample no.11 Optimized 0.0769 0.5325 0.4702 0.0122 0.0720 0.3485
Target 0.0560 0.5362 0.4540 0.0124 0.0792 0.2471
Sample no.21 Optimized 0.0566 0.8896 0.5197 0.0116 0.2836 0.1901
Target 0.0871 0.8854 0.4995 0.0117 0.2627 0.2153
Table 3: Melanin[%] detection results of proposed INN methods for three groups.
Samples no.1 no.2 no.3 no.4 no.5 no.6 no.7 no.8 no.9 no.10
Target 2.51 2.02 1.76 1.85 2.26 1.74 1.96 1.88 2.79 1.47
INN 2.30 1.78 2.13 1.88 2.41 1.67 1.66 1.30 3.24 1.32
INN+PCA 2.47 1.86 2.23 1.83 2.30 1.56 2.08 1.52 2.78 1.53
no.11 no.12 no.13 no.14 no.15 no.16 no.17 no.18 no.19 no.20
Target 15.63 12.44 12.18 13.01 13.82 13.48 11.24 14.28 14.45 11.43
INN 15.72 12.59 12.28 12.60 13.77 13.64 12.10 13.89 14.05 11.98
INN+PCA 16.25 12.34 12.29 13.00 13.85 13.41 11.29 14.17 14.42 12.85
no.21 no.22 no.23 no.24 no.25 no.26 no.27 no.28 no.29 no.30
Target 28.65 24.49 30.97 19.79 36.19 39.78 27.24 28.35 22.17 37.46
INN 28.64 24.01 30.73 19.28 36.14 33.88 27.02 30.42 22.02 37.83
INN+PCA 28.03 24.80 30.69 19.73 35.79 34.91 27.50 33.76 22.35 38.20
dermis (hemoglobin together with the oxygen satu-
ration) are very promising. Other skin physiological
parameters like the thickness of each layer are also ac-
ceptable. However, for water content, the estimation
results are not accurate due to its low light absorption
from 450 to 700 nm. This problem may be solved by
expanding the light range to infrared where the ab-
sorption coefficient of water increases a lot. More-
over, we also introduce INN and PCA to speed up the
melanin detection. The accuracy of INN is similar to
FNN. INN needs much less computational time than
FNN because it doesn’t rely on the curve-fitting pro-
cess. This also makes INN less robust and intuitive
than FNN. FNN with the curve-fitting process can re-
construct the diffuse reflectance very well compared
with the measured data. As perspectives, we plan to
improve our skin model by adding separately upper
and deep blood plexus. In tissue, blood is not evenly
distributed, but rather confined to vessels (Van Veen
et al., 2002). This fact affects the reflectance spectra
and is called the vessel packaging effect. The estima-
tion results of the oxygen saturation and the blood can
be more accurate with accounting for the vessel pack-
aging. Moreover, the selection of wavelength bands is
also an approach to improve detection performance.
For example, we can focus on the ”W” pattern range
when detecting the oxygen saturation because it is a
unique pattern of the absorption coefficient of oxy-
hemoglobin. With the development of DRS instru-
ments, we plan to implement FNN and INN to detect
skin pigments information non-invasively and in real-
time together with the automatic recognition of skin
diseases (Carcagn
`
ı et al., 2019). This will be much
helpful for the quantitative diagnosis of some skin dis-
eases, such as vitiligo and melanoma.
ACKNOWLEDGEMENTS
We would like to thank China Scholarship Council
(CSC) the grant contract number is 201701810030
which partially supports this research.
VISAPP 2021 - 16th International Conference on Computer Vision Theory and Applications
612

Table 4: The extractiong results of 2L-FANN and 3L-FANN.
Sample Methods C
m
C
bl der
S RMSRE
spectrum 1 FNN 1.31% 0.56% 90.23% 2.08%
MC 2.13% 0.54% 90.45% 3.28%
INN 1.84%
INN+PCA 1.72%
spectrum 2 FNN 3.23% 1.02% 94.95% 4.27%
MC 3.69% 1.08% 94.91% 5.69%
INN 2.90%
INN+PCA 2.87%
spectrum 3 FNN 10.09% 2.41% 80.00% 10.76%
MC 9.79% 2.03% 80.02% 8.37%
INN 10.69%
INN+PCA 10.73%
REFERENCES
Alerstam, E., Svensson, T., and Andersson-Engels, S.
(2008). Parallel computing with graphics process-
ing units for high-speed monte carlo simulation of
photon migration. Journal of biomedical optics,
13(6):060504.
Angelopoulou, E. (2001). Understanding the color of hu-
man skin. In Human vision and electronic imaging
VI, volume 4299, pages 243–251. International Soci-
ety for Optics and Photonics.
Baranoski, G. V. and Krishnaswamy, A. (2010). Light and
skin interactions: simulations for computer graphics
applications. Morgan Kaufmann.
Carcagn
`
ı, P., Leo, M., Cuna, A., Mazzeo, P. L., Spagnolo,
P., Celeste, G., and Distante, C. (2019). Classifica-
tion of skin lesions by combining multilevel learnings
in a densenet architecture. In International Confer-
ence on Image Analysis and Processing, pages 335–
344. Springer.
Chen, Y.-W., Chen, C.-C., Huang, P.-J., and Tseng, S.-
H. (2016). Artificial neural networks for retriev-
ing absorption and reduced scattering spectra from
frequency-domain diffuse reflectance spectroscopy at
short source-detector separation. Biomedical optics
express, 7(4):1496–1510.
Cooksey, C. C., Allen, D. W., and Tsai, B. K. (2017). Ref-
erence data set of human skin reflectance. J. Res. Nat.
Inst. Standards Technol., 122:1–5.
Fang, Q. and Boas, D. A. (2009). Monte carlo simula-
tion of photon migration in 3d turbid media accel-
erated by graphics processing units. Optics express,
17(22):20178–20190.
Flewelling, R. (2000). Noninvasive optical monitoring, in
the biomedical engineering handbook, jd bronzino,
ed.
Fredriksson, I., Larsson, M., and Str
¨
omberg, T. (2012).
Inverse monte carlo method in a multilayered tissue
model for diffuse reflectance spectroscopy. Journal of
biomedical optics, 17(4):047004.
Furutsu, K. (1980). Diffusion equation derived from space-
time transport equation. JOSA, 70(4):360–366.
Ishimaru, A. (1978). Wave propagation and scattering in
random media, volume 2. Academic press New York.
Jacques, S. and Prahl, S. Assorted spectra. [EB/OL]. https://
omlc.org/spectra/index.html Accessed July 15, 2020.
Jacques, S. L. (1996). Origins of tissue optical properties
in the uva, visible, and nir regions. OSA TOPS on
advances in optical imaging and photon migration,
2:364–369.
Jacques, S. L. (2013). Optical properties of biological
tissues: a review. Physics in Medicine & Biology,
58(11):R37–61.
Jacques, S. L., Glickman, R. D., and Schwartz, J. A.
(1996). Internal absorption coefficient and threshold
for pulsed laser disruption of melanosomes isolated
from retinal pigment epithelium. In Laser-Tissue In-
teraction VII, volume 2681, pages 468–478. Interna-
tional Society for Optics and Photonics.
Leo, M., Carcagn
`
ı, P., Mazzeo, P. L., Spagnolo, P., Caz-
zato, D., and Distante, C. (2020). Analysis of fa-
cial information for healthcare applications: A survey
on computer vision-based approaches. Information,
11(3):128.
Maeda, T., Arakawa, N., Takahashi, M., and Aizu, Y.
(2010). Monte carlo simulation of spectral reflectance
using a multilayered skin tissue model. Optical re-
view, 17(3):223–229.
Mazzoli, A., Munaretto, R., and Scalise, L. (2010). Prelim-
inary results on the use of a noninvasive instrument
for the evaluation of the depth of pigmented skin le-
sions: numerical simulations and experimental mea-
surements. Lasers in medical science, 25(3):403–410.
Mehr
¨
ubeo
˘
glu, M., Kehtarnavaz, N., Marquez, G., Duvic,
M., and Wang, L. V. (2002). Skin lesion classifica-
tion using oblique-incidence diffuse reflectance spec-
troscopic imaging. applied optics, 41(1):182–192.
Nagli
ˇ
c, P., Vidovi
ˇ
c, L., Milani
ˇ
c, M., Randeberg, L. L., and
Majaron, B. (2019). Suitability of diffusion approx-
imation for an inverse analysis of diffuse reflectance
spectra from human skin in vivo. Osa Continuum,
2(3):905–922.
Parsad, D., Wakamatsu, K., Kanwar, A., Kumar, B., and Ito,
S. (2003). Eumelanin and phaeomelanin contents of
Quantitative Analysis of Skin using Diffuse Reflectance for Non-invasive Pigments Detection
613

depigmented and repigmented skin in vitiligo patients.
British Journal of Dermatology, 149(3):624–626.
Salomatina, E. V., Jiang, B., Novak, J., and Yaroslavsky,
A. N. (2006). Optical properties of normal and
cancerous human skin in the visible and near-
infrared spectral range. Journal of biomedical optics,
11(6):064026.
Sharma, M., Hennessy, R., Markey, M. K., and Tunnell,
J. W. (2014). Verification of a two-layer inverse monte
carlo absorption model using multiple source-detector
separation diffuse reflectance spectroscopy. Biomedi-
cal optics express, 5(1):40–53.
Spott, T. and Svaasand, L. O. (2000). Collimated light
sources in the diffusion approximation. Applied op-
tics, 39(34):6453–6465.
Tsui, S.-Y., Wang, C.-Y., Huang, T.-H., and Sung, K.-
B. (2018). Modelling spatially-resolved diffuse re-
flectance spectra of a multi-layered skin model by ar-
tificial neural networks trained with monte carlo sim-
ulations. Biomedical optics express, 9(4):1531–1544.
Van Veen, R., Verkruysse, W., and Sterenborg, H. (2002).
Diffuse-reflectance spectroscopy from 500 to 1060
nm by correction for inhomogeneously distributed ab-
sorbers. Optics letters, 27(4):246–248.
Vyas, S., Banerjee, A., and Burlina, P. (2013). Estimating
physiological skin parameters from hyperspectral sig-
natures. Journal of biomedical optics, 18(5):057008.
Wallace, V., Crawford, D., Mortimer, P., Ott, R., and Bam-
ber, J. (2000). Spectrophotometric assessment of pig-
mented skin lesions: methods and feature selection
for evaluation of diagnostic performance. Physics in
Medicine & Biology, 45(3):735.
Wang, L., Jacques, S. L., and Zheng, L. (1995). Mcml-
monte carlo modeling of light transport in multi-
layered tissues. Computer methods and programs in
biomedicine, 47(2):131–146.
Wang, Q., Le, D., Ramella-Roman, J., and Pfefer, J. (2012).
Broadband ultraviolet-visible optical property mea-
surement in layered turbid media. Biomedical optics
express, 3(6):1226–1240.
Yudovsky, D. and Durkin, A. J. (2011). Spatial frequency
domain spectroscopy of two layer media. Journal of
biomedical optics, 16(10):107005.
Yudovsky, D., Nguyen, J. Q. M., and Durkin, A. J.
(2012). In vivo spatial frequency domain spectroscopy
of two layer media. Journal of biomedical optics,
17(10):107006.
Zerbino, D. (1994). Biopsy: its history, current and future
outlook. Likars’ ka sprava, (3-4):1–9.
Zhang, L., Wang, Z., and Zhou, M. (2010). Determination
of the optical coefficients of biological tissue by neu-
ral network. Journal of Modern Optics, 57(13):1163–
1170.
Zherebtsov, E., Dremin, V., Popov, A., Doronin, A., Ku-
rakina, D., Kirillin, M., Meglinski, I., and Bykov, A.
(2019). Hyperspectral imaging of human skin aided
by artificial neural networks. Biomedical optics ex-
press, 10(7):3545–3559.
Zonios, G., Dimou, A., Bassukas, I., Galaris, D., Tsolakidis,
A., and Kaxiras, E. (2008). Melanin absorption spec-
troscopy: new method for noninvasive skin investiga-
tion and melanoma detection. Journal of biomedical
optics, 13(1):014017.
VISAPP 2021 - 16th International Conference on Computer Vision Theory and Applications
614
