
Online Decision Support Tool that Explains
Temporal Prediction of Activities of Daily Living (ADL)
Janusz Wojtusiak
1
, Negin Asadzadehzanjani
1
, Cari Levy
2
, Farrokh Alemi
1
and Allison E. Williams
3
1
Department of Health Administration and Policy, George Mason University, Fairfax, VA, U.S.A.
2
Department of Veterans Affairs, Denver, CO, U.S.A.
3
Department of Veterans Affairs, Bay Pines, FL, U.S.A.
Keywords: Machine Learning, Clinical Decision Support, Prediction Explanation, Activities of Daily Living.
Abstract: This paper presents an online decision support tool that can be used to assess and predict functional abilities
in terms of nine Activities of Daily Living (ADLs) up to one year ahead. The tool is based on previously
developed Computational Barthel Index (CBIT) and has been rebuilt using Gradient Boost (GB) models with
average Area under ROC (AUC) of 0.79 (0.77-0.80), accuracy of 0.74 (0.70-0.79), recall of 0.78 (0.58-0.93),
and precision of 0.75 (0.67-0.82) when evaluating ADLs for new patients. When re-evaluating patients, the
models achieved AUC 0.95 (0.94-0.96), accuracy of 0.91 (0.90-0.92), recall of 0.91 (0.86-0.95), and precision
of 0.92 (0.88-0.94). The decision support tool has been equipped with a prediction explanation module that
calculates and visualizes influence of patient characteristics on the predicted values. The explanation approach
focuses on patient characteristics present in the data, rather than all attributes used to construct models. The
tool has been implemented in Python programming language using Flask Web framework and is accessible
through a website or an Application Programming Interface (API).
1 INTRODUCTION
The presented work addresses assessment and
prediction of functional abilities and their
improvement or decline over time as an important
factor in making decision regarding care provided to
elderly patients. According to Fried et al. (2002),
patients who were aware that they were unlikely to
return to their baseline functional status were less
likely to proceed with hospital treatment. Quality of
life (QOL), including functional independence, is
often more important than survival time for many
patients (McCarthy et al., 2000). QOL depends on
many factors, one of which is patients’ functional
independence, including the ability to perform basic
Activities of Daily Living (ADLs) and more complex
Instrumental Activities of Daily Living (iADLs).
Often, functional ability of nursing home patients is
assessed by direct observation of skilled nurses,
which is a time consuming and costly process. In the
United States, the assessments are often reported
using the Minimum Data Set (MDS). It is a
standardized patient evaluation instrument collected
by nurses through observing patients in consultation
with other care team members. The assessment data
are collected by nursing homes and entered in MDS
Section G (MDS 3.0 Technical Information, n.d.).
However, similar data are not routinely collected for
elderly patients outside of nursing homes.
Assessing and predicting patients’ functional
status has several important uses in clinical work and
research. It also allows for an informed discussion
between clinicians and patients or caregivers and may
help in planning care. This paper presents an online
decision support tool based on the previously
developed Computational Barthel Index, CBIT
(Wojtusiak et al. 2020). All models in the original
CBIT have been rebuilt to improve the tool’s
performance. The tool allows for automatically
assessing current functional status and predicting
functional status up to one year ahead in terms of the
ability to perform the ADLs. The system name is
inspired by the Barthel index (scale) which is
standardized instrument for evaluating ADLs
(Mahoney and Barthel, 1965; Bouwstra et al., 2019).
Specifically, the system considers the ability to assess
and predict independence in bathing, eating,
grooming, bladder, bowels, dressing, transferring,
toileting and walking. The tenth item from the
original Barthel scale, stairs, is not included as it is
impossible to assess in nursing home population.
Wojtusiak, J., Asadzadehzanjani, N., Levy, C., Alemi, F. and Williams, A.
Online Decision Support Tool that Explains Temporal Prediction of Activities of Daily Living (ADL).
DOI: 10.5220/0010325606290636
In Proceedings of the 14th International Joint Conference on Biomedical Engineering Systems and Technologies (BIOSTEC 2021) - Volume 5: HEALTHINF, pages 629-636
ISBN: 978-989-758-490-9
Copyright
c
2021 by SCITEPRESS – Science and Technology Publications, Lda. All rights reserved
629
The problem of assessing and predicting ADLs is
not new. It is the focus of several works using
physical and physiological predictors (Gobbens &
van Assen, 2014), activity recognition through
wearable sensors (Stikic et al., 2008), surveys (Min et
al., 2017) and diagnoses (Faurot et al., 2014).
Clinical Decision Support Systems (CDSS) are a
key component of health information systems and
integral part of clinical workflows (Wasylewicz et al.,
2019). While most commercially available CDSS are
rule-based with sets of rules manually implemented
to support guidelines, there is a growing interest in
integrating models created by machine learning (ML)
methods as part of CDSS (Peiffer-Smadja et al.,
2019). Along with triggering alerts, ML-based
models are also used to predict likely outcomes and
help with diagnosing patients (Belard et al., 2017).
One important feature of ML-based CDSS is their
ability to provide evidence in supporting predictions
(alerts, reminders, recommendations). Such evidence
is typically referred to as prediction explanation and
is considered as one of criteria for overall model
transparency. The idea of constructing transparent
machine learning-based models that can explain
predictions is not new and goes back to early machine
learning systems in the 1970s and 1980s (Michalski,
1983). One can consider many reasons for providing
explanations and evidence in supporting predictions.
Most importantly, one needs to gain trust of CDSS
users in the predictions. Users are most likely to act
upon recommendations from CDSS if the system
provides an explanation. Khairat et al. (2018) stated
that “Physicians must be able to support their decision
and are skeptical of recommendations or claims that
lack supporting evidence or transparency.” However,
it is incorrect to assume that the goal of providing
explanations is only to make users trust the
predictions. Since no machine learning-based model
(or any other CDSS) is free of prediction errors
(accuracy < 1.0), one should consider explanations an
integral part of prediction. The decision makers
consider both prediction and provided evidence in
making their final judgement. After reviewing the
evidence, users may be convinced that the prediction
is correct and act accordingly, or that it is not correct
and act in an opposite way. In other words,
explanation is part of prediction. This approach to
providing explanations is implemented in the
presented work and discussed further in Section 4.
There are several contributions of the presented
work. The online tool is based on a set of models that
have been rebuilt from the original CBIT to improve
efficiency. The models have good properties in terms
of accuracy and calibration. The tool is accessible
through the Web as well as an Application
Programming Interface (API). Finally, the tool
attempts to provide explanations of the predictions.
2 MODEL CONSTRUCTION
2.1 Data
Data and model construction followed the process
used previously to construct the original CBIT
models (Wojtusiak et al., 2020). The data consisted of
1,901,354 MDS evaluations completed between 2000
and 2011 with 1,151,222 evaluations for 295,491
patients. MDS data were mapped to nine Barthel
Index categories using a procedure described by
Wojtusiak et al. (2016). The data were then linked to
demographics and history of diagnoses extracted
from medical records. The data consisted of inpatient
and outpatient diagnoses coded using the
International Classification of Diseases, ninth edition
(ICD-9) standard, and were transformed into 281
distinct categories using Clinical Classification
Software (HCUP CCS, 2017). Only patients with at
least two MDS evaluations were included (to access
“previous status”), resulting in a final dataset of
855,731 evaluations for 181,213 patients. The final
data consisted of 578 attributes. The patient cohort
was split into training (90%) and testing (10%)
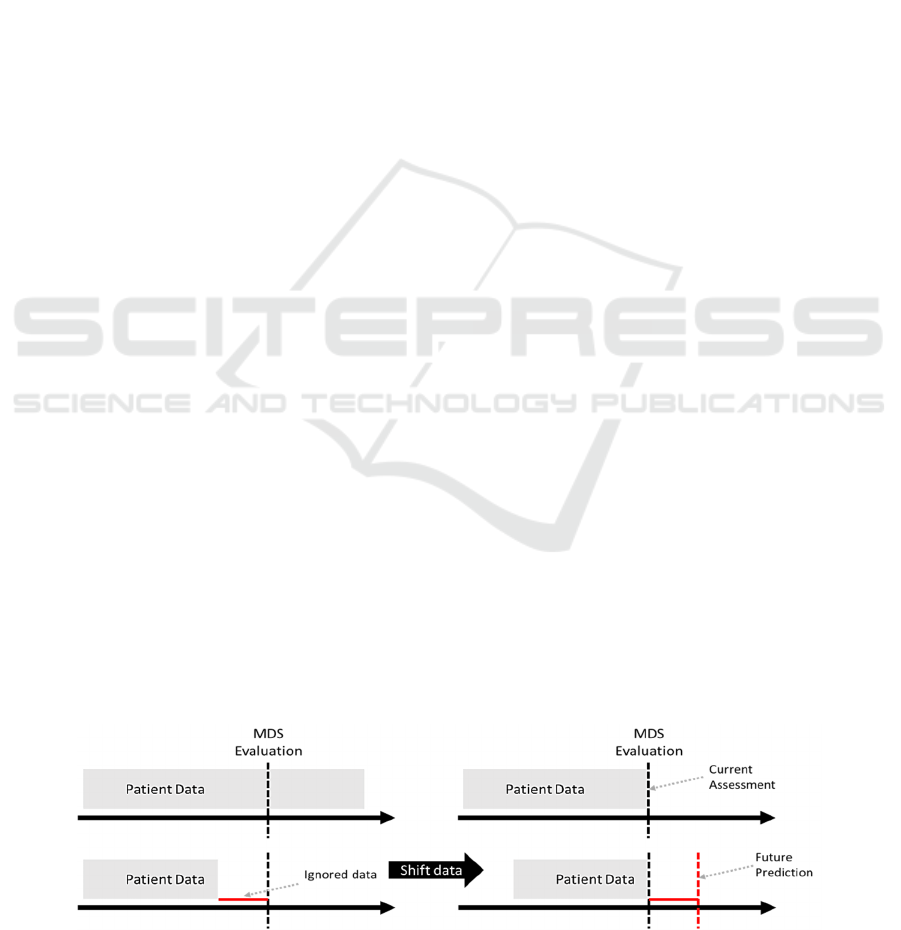
datasets. The data were shifted in time by 30, 90, 180
and 360 days to move the prediction horizon for
constructing models that predict future ADLs (Figure
1). It simulates situation in which outcomes (ADLs)
Figure 1: Preprocessing of data to allow for modeling of future outcomes (ADLs).
HEALTHINF 2021 - 14th International Conference on Health Informatics
630
are assessed after certain number of days. These
timepoints were selected based on clinical judgement.
In the original CBIT as well as here, diagnoses
were coded to include the number of days between
the first as well as the last occurrence of diagnosis to
evaluation time. This simple yet effective temporal
coding system is shown to significantly outperform
standard binary (one-hot) coding in which 0/1
variables are used to indicate the presence or absence
of a condition. More specifically, each diagnosis code
CCS
i
is transformed into two attributes CCS
i
max
(the
number of days between when the diagnosis was
present in patient’s record for the first time and the
prediction time) and CCS
i
min
(the number of days
between when the diagnosis was present in patient’s
record most recently and the prediction time).
2.2 Supervised Learning
Supervised machine learning was applied to construct
a total of 72 models for predicting functional status:
four time points, nine ADLs, Evaluation/Re-
Evaluation models. Specifically, there are 36 output
attributes (dependent variables) for which models are
constructed: {Bathing
0
, Bathing
90
, … Walking
180
,
Walking
360
}. Evaluation models are intended to be
used for patients for whom previous functional status
is unknown. The models use demographics and
diagnoses for assessment and prediction. Re-
Evaluation models are intended for patients for whom
previous functional status is known, and it is included
as nine previous ADL attributes along with other
variables.
When constructing the original CBIT, several ML
methods were investigated, including Logistic
Regression, Decision Trees, Naïve Bayes, and
Random Forest, leading to the selection of Random
Forest (RF) as the top performing algorithm.
Hyperparameters were tuned within 10-fold cross-
validation and models were calibrated using 5-fold
cross-validated isotonic regression. These models
were based on the full set of 578 input attributes.
Further, a set of limited models was constructed based
on top 50 patient characteristics as ranked by feature
importance of RF models. These models do not
perform statistically significantly worse than the
original full models.
2.3 Random Forest vs. Gradient Boost
The initial model selection resulted in Random Forest
(RF) achieving the best performance. The 72
constructed models achieved good accuracy, were
well calibrated and ready for deployment in the
decision support tool. The downside of using RF was
model size with each single model being between
1GB and 2GB, totaling about 100GB for all models.
The size of models made them infeasible for use as
part of the online decision support tool. The server
running the tool would need to have 128GB+ of RAM
if all the models were all loaded at the same time.
Alternatively, the models could be loaded
sequentially as the predictions are made.
Unfortunately, the latter approach is extremely slow,
and prediction of a single case took more than 10
minutes making it unusable as a decision support tool.
To address this issue, Gradient Boost (GB)
models were created for the use within the decision
support tool. The GB models are significantly smaller
in size and can be easily incorporated in the online
tool. Experimental results show that RF ad GB
provide comparable results with an overall R2 =0.92
and Kappa=0.86 across all 72 models. This is also
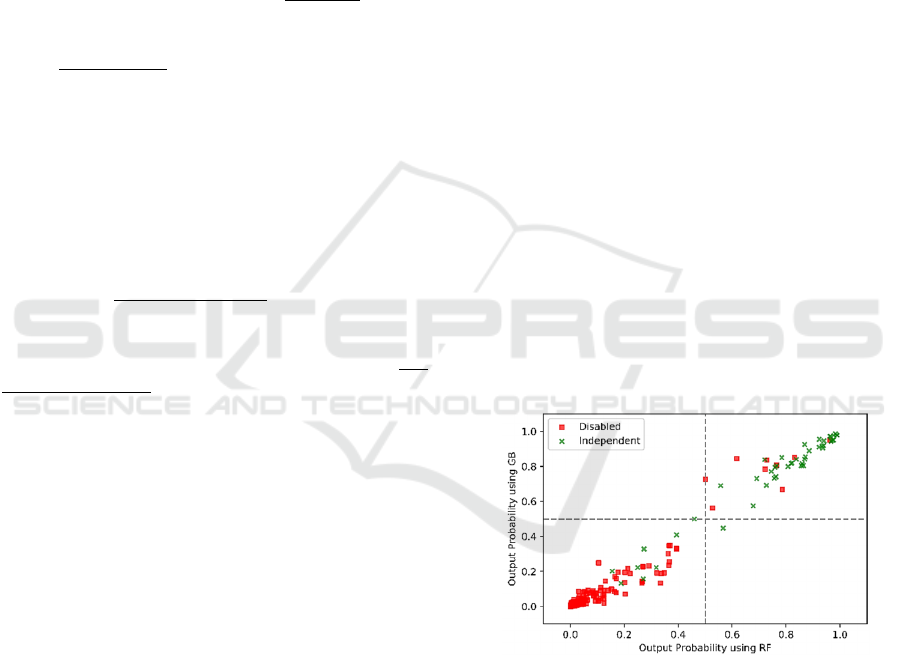
illustrated in terms of one model (evaluation of
Bathing) scatterplot from 1000 randomly selected
testing patients in Figure 2.Colors are used to indicate
true class, thus green points in the upper right portion
of the plot are correctly classified by both models
functionally independent patients. Red points in the
bottom left part of the plot indicates correctly
evaluated by both models as disabled patients.
Scatterplots for other models show similarly high
correlation between models. This shows an overall
very high level of agreement between the models.
Figure 2: Comparison on outputs from RF and GB models
on a subset of testing data.
2.4 GB Model Evaluation
Both Evaluation and Re-Evaluation GB models
achieved high accuracy. The Evaluation models for
assessing current status achieved average AUC of
0.79 (0.77-0.80), accuracy of 0.74 (0.70-0.79), recall
of 0.78 (0.58-0.93), and precision of 0.75 (0.67-0.82).
The Re-Evaluation models achieved average AUC of
0.95 (0.94-0.96), accuracy of 0.91 (0.90-0.92), recall
of 0.91 (0.86-0.95), and precision of 0.92 (0.88-0.94).
Online Decision Support Tool that Explains Temporal Prediction of Activities of Daily Living (ADL)
631
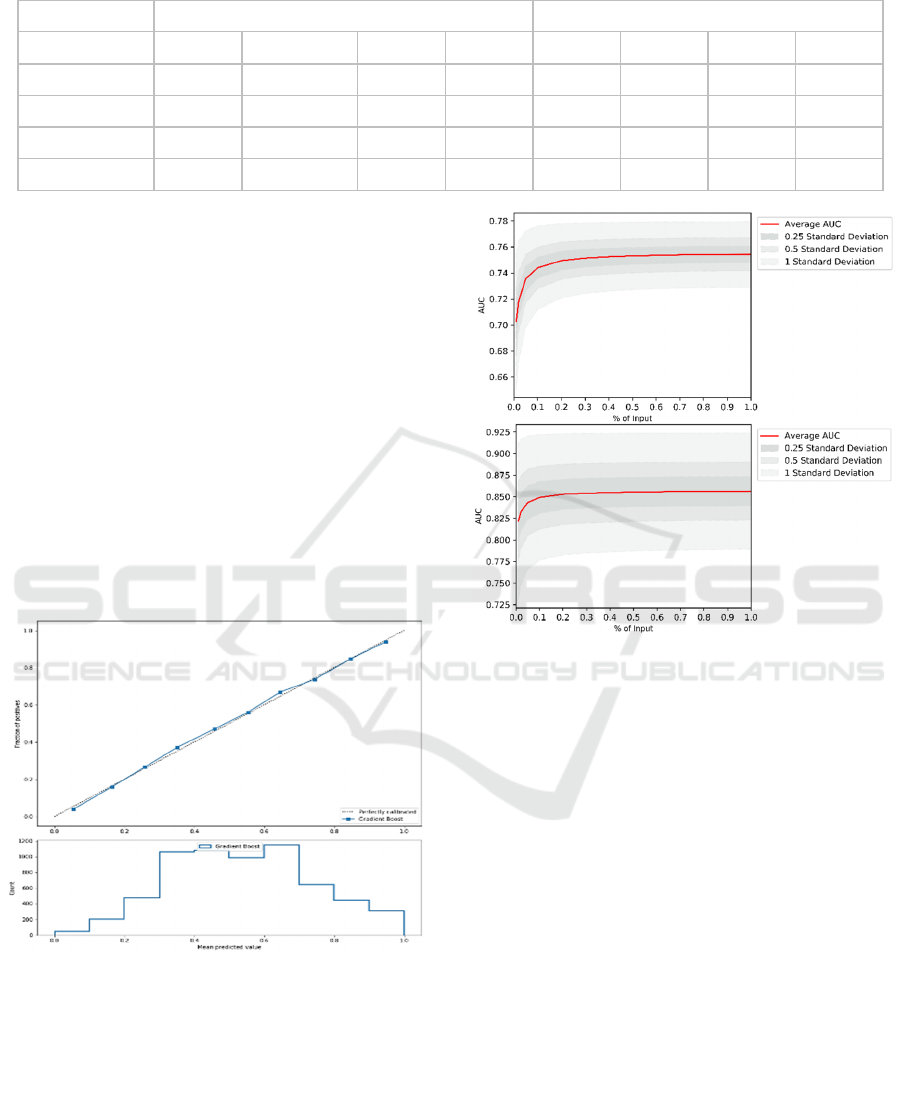
Table 1: Evaluation results of Gradient Boost models. The numbers are average for nine ADSs.
Re-Evaluation Models
Evaluation Models
Prediction Time
Accuracy
AUC
Precision Recall
Accuracy AUC
Precision
Recall
Current
.91.01
.95.01
.92
.02
.91
.03
.74
.03
.79
.01
.75.05
.78.13
3 Months
.82.02
.88.01
.87
.02
.80
.08
.72
.04
.76
.01
.74.05
.77.16
6 Months
.76.03
.81.01
.80
.03
.72
.16
.72
.04
.74
.01
.71.06
.72.22
12 Months
.74.03
.78.02
.75
.05
.70
.2
.72
.04
.73
.02
.70.08
.69.27
It is also clear that predicting some ADLs is easier
(i.e. bathing) than others (i.e. eating). For example,
current evaluation of bathing achieved AUC of 0.80,
while it was 0.77 for eating. Further, the accuracy of
the models decreases with time. When evaluating
patients for the first time, the average AUC (over nine
ADLs) is about 0.79 and drops to about 0.73 when
predicting a year ahead. Similarly, when re-
evaluating patients, the average AUC is 0.95 that
drops down to 0.78 when predicting a year ahead.
The developed models also have good properties.
They are well-calibrated, which allows for probability
interpretation of model outputs. Consequently, users
can interpret results as likelihood of independence.
This also increases prediction transparency as
discussed in Section 4. An example of calibration plot
for one of the 72 models is shown in Figure 3.
Figure 3: Example calibration plot for one of 72 models
used in the decision support tool.
The models are constructed using sufficient
amount of data, as shown in two aggregate learning
curves in figure 4. The curves represent average
values for Evaluation (top) and Re-Evaluation models
(bottom). The complete set of all calibration curves
and learning curves along with details of all
experimental results are available on the tool website.
Figure 4: Average learning curves for Evaluation and Re-
Evaluation models.
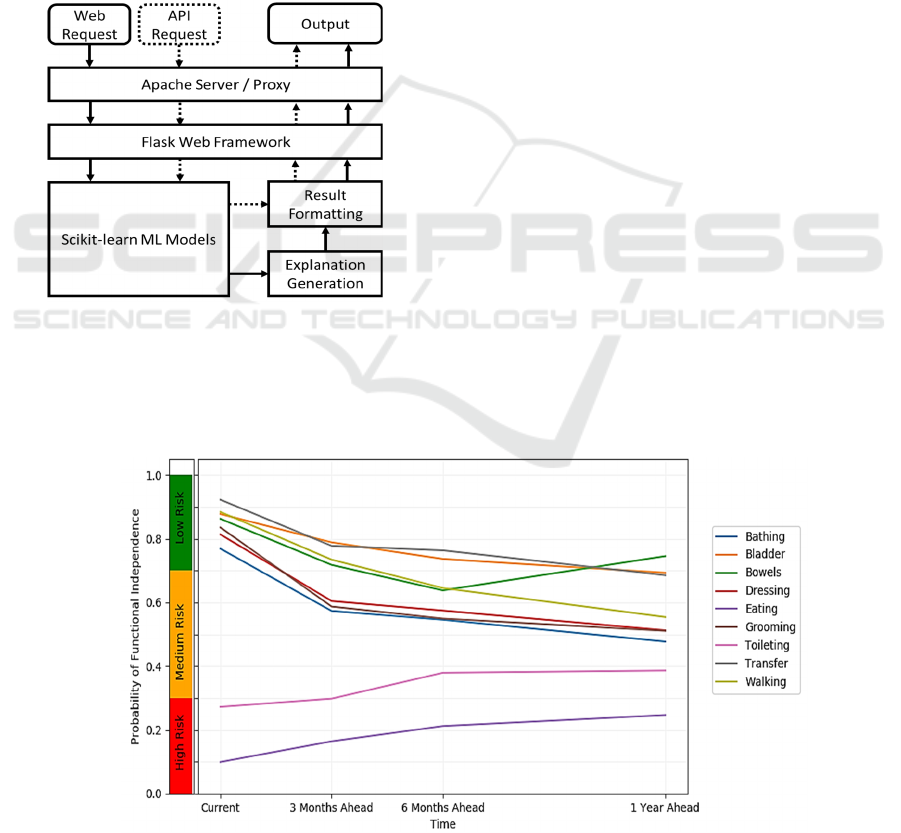
3 ONLINE DECISION SUPPORT
The 72 constructed CBIT models are part of a
publicly available online decision support system.
The system is accessible at https://hi.gmu.edu/cbit.
The general design of the system is depicted in
Figure
5
. It provides Web interface as well as Application
Programming Interface (API). Requests to both are
passed through Apache web server (Apache HTTP
Server Project, n.d.) that acts as a proxy to Flask Web
Framework, thus providing additional security by not
exposing Flask to the world. Web requests are
submitted from an HTML form, while API requests
are submitted as JSON (JavaScript Object Notation).
The CBIT models are created using Scikit-learn
library (Pedregosa et al., 2011) which is also used to
execute them within the tool. The explanation
generation is a custom code written in Python that
uses sensitivity analysis and a set of templates to
generate results. Similarly, the final result formatting
is a combination of Python code with HTML
HEALTHINF 2021 - 14th International Conference on Health Informatics
632
templates. The results of Web requests are formatted
as an HTML page and displayed to the user, while the
results of API requests are returned as JSON.
The Web form (available at the tool website:
https://hi.gmu.edu/cbit) used to insert data is split into
two sections that correspond to Evaluation and Re-
Evaluation models. Previous known functional status
is pre-set as fully independent. Age is pre-set to 71,
which is the mean value in the data. Time from
diagnosis can be entered as a number of days or
selected from pre-populated list (last week, last two
weeks, last month, last three months, last six months,
last year, last three years, and more than three years).
Such increasing in time interval size corresponds to
how people think about continuous values with higher
precision closer to zero.
Figure 5: General architecture of the online decision
support tool.
Application Programming Interface (API)
requests are made by passing model input data in the
form of JSON message. JSON format is the same as
the dictionary data structure in Python, which makes
parsing easy. The message consists of all or selected
patient characteristics as exemplified below:
{'pre_eating':5,'pre_bladdercontrol':10,
'pre_walking':0, 'pre_bathing':5,'ccs653_min':40,
'age':92.0, 'ccs159_min':53, 'ccs199_max':450,
'ccs45_min':10, 'ccs657_max':670, 'ccs111_min':20}
ML-based models produce results regardless of
consistency of inputs, as long as the library (here
Scikit-learn) is able to handle them. For example, one
may run models on negative patient’s age, time of
diagnosis prior to any data being possible, etc. A
simple set of rules can prevent user from inserting
such data. However, this is not sufficient. Data may
seem to be reasonable but be significantly different
from what was used to train models. While ML-based
models are expected to generalize training data, it is
impossible to tell how the models behave for data that
is very different from training examples. The
presented tool implements a simple method to check
the input against training data, and provides warnings
when input is outside of the training data range, as
well as outside of 90
th
and 95
th
percentile of values. It
is being extended by an approach that checks for
combinations of attributes through calculating
distance from clusters of data.
The results of prediction are presented in a
graphical form as one in Figure for a hypothetical
patient. On the plot, the prediction results are shown
as the probabilities of full functional independence
vs. any level of disability. The higher the value is, the
more likely the patient is to be independent. The
probability interpretation of results is reasonable
because of the model calibration previously
discussed in Section 2.2. However, the probability of
Figure 6: Visualization of the predicted ADL independence trajectories for a hypothetical patient.
Online Decision Support Tool that Explains Temporal Prediction of Activities of Daily Living (ADL)
633

full independence should not be confused with the
level of independence, which is not calculated by the
tool. Providing probabilities of the patients being
independent rather than the definitive predictions is
intended to make the tool more transparent and allow
clinicians have meaningful discussion with patients
and their families about what is likely to happen. For
example, the hypothetical patient in Figure 6: is
predicted to have a high risk of not being independent
in toileting (low probability <0.3 of full
independence). The probability of full independence
slightly increases with time, but the risk remains
high/medium. In terms of all other ADLs, the patient
is predicted to have low risk of disability (high
probability >0.7 of independence) with the risk
slowly increasing with time.
In addition to the graphical form, textual
description of the plot is presented. The descriptions
follow a template that states the current status and
describes its change over time. The current status is a
simple mapping of probability of independence on
risk levels. The change over time is calculated by
fitting a linear model:
p
t
= αt+β (1)
where p
t
is the predicted probability of independence
at the time t. The coefficient α > 0.1 indicates that the
patient is likely to improve over time, α < -0.1
indicates that the patient is likely to decline over time
and α[-0.1, 0.1] means that the patient’s overall
chance of being independent does not change. The
intercept β is not used in the description. Further, the
approach detects a temporary change in the predicted
probability if values change by more than 0.1 and
then return to be closer to the original value. The
method for generating descriptions is exemplified by
three ADLs as shown below. Toileting and Bathing
are predicted to permanently change, while Bowels
are predicted to have only a temporary change.
Toileting: The currently assessed risk of functional
disability is high based on probability of full
independence estimated as 27%. There is an overall
increase trend in the predicted probability of full
independence within one year by about 12% (lower risk).
Bathing: The currently assessed risk of functional
disability is low based on probability of full
independence estimated as 76%. There is an overall
decrease trend in the predicted probability of full
independence within one year by about 25% (higher
risk).
Bowels: The currently assessed risk of functional
disability is low based on probability of full
independence estimated as 86%. The chance of disability
temporarily drops to 63% at 180 days.
Box 1: Example text that describes prediction results.
4 PREDICTION EXPLANATION
The presented tool attempts to explain the results by
linking them to the information provided on the Web
form. Such explanation can be viewed as presentation
of prediction results in the context of patient
diagnoses. More specifically, the method assesses
and depicts strength of the influence of diagnoses on
the predicted probabilities.
There is broad literature on model transparency,
interpretability, trust and prediction explanations. It is
important to distinguish between model
interpretability and explanation, and prediction
explanation. A good framework for distinguishing
between different types of explanations has been
proposed by Guidotti et al. (2018). The authors
consider three distinct problems: model explanation
that aims at explaining model globally, typically
through mapping it to a transparent form; outcome
explanation (prediction explanation) in which
explanation is provided for prediction result of one
specific instance (focus of this work); and model
inspection that allows for investigating specific
properties of the model.
There are numerous existing approaches for
explaining predictions available in the literature. In
most cases these are considered as “reverse
engineering” approaches because a model is treated
as a black box and the explanation is based on how
changes in inputs affect outputs. Among the most
frequently used local explanation methods are LIME
(Local Interpretable Model-agnostic Explanations),
LORE (Local Rule-based Explanations), and SHAP
(Shapley Additive exPlanations). While based on
different theoretical bases, all three methods are
similar in the way they locally sample models and
construct surrogate models. LIME generates random
synthetic data in the neighborhood of the instance
being explained and fits a linear model to that data
(Ribeiro et al., 2016). Coefficients of that model are
used to explain the local prediction. Similarly, LORE
generates synthetic data in the neighborhood of the
instance being explained (through genetic algorithm
rather than randomly) and constructs a decision tree
from that data. The tree is consequently converted to
a set of rules given as an explanation. SHAP uses
Shapley values that estimate individual contributions
of attributes through game theory (Lundberg and Lee,
2016). Further, many prediction explanation
approaches have been developed to work specifically
with certain types of models. Recent literature mainly
covers neural networks and specific types of data,
such as images (Du et al., 2019). Finally, a number of
authors claim the need for causality in explaining
HEALTHINF 2021 - 14th International Conference on Health Informatics
634
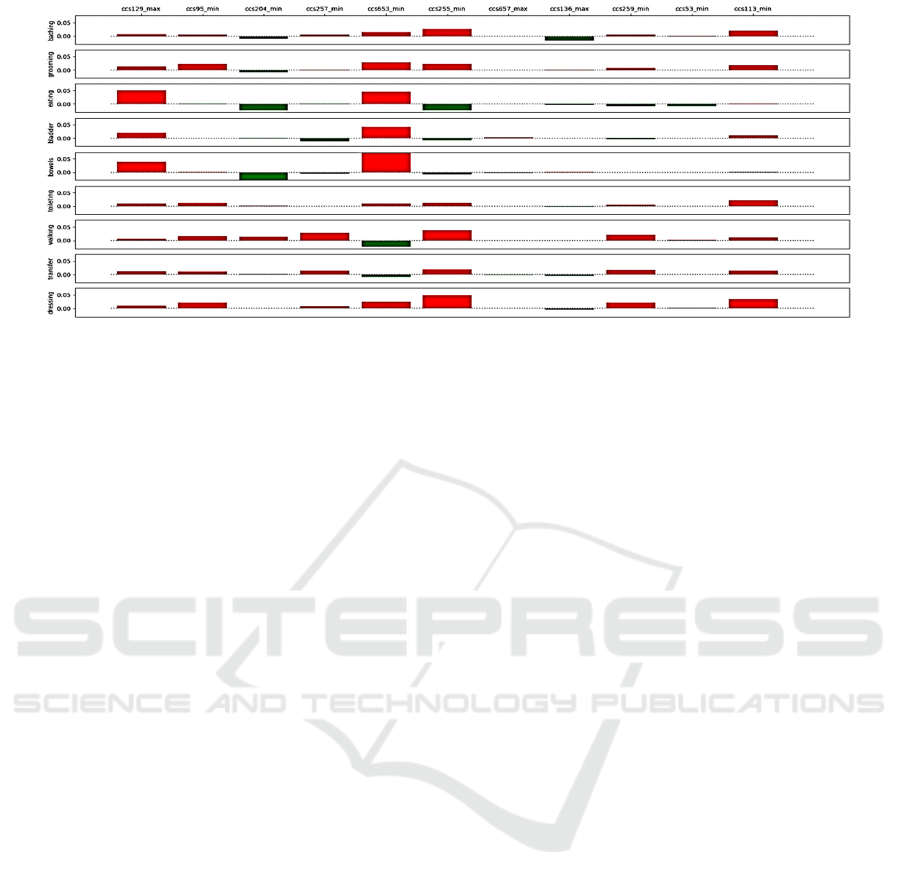
Figure 7: Visualization of the influence of patient diagnoses on the predicted independence in performing ADLs.
predictions (Pearl, 2019; Richens et al., 2020),
specifically important in medical domain such as
differential diagnosis.
In the presented work, a simple approach similar
to LIMIE is used, but which does not rely on
construction of a secondary model. Instead, it
calculates direct change in probability based on
present patient diagnoses. The key observation for
this method is that the explanation problem is not
symmetric with respect to diagnoses, i.e., one should
consider explanation based on diagnosis present in a
given patient, and not simulate what would happen if
the patient had more conditions. Such an approach is
reasonable, because it grounds explanation in what is
known about the patient. For example, consider a
model that predicts that a patient is fully independent
in terms of walking, and justifies the prediction with
the strongest predictor as not having a leg fracture.
This is not a reasonable way of providing explanation.
The leg fracture is one of many possible causes of
walking impairment. In contrast, it is reasonable to
explain prediction of not being independent by listing
fractured leg as a reason. One exception, used in the
proposed tool, is based on lack of any patient
characteristics that could justify patient being not
independent. Further, the influence of diagnoses on
ADLs can be positive or negative as the presence of a
diagnosis can increase or decrease the probability of
functional independence. The influence is typically
different for different ADLs and changes with time.
In the presented tool, new synthetic cases are
generated through single-parameter (a.k.a. first-
order) sensitivity analysis which simulates changes to
the models’ outputs based on changes in one input at
a time. Changes are made by iteratively removing
patient characteristics or diagnoses present in the
model input. Strength of a predictor is estimated as a
difference between the probability of independence in
the original instance and the synthetic one. This
method creates a 3-dimensional tensor that includes
change of probabilities of nine ADLs over time for all
present diagnoses. To visualize this 3-dimensoinal
result, the influence of the diagnoses is (1) averaged
over time for a given ADL (depicted in Figure 7), and
(2) averaged over ADLs at a given time.
5 CONCLUSIONS
Once fully developed and tested, the presented online
decision support tool is ultimately intended for the
clinical use to support clinicians in decision making
and having informed discussions with patients, their
caregivers, family members, and other care team
members. The current version of the tool is available
for research and education purposes. Deployment of
the tool in clinical care would need further clinical
testing and regulatory approvals for ML or AI-based
software, which vary across countries (FDA, n.d.).
The presented tool has been originally developed
as a set of Random Forest models, and later changed
to Gradient Boost models. These models provided the
highest accuracy as well as desired properties in terms
of sensitivity and calibration. In the future, one may
investigate the possibility of using recurrent neural
networks (RNNs) in order to create models that
incorporate more detailed temporal relationships
between diagnoses. However, our initial work with
the data indicated that neural networks did not
perform well for the problem, yet further
investigation of reasons is needed.
One potential limitation of the presented work is
that the patient cohort may not generalize to other
settings/institutions. This is known as cross-hospital
generalization, which is a significant problem in the
application of ML methods in healthcare settings (Nie
Online Decision Support Tool that Explains Temporal Prediction of Activities of Daily Living (ADL)
635

et al., 2018). The tool also requires rigorous usability
evaluation and testing in clinical settings.
The decision support tool presented here is a
working laboratory for our team and it is constantly
being updated and extended with new features.
REFERENCES
Apache HTTP Server Project. (n.d.). The Apache Software
Foundation. https://httpd.apache.org/
Belard, A., Buchman, T., Forsberg, J., Potter, B. K., Dente,
C. J., Kirk, A., & Elster, E. (2017). Precision diagnosis:
a view of the clinical decision support systems (CDSS)
landscape through the lens of critical care. Journal of
clinical monitoring and computing, 31(2), 261-271.
Bouwstra, H., Smit, E. B., Wattel, E. M., van der Wouden,
J. C., Hertogh, C. M., Terluin, B., & Terwee, C. B.
(2019). Measurement properties of the Barthel Index in
geriatric rehabilitation. Journal of the American
Medical Directors Association, 20(4), 420-425.
Du, M., Liu, N., & Hu, X. (2019). Techniques for
interpretable machine learning. Communications of the
ACM, 63(1), 68-77.
FDA, Proposed Regulatory Framework for Modifications
to Artificial Intelligence/Machine Learning (AI/ML)-
Based Software as a Medical Device (SaMD)-
Discussion Paper and Request for Feedback. (n.d.).
Fried, T. R., Bradley, E. H., Towle, V. R., & Allore, H.
(2002). Understanding the treatment preferences of
seriously ill patients. New England Journal of
Medicine, 346(14), 1061-1066.
Gobbens, R. J., & van Assen, M. A. (2014). The prediction
of ADL and IADL disability using six physical
indicators of frailty: a longitudinal study in the
Netherlands. Current gerontology and geriatrics
research, 2014.
Guidotti, R., Monreale, A., Ruggieri, S., Turini, F.,
Giannotti, F., & Pedreschi, D. (2018). A survey of
methods for explaining black box models. ACM
computing surveys (CSUR), 51(5), 1-42.
Faurot, K.R., Jonsson Funk, M., Pate, V., Brookhart, M.A.,
Patrick, A., Hanson, L.C., & Stürmer, T. (2015). Using
claims data to predict dependency in activities of daily
living as a proxy for frailty. Pharmacoepidemiology
and drug safety, 24(1), 59-66.
HCUP CCS. Healthcare Cost and Utilization Project
(HCUP). March 2017. Agency for Healthcare Research
and Quality, Rockville, MD. www.hcup-us.ahrq.gov/
toolssoftware/ccs/ccs.jsp.
Khairat, S., Marc, D., Crosby, W., & Al Sanousi, A. (2018).
Reasons for physicians not adopting clinical decision
support systems: critical analysis. JMIR medical
informatics, 6(2), e24.
Lundberg, S. M., & Lee, S. I. (2017). A unified approach to
interpreting model predictions. In Advances in neural
information processing systems (pp. 4765-4774).
Mahoney, F.I., & Barthel, D. W. (1965). Functional
evaluation: the Barthel Index: a simple index of
independence useful in scoring improvement in the
rehabilitation of the chronically ill. Maryland state
medical journal.
McCarthy, E. P., Phillips, R. S., Zhong, Z., Drews, R. E., &
Lynn, J. (2000). Dying with cancer: patients' function,
symptoms, and care preferences as death
approaches. Journal of the American Geriatrics
Society, 48(S1), S110-S121.
MDS 3.0 Technical Information. (n.d.). Retrieved October
26, 2020, from https://www.cms.gov/
Michalski, R. S. (1983). A theory and methodology of
inductive learning. In Machine learning (pp. 83-134).
Springer, Berlin, Heidelberg.
Min, H., Mobahi, H., Irvin, K., Avramovic, S., &
Wojtusiak, J. (2017). Predicting activities of daily
living for cancer patients using an ontology-guided
machine learning methodology. Journal of biomedical
semantics, 8(1), 39.
Nie, A., Zehnder, A., Page, R. L., Zhang, Y., Pineda, A. L.,
Rivas, M. A., ... & Zou, J. (2018). DeepTag: inferring
diagnoses from veterinary clinical notes. NPJ digital
medicine, 1(1), 1-8.
Pearl, J. (2019). The seven tools of causal inference, with
reflections on machine learning. Communications of
the ACM, 62(3), 54-60.
Pedregosa, F., Varoquaux, G., Gramfort, A., Michel, V.,
Thirion, B., Grisel, O., ... & Vanderplas, J. (2011).
Scikit-learn: Machine learning in Python. the Journal
of machine Learning research, 12, 2825-2830.
Peiffer-Smadja, N., Rawson, T. M., Ahmad, R., Buchard,
A., Pantelis, G., Lescure, F. X., ... & Holmes, A. H.
(2019). Machine learning for clinical decision support
in infectious diseases: a narrative review of current
applications. Clinical Microbiology and Infection.
Ribeiro, M. T., Singh, S., & Guestrin, C. (2016, August). "
Why should I trust you?" Explaining the predictions of
any classifier. In Proceedings of the 22nd ACM
SIGKDD international conf. on knowledge discovery
and data mining (pp. 1135-1144).
Richens, J. G., Lee, C. M., & Johri, S. (2020). Improving
the accuracy of medical diagnosis with causal machine
learning. Nature communications, 11(1), 1-9.
Stikic, M., Huynh, T., Van Laerhoven, K., & Schiele, B.
(2008, January). ADL recognition based on the
combination of RFID and accelerometer sensing. In
2008 second international conference on pervasive
computing technologies for healthcare (pp. 258-263).
Wasylewicz, A. T. M., & Scheepers-Hoeks, A. M. J. W.
(2019). Clinical decision support systems. In
Fundamentals of Clinical Data Science (pp. 153-169).
Springer, Cham.
Wojtusiak, J., Levy, C. R., Williams, A. E., & Alemi, F.
(2016). Predicting functional decline and recovery for
residents in veterans affairs nursing homes. The
Gerontologist, 56(1), 42-51.
Wojtusiak, J., Asadzadehzanjani, N., Levy, C., Alemi, F.,
Williams,A., Computational Barthel Index: An Autom-
ated Tool for Assessing and Predicting Activities of Dai-
ly Living Among Nursing Home Patients, BMC Medical
Informatics and Decision Making, 2020 (in press).
HEALTHINF 2021 - 14th International Conference on Health Informatics
636
