Supervised versus Self-supervised Assistant for Surveillance of Harbor
Fronts
Jinsong Liu
a
, Mark P. Philipsen
b
and Thomas B. Moeslund
c
Visual Analysis and Perception Laboratory, CREATE, Aalborg University, 9000 Aalborg, Denmark
Keywords:
Safety, Drowning, Surveillance, Thermal Imaging, Deep Learning, Human Detection, Anomaly Detection.
Abstract:
Drowning in harbors and along waterfronts is a serious problem, worsened by the challenge of achieving
timely rescue efforts. To address this problem, we propose a privacy-friendly assistant surveillance system
for identifying potentially hazardous situations (human activities near the water’s edge) in order to give early
warning. This will allow lifeguards and first responders to react proactively with a basis in accurate infor-
mation. In order to achieve this, we develop and compare two vision-based solutions. One is a supervised
approach based on the popular object detection framework, which allows us to detect humans in a defined
area near the water’s edge. The other is a self-supervised approach where anomalies are detected based on
the reconstruction error from an autoencoder. To best comply with privacy requirements both solutions rely
on thermal imaging captured in an active harbor environment. With a dataset having both safe and risky
scenes, the two solutions are evaluated and compared, showing that the detector-based method wins in terms
of performances, while the autoencoder-based method has the benefit of not requiring expensive annotations.
1 INTRODUCTION
More than 40 people drown every hour of every day.
Drownings typically occur when children fall into
ponds, pools or wells; passengers or workers fall over-
board or sink with ships; as a consequence of floods or
when people are drunk in the vicinity of water (WHO,
2014). Clearly, the causes of drowning accidents are
many, as are the solutions. Here, we specifically want
to address the deaths that can be prevented in urban
spaces and industrial areas that are associated with
harbor fronts.
A drowning person must be rescued within a few
minutes. Unfortunately, it takes around 6 minutes
from the authorities being alerted till a rescue boat
is in the water (TrygFonden et al., 2018). This
means the chance of a successful rescue is greatly im-
proved by early preparations and accurate knowledge
of the person’s position. This calls for a precautionary
surveillance system to provide early warnings for haz-
ardous situations in critical areas like Figure 1 shows.
Such a surveillance system is mostly fulfilled by
manual video surveillance now. However, contin-
uously monitoring large areas of waterfronts manu-
a
https://orcid.org/0000-0002-5231-6950
b
https://orcid.org/0000-0002-9212-2544
c
https://orcid.org/0000-0001-7584-5209
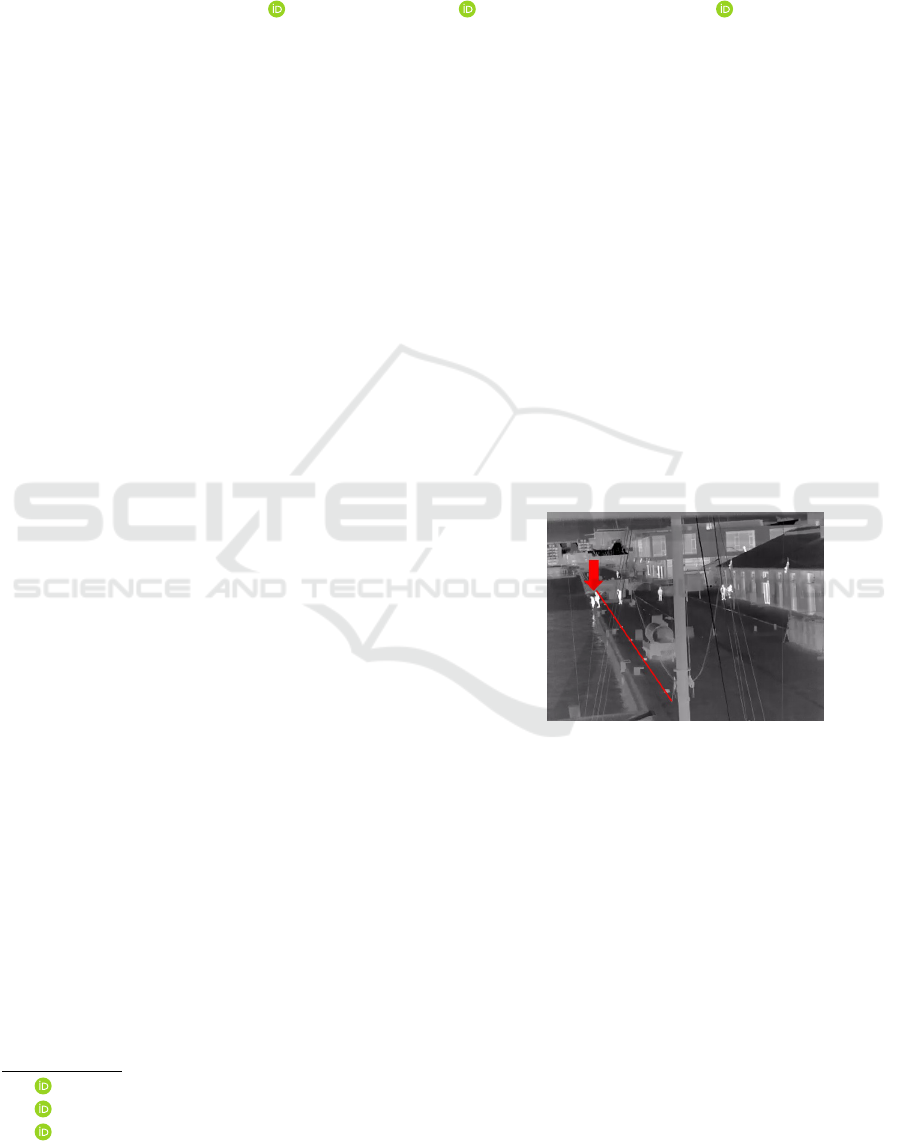
Figure 1: Thermal surveillance imaging for detecting po-
tentially dangerous situations and alerting authorities. An
alert should be raised when someone crosses the red line.
ally is inefficient. If the operators who monitor the
streams can be assisted by an intelligent system, the
efficiency will be much higher. Like a human, the as-
sistant system should be able to understand what is
safe vs. risky or normal vs. abnormal. In order to
grasp the ability, the system must rely on cues corre-
lated with drowning accidents, among which the most
important cue is human activity near the water’s edge.
Relying on this cue, we investigate two alternative so-
lutions based on computer vision and deep learning:
• Supervised human detection: A person’s location
and thus distance to the harbor’s edge is used
to determine whether the surveillance operator
should be notified.
610
Liu, J., Philipsen, M. and Moeslund, T.
Supervised versus Self-supervised Assistant for Surveillance of Harbor Fronts.
DOI: 10.5220/0010323906100617
In Proceedings of the 16th International Joint Conference on Computer Vision, Imaging and Computer Graphics Theory and Applications (VISIGRAPP 2021) - Volume 5: VISAPP, pages
610-617
ISBN: 978-989-758-488-6
Copyright
c
2021 by SCITEPRESS – Science and Technology Publications, Lda. All rights reserved

• Self-supervised anomaly detection: Scenes near
the harbor’s edge are classified as either normal
or abnormal using the reconstruction loss from
an autoencoder. In our case we consider a scene
with any human activity in it to be unsafe, which
should be classified as an anomaly. This solution
is based on the fact that human activity near the
water’s edge is very rare.
The contributions in this work can be summarized
as: An assistant surveillance system realized by two
practical solutions (supervised vs. self-supervised) is
proposed to detect potential drowning accidents from
harbor fronts. The two solutions are evaluated and
analysed with respect to strengths and weaknesses.
2 RELATED WORK
Although most methods, databases, and benchmarks
on detecting people, activities, and anomalies differ
in various ways from our harbor scenario, it is likely
that many of their findings will be useful and can be
transferred from RGB images to thermal images. For
this reason we give an overview of related work.
2.1 Object Detection
With the advent of convolutional neural networks
(CNN), object detection has grown rapidly. A modern
detector usually consists of a backbone which is pre-
trained on large databases like ImageNet (Deng et al.,
2009), a neck composed of several top-down connects
or down-top connects to reuse extracted features, and
a head predicting the objects’ class and bounding box
coordinates. The effectiveness of many mainstream
detectors such as Faster R-CNN (Ren et al., 2015),
SSD (Liu et al., 2016), YOLO (Redmon et al., 2016;
Redmon and Farhadi, 2017; Redmon and Farhadi,
2018; Bochkovskiy et al., 2020; Ultralytics, 2020),
and RetinaNet (Lin et al., 2017b) has been proven in
benchmarks such as MS COCO (Lin et al., 2014) and
PASCAL VOC (Everingham et al., 2010).
Besides working on these general object detection
benchmarks, the detectors are applied to specific sit-
uations, like analyzing soccer matches by detecting
players (Mazzeo et al., 2008), detecting stalled ve-
hicles from moving vehicles to prevent traffic acci-
dents (Shine et al., 2019), detecting pedestrians in au-
tonomous driving context (Guo et al., 2019), moni-
toring social distance by human detection to stop the
spread of epidemics (Punn et al., 2020). Note that the
above applied scenarios are all in RGB mode and the
detectors’ application to thermal mode remains under-
explored.
2.2 Anomaly Detection
Anomalies are generally defined as incidents that are
unusual and rare. This makes it difficult to gather a
large balanced database to train a binary normal vs.
abnormal classifier using supervised learning. Inter-
estingly, with self-supervised learning the unbalanced
nature of the problem can be turned into an advantage.
For this reason, techniques such as autoencoders are
popular for anomaly detection (Hasan et al., 2016;
Chong and Tay, 2017; Nguyen and Meunier, 2019;
Duman and Erdem, 2019; Song et al., 2019; Deepak
et al., 2020).
An autoencoder consists of an encoder and a de-
coder. The encoder learns to produce a compressed
representation of the input, ending in a bottleneck.
The bottleneck is the input to the decoder whose task
is to reconstruct the original input from the com-
pressed bottleneck representation. Both networks are
trained by minimizing the difference between the in-
put and its reconstruction. The core idea of self-
supervised anomaly detection using autoencoders is
to use normal data to train the autoencoder. This re-
sults in the autoencoder learning to faithfully recon-
struct normal data while performing poorly with ab-
normal data. In this way, the reconstruction error can
be used to recognize anomalies, and the unbalanced
nature of the data becomes an advantage.
This kind of methods for anomaly detection have
been applied to datasets such as UCSD (Mahadevan
et al., 2010) and Avenue (Lu et al., 2013). With the
UCSD dataset, the aim is to classify the occurrence of
carts, wheelchairs, skaters, and bikers as anomalies.
With the Avenue dataset, anomalies include running
and walking in the wrong direction as well as walking
with bicycles. Again, note that these datasets are in
RGB mode and the application of anomaly detection
using autoencoders is unexplored when it comes to
thermal mode datasets.
3 CHALLENGES
In order to realize an assistant surveillance system for
raising alarms to prevent drowning accidents, a range
of challenges must be considered. These challenges
include concerns such as privacy, challenges specific
to thermal imaging, and a long tail of rare events.
3.1 Sensitive Data
According to the European general data protection
regulation (GDPR) (Voigt and Von dem Bussche,
2017), personal data should be protected from being
Supervised versus Self-supervised Assistant for Surveillance of Harbor Fronts
611
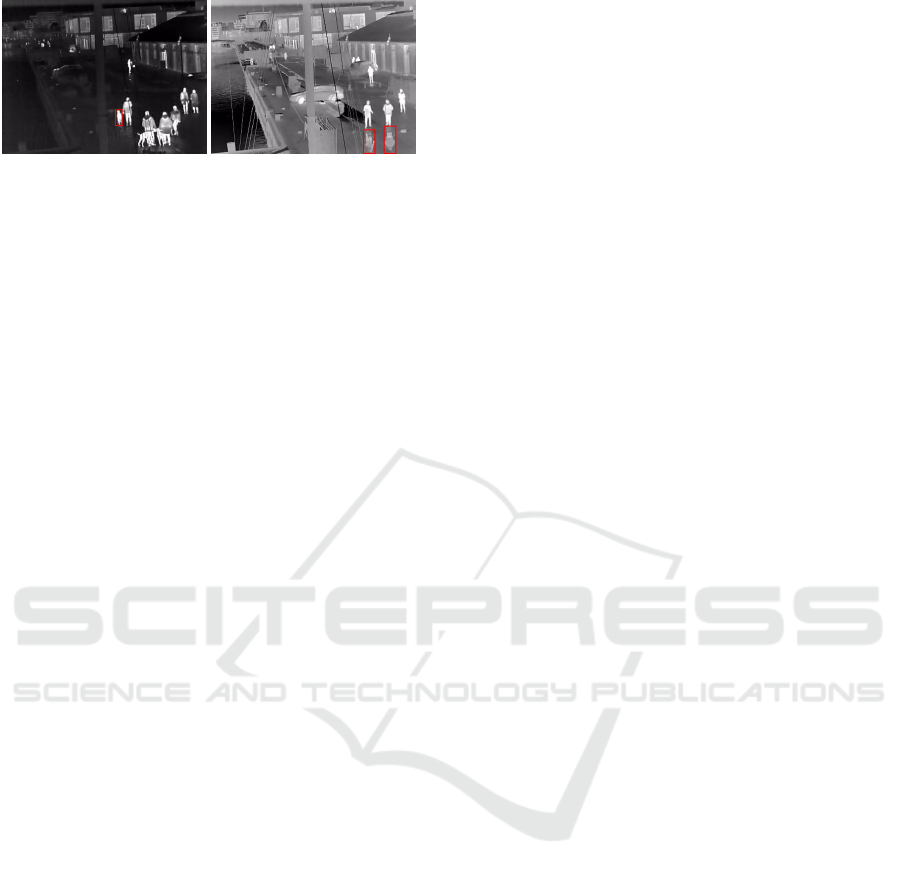
(a) (b)
Figure 2: (a) Animal. (b) Reflection.
invaded and abused. To best comply with this set
of rules, privacy-friendly thermal cameras are used,
making it difficult to recognize a person in captured
images.
3.2 Thermal Imaging
The use of thermal cameras is associated with ben-
efits and drawbacks compared with RGB cameras.
Thermal cameras can be used to capture people both
day and night without the need of light sources. As
thermal cameras rely on thermal radiation, tempera-
ture changes in the scene will influence the imaging.
For instance, during warm days, the environment tem-
perature will approach the temperature of the human
body, resulting in a loss of contrast between the fore-
ground (people) and the background.
The insulating properties of clothing also impact
the appearance of people in thermal images, thus con-
stituting a significant source of variation. Weather-
induced phenomena such as wind, rain, and ice may
also impact cameras installed outside. Moreover, the
spatial resolution of thermal cameras is lower than
visible light RGB cameras, which leads to the chal-
lenge of applying methods intended for high resolu-
tion RGB images to low resolution thermal images
where the size of humans is relatively small.
3.3 Rare Phenomena
Rare and disturbing phenomena pose a challenge
when developing an intelligent system since it is dif-
ficult to anticipate them. Figure 2 provides two ex-
amples from the harbor area: Figure 2(a) shows a red
box around a dog which may be mistaken as a child;
reflections due to water on the ground introduce false
detections, as indicated by the two red boxes in Figure
2(b). Besides, as the same with other scenes, a person
whose body is occluded severely or a person cluttered
with a very similar background will make it difficult
for any detector to work.
4 APPLIED METHODS
As mentioned before, we believe both object detec-
tion and anomaly detection are worth pursuing for
an assistant precaution system. This section will de-
scribe these two methods in detail. The approach
based on object detection is illustrated in Figure 3(a).
It processes frames individually as input and locate
people in the image. If a detection is made on the wa-
ter side of the red boundary, an alarm is raised. Fig-
ure 3(b) illustrates the autoencoder-based approach,
where pixels from the water side of the red boundary
are passed through the autoencoder and an alarm is
raised if the input is poorly reconstructed, signifying
an anomaly—human activity near the water’s edge.
4.1 Supervised Human Detection
To detect a human from a long distance a success-
ful detector should have the ability to tackle small
objects, and we value three aspects that matter to
this ability: anchor boxes, feature reuse, and scales,
which are well designed in YOLOv5 (Ultralytics,
2020)—the applied detector in the harbor scenario.
An anchor box gives the initial size of an object,
and the predicted bounding box is the updated ver-
sion of the anchor box that the object corresponds
to. Therefore, the definition of anchor boxes is crit-
ical in a detector because an improper anchor box
(either too large or too small) not only increases the
prediction time but also leads to missing objects as
this anchor box may have a very low intersection-
over-union (IoU) with any ground truth box. For in-
stance, to get a satisfactory performance on COCO
database, YOLOv3 (Redmon and Farhadi, 2018) uses
k-means clustering algorithm on COCO training set to
define 9 anchors boxes, which emphasizes the impor-
tance of database-adaptive anchor boxes. That’s why
YOLOv5 is utilized here. Its capacity to dynamically
define the amount and sizes of anchor boxes accord-
ing to the training set is of great benefits.
To accurately localize an object, appearance infor-
mation from lower layers of a CNN is greatly help-
ful. But this information may vanish after passing
through multiple layers in a deep network thus in-
creasing the difficulty of object detection, especially
for small objects. Feature reuse can address this prob-
lem by top-down or down-top bypass connections to
combine features from both lower layers and deeper
layers. It is to be noted that if the additional bypass
itself has to go through deep layers, the efficiency of
feature reuse will be reduced. YOLOv5 solves this re-
duced efficiency problem by introducing PANet (Liu
VISAPP 2021 - 16th International Conference on Computer Vision Theory and Applications
612
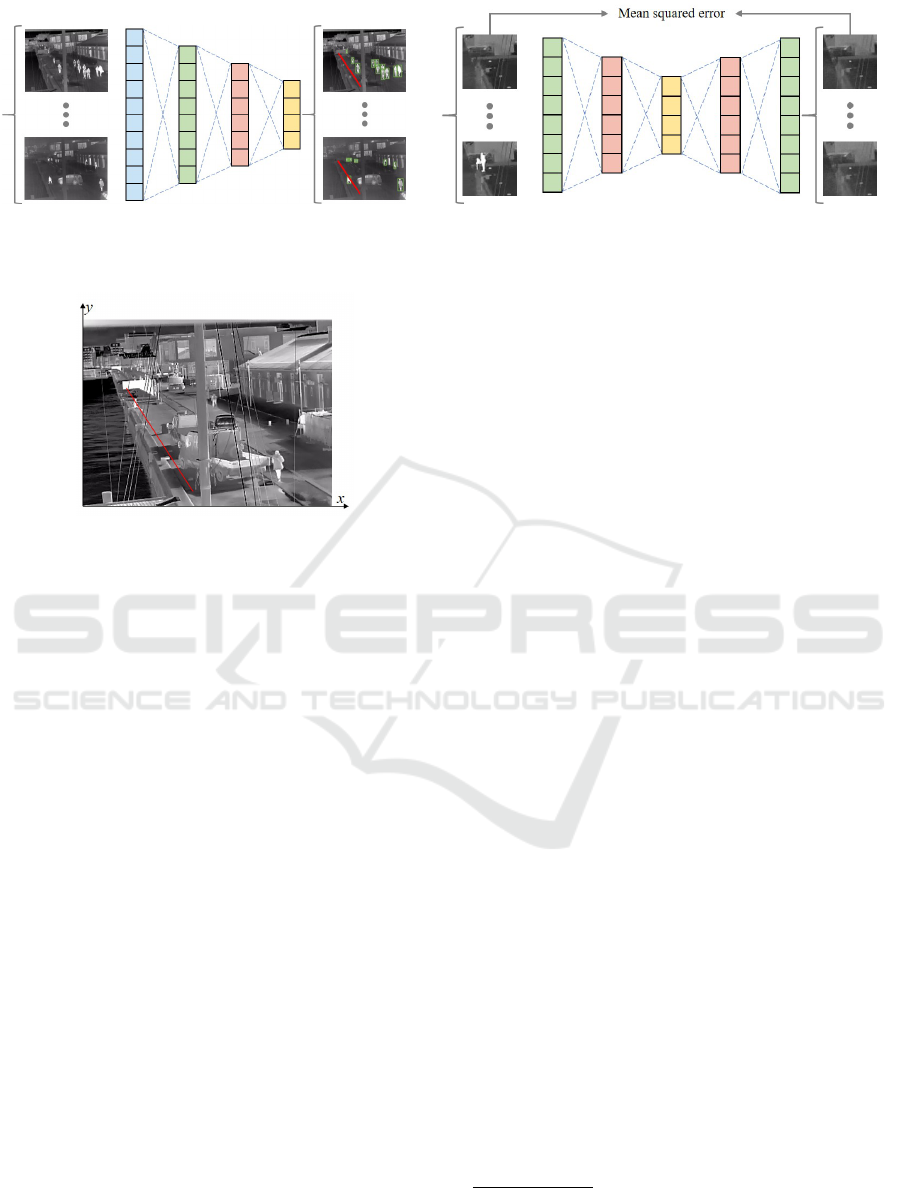
(a) (b)
Figure 3: (a) Object detector where alerts are raised when people are detected on the risky side of the red boundary. (b)
Autoencoder where the reconstruction error is used as an indicator of anomalies.
Figure 4: Alarm region defined as the area between the red
line and the water.
et al., 2018) instead of FPN (Lin et al., 2017a) as its
network neck.
A detector with predictions at only one scale often
fails for objects with different sizes. To address this
issue, a detector should work on several scales, a way
to avoid missing detections of small objects whose
information may disappear in deeper layers. There-
fore, small objects are detected with larger feature
maps while large objects are detected with smaller
feature maps. YOLOv5 predicts outputs on three
scales which have different spatial resolutions, mak-
ing it a good human detector for our task.
Safe vs. Risky Classification
If a person is detected, his/her relative location to
the harbor’s edge is the key to determine whether
an alarm should be raised. Therefore, an alarm re-
gion near the water is predefined empirically. In Fig-
ure 4, the red line represents the alarm boundary ex-
pressed by Equation 1, and the points p1 = (67, 180)
and p2 = (170, 23) are the two endpoints of the line
segment. For a person detected in the xy coordinate
system of the image, if any coordinate (x
p
, y
p
) within
the bounding box results in a z
p
in Equation 2 smaller
than 0, the person is deemed inside the alarm region.
1.53x + y − 283 = 0 (1)
z
p
= 1.53x
p
+ y
p
− 283
(
≥ 0, sa f e
< 0, risky
(2)
4.2 Self-supervised Anomaly Detection
In order to measure human activities in regions near
the water, we train an autoencoder formed by a stan-
dard 9-layer CNN structure, where the 5-layer en-
coder and 5-layer decoder share a bottleneck having 8
channels. In the encoder the convolutional filters in-
crease in numbers (32, 64, 128, 256) while the feature
maps decrease in sizes along with layers going deeper.
Inversely, the decoder consists of transposed convolu-
tions where the filters decreases in numbers (256, 128,
64, 32) and feature maps increase in sizes as the net-
work approaches the output. With exception of the
penultimate layer of the decoder, the output of each
layer is batch-normalized and uses a LeakyReLU ac-
tivation function. And the autoencoder is trained us-
ing normal images consisting of the background with
the Mean Squared Error (MSE) as its loss function
1
.
Reconstruction Error as a Measure of Activity
In order to explore the usefulness of reconstruction
error as a measure of human activity, we use a square
region (of size 64 × 64) near the water’s edge. From
this region 35,809 thermal images with very limited
or no human activities are collected across hours and
then used as normal frames to train an autoencoder.
After training, a continuous sequence of 1250 ther-
mal images, with significant human activities in some
frames, is fed into the autoencoder to explore the
change in reconstruction error over time.
This exploration is illustrated in Figure 5, where
the four images in Figure 5(a) are samples from the 4
locations represented by the red lines in Figure 5(c),
and Figure 5(b) shows the reconstructions by the au-
1
Code at https://github.com/JinsongCV/Supervised-
Versus-Self-supervised-Assistant-for-Surveillance-of-
Harbor-Fronts.
Supervised versus Self-supervised Assistant for Surveillance of Harbor Fronts
613
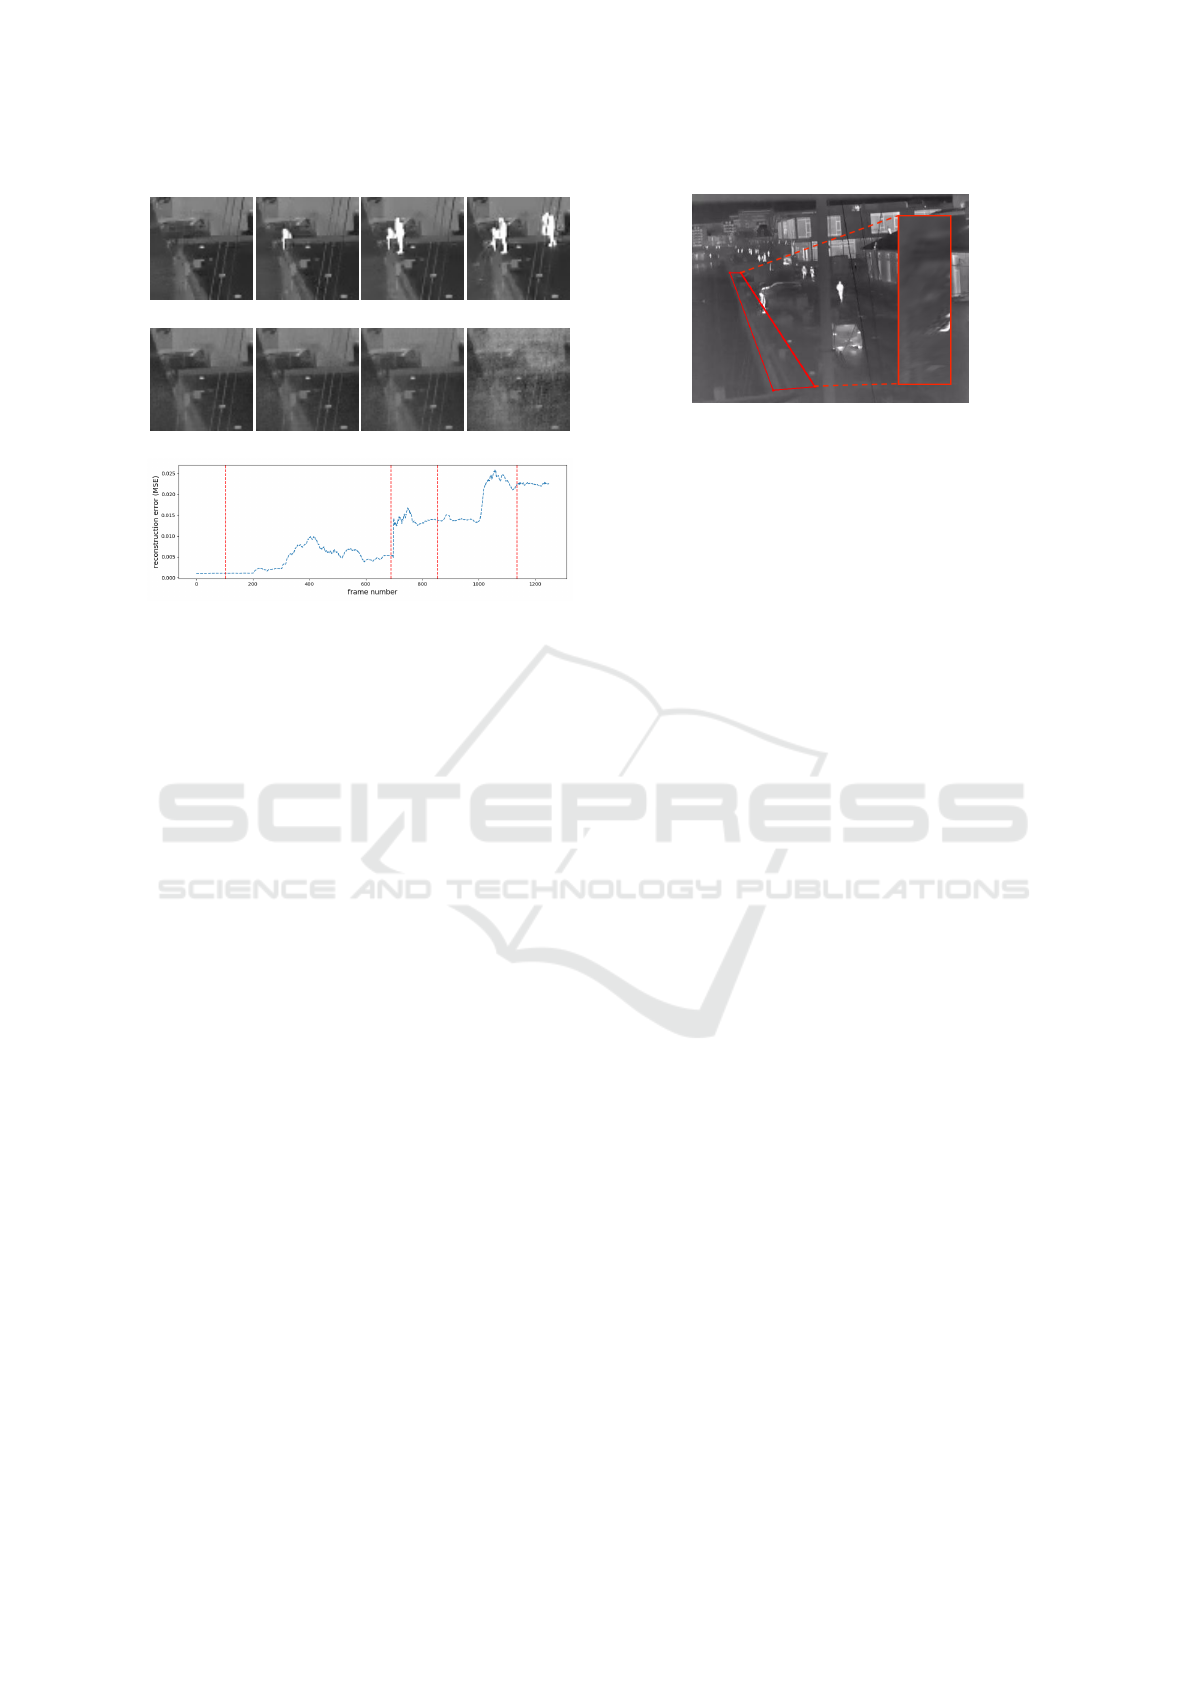
(a)
(b)
(c)
Figure 5: (a) Input patches from the region near the water’s
edge. (b) Corresponding reconstructions from the autoen-
coder. (c) The blue graph illustrates the reconstruction loss
as across the sequence and the vertical red lines correspond
to the samples shown in Figure 5(a) in the same order.
toencoder for their corresponding inputs in Figure
5(a). From Figure 5(b), it is clear that the autoencoder
fails to reconstruct humans. This results in a high re-
construction error represented by the blue graph in
Figure 5(c). As more people enter the area, the er-
ror increases further. This exploration proves the po-
tential for monitoring human activity and detecting
anomalies by self-supervised learning with the recon-
struction error as a measurement.
Normal vs. Abnormal Classification
A threshold, as defined in Equation 3, can be used to
classify the data as normal (safe) or abnormal (risky).
It can be determined either manually or automati-
cally. If determined manually, the threshold will be
based on the tacit knowledge and experience of the
human operator. An automatic threshold can be deter-
mined from a small labeled dataset, where the thresh-
old reaching the desired balance between precision
and recall for anomaly alarms is chosen.
(
MSE < threshold, normal(sa f e)
MSE ≥ threshold, abnormal(risky)
(3)
To enable comparison with the detector-based
method, an alarm region is defined between the red
line segment from Section 4.1 and the edge of the har-
bor (see Figure 6). This region is transformed to a
Figure 6: Region for anomaly detection by the autoencoder.
rectangle (of size 64×192) as the input to the antoen-
coder by using OpenCV’s warpPerspective function.
5 EXPERIMENTS
This section gives the dataset information and experi-
ments to prove the feasibility of both solutions.
The thermal camera is placed below the bridge to
cover a popular walking path. To evaluate the two
methods, the videos (of size 384 × 288) from Febru-
ary 3, 2020 to March 3, 2020 were collected by an au-
thorized computer which protects the data from inva-
sions. Different types of weather (rainy days, snowy
days, windy days, and sunny days) occurred during
this period, making the database more diverse and
less biased. To consider the challenges of contrast,
weather, and rare phenomena mentioned before, we
manually selected and annotated 2358 images, which
were then divided into the training set (1715), valida-
tion set (143), and test set (500). Note that this manual
annotation means labeling bounding boxes for human
detection. Besides, to fairly compare both solutions,
autoencoder-based anomaly detection also uses the
same 2358 images for training and evaluation. The
experimental platform consists of a machine equipped
with a NVIDIA GeForce RTX 2080Ti, Ubuntu 16.04
LTS, CUDA 9.2, Python 3.7.0, and Pytorch 1.6.0.
5.1 Supervised Surveillance Assistant
YOLOv5s (Ultralytics, 2020) is fine-tuned by
stochastic gradient descent with momentum 0.9 from
a pretrained model on COCO dataset. The learning
rate is set as 0.001. The training phase stops at 120th
epoch where the network has converged. Other set-
tings remain the same with the original YOLOv5s.
In the testing phase, the best model on the valida-
tion set is used to do detection on the test set, achiev-
ing an average precision (AP
50
) of 97.70%. Besides
AP
50
, the accuracy of true alarms for risky situations
is also measured. Among the 500 test images, 91 of
them have persons existing in the alarm region defined
VISAPP 2021 - 16th International Conference on Computer Vision Theory and Applications
614
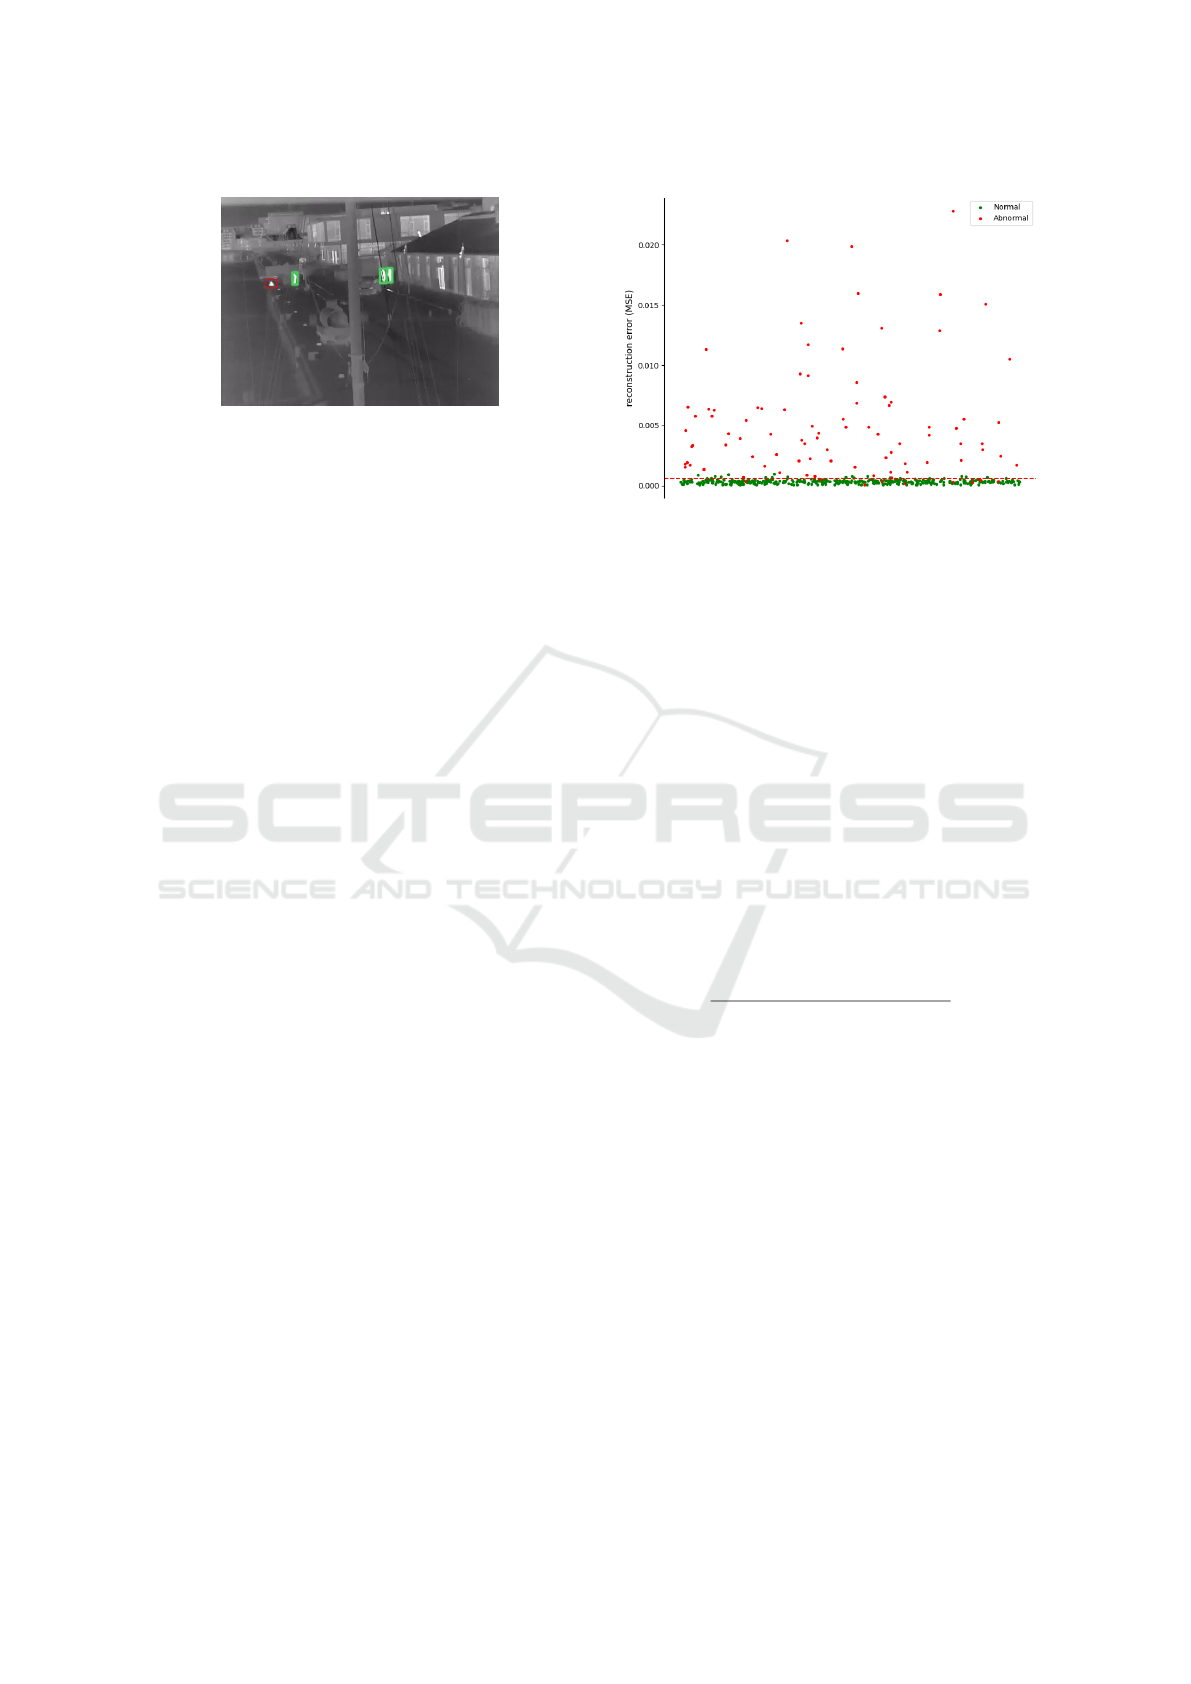
Figure 7: A failed case which should have raised an alarm.
The red box refers to the undetected person.
in Section 4.1. Based on the human locations pre-
dicted by YOLOv5s and Equation 2, 85 out of the 91
images are classified as risky situations and no false
alarms are raised, indicating a recall of 93.41% and a
precision of 100%. All the 6 failed cases are related to
undetected persons having very small sizes. One ex-
ample is shown in Figure 7 where the red box refers
to the undetected person. As YOLOv5s is applied to
frames from videos, it is likely that the undetected
person will be detected in the earlier or later frames.
As a whole, no matter with AP
50
or with alarm rates,
human detection-based method works well.
5.2 Self-supervised Surveillance
Assistant
In order to produce comparable results to the super-
vised surveillance assistant, the alarm region defined
in Figure 6 is cropped and transformed from the same
training set and test set used for the human detec-
tor. The autoencoder is trained from scratch for 200
epochs using the Adam optimizer with a learning rate
of 0.0005. The experiments regarding anomaly de-
tection using an autoencoder includes: (1) Automat-
ically determining a threshold. (2) Investigating the
sensitivity to abnormal data in the training set.
Finding a Suitable Threshold
As mentioned in Section 4.2, a threshold for the re-
construction error can either be determined manually
or automatically. Here, we suggest computing the
threshold by optimizing the F1 score on the training
dataset (including 1628 normal images and 87 abnor-
mal images). With the maximal F1 score of 0.917 this
leads to a threshold at 0.000597 MSE.
Sensitivity to Abnormal Training Data
It is labor-intensive to make sure that the training set
contains only normal patterns. For this reason we
want to investigate the sensitivity of the method to
Figure 8: Distribution of normal (green dot) and abnormal
(red dot) samples along with the decision threshold (red
line). 21 False Positives (FP), 9 False Negatives (FN), 82
True Positives (TP), 388 True Negatives (TN).
small amounts of abnormal data. We compare train-
ing with two datasets, one consists of 1628 normal
patterns, the other consists of 1715 in total (1628 nor-
mal and 87 abnormal images). Table 1 shows the two
versions’ performances on the test set, expressed as
the area under the precision-recall curve (AUC). The
slightly lower performance with the inclusion of ab-
normal images demonstrates the method’s sensitivity
to abnormal training data and supports the suspected
conclusion that the occurrence of abnormal data is
detrimental in the training set.
Table 1: Performance comparison between two models
trained on different datasets. “Normal” is trained on 1628
normal images. “Normal+abnormal” is trained on a set con-
taining an additional 87 abnormal images.
Model AUC
Normal 0.929
Normal+abnormal 0.904
Distribution of Normal and Abnormal Samples
With a threshold at the MSE of 0.000597, the best per-
forming model achieves a recall of 90.11% and a pre-
cision of 79.61% on the test set. Figure 8 shows the
distribution of normal and abnormal samples in the
test set along with the threshold found using the F1
score. We expect normal frames (green dot) to gen-
erally be placed underneath the red line and abnormal
frames (red dot) to be placed above the line.
To further investigate the failures in Figure 8, 4
cases are selected (two correctly and two wrongly
classified) shown in Figure 9. Specifically, Figure
9(a) is a normal image mis-classified as abnormal due
to the higher heat absorption and reflection of the har-
bor’s concretes and metals; Figure 9(c) is an abnormal
Supervised versus Self-supervised Assistant for Surveillance of Harbor Fronts
615
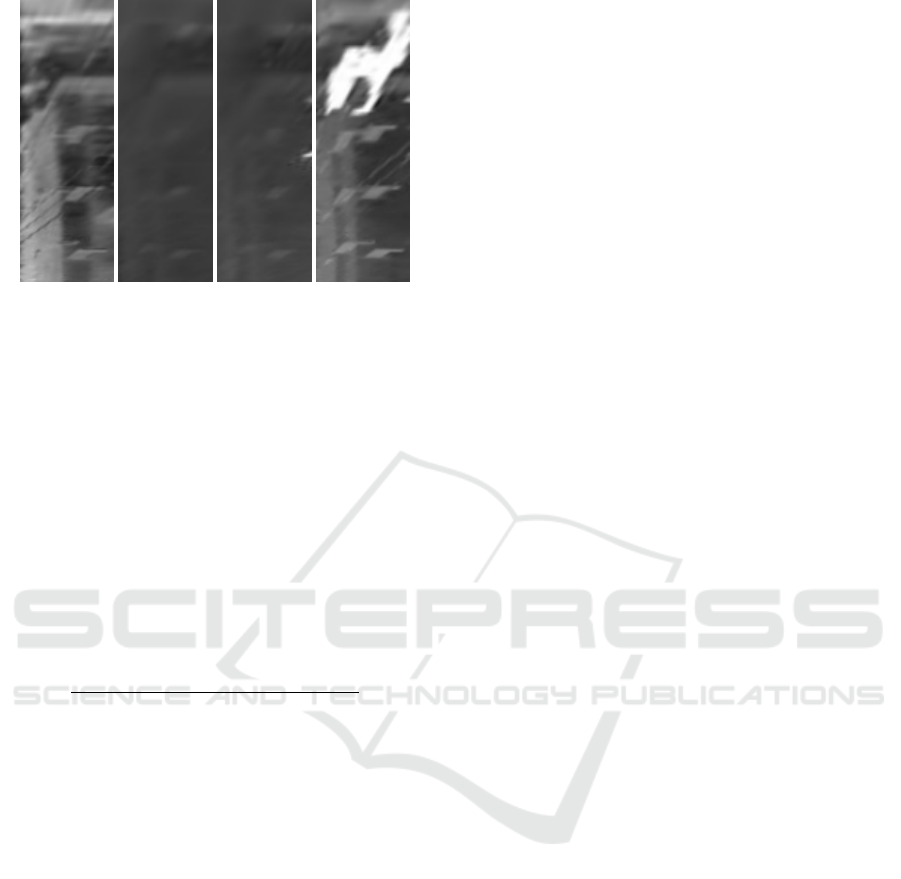
(a) (b) (c) (d)
Figure 9: (a) A normal image with loss of 0.00095. (b) A
normal image with loss of 0.00006. (c) An abnormal image
with loss of 0.00029. (d) An abnormal image with loss of
0.02281.
image mis-classified as normal because of the low sig-
nal of human activity as a person is just entering the
scene from the right side. This indicates the challenge
of providing a reasonable standard of anomaly espe-
cially when a person has just entered the region. As a
contrast, Figure 9(b) and (d) are classified correctly.
Table 2: Performance comparison on the test set having no
entering images. “Normal” and “Normal+abnormal” corre-
spond to the models in Table 1. “Normal+ clean abnormal”
is trained on the training set without entering images.
Model AUC
Normal 0.995
Normal+abnormal 0.974
Normal+clean abnormal 0.975
This person-entering problem originates from a
simple automatic annotation based on human loca-
tions. Any coordinate (within a ground truth bound-
ing box of a person) located in the alarm region re-
sults in a labeling as abnormal. To reduce the un-
fair influence of such entering phenomena, we man-
ually sort both the 1715 training set and the 500 test
set, resulting in an additional “entering” category that
will be disregarded. Therefore, the training set is now
composed of 1628 normal images and 30 abnormal
images, without 57 entering images; the new test set
is composed of 409 normal images and 79 abnormal
images, without 12 entering images. The experiment
mentioned in Table 1 is redone with the new datasets,
and the results can be seen in Table 2, where “Nor-
mal” and “Normal+abnormal” are the same models
from Table 1. Because the entering images are re-
moved, the AUC is much better on the reduced test
set (409+79). “Normal+clean abnormal” means that
the model is trained on the new training set (1628+30)
without entering images.
6 DISCUSSION
Failure Modes. The object detector is prone to FN
due to unconventional appearance, occlusion, and
clutter. The autoencoder on the other hand benefits
from unconventional appearance but suffers from FP
due to unusual backgrounds such as higher heat re-
flections.
Training Effort. The object detector requires a large
number of annotations. If this can be achieved, a de-
tector can perform well in the vast majority of scenes
without additional fine-tuning or reconfiguration. The
autoencoder on the other hand requires retraining for
each scene. In return, it requires no labeling or very
limited labeling, which means it can be adapted to a
specific problem with little effort.
Future Work. In future we want to consider temporal
information and depth information for better differen-
tiation of activities and image homography to remove
perspective influences. Besides, the two approaches
will have to be evaluated using a much larger and
more diverse dataset to ensure that these solutions are
workable all year across multiple locations.
7 CONCLUSION
We compare two alternative vision-based methods for
assisting the surveillance of harbor fronts with high
risk of drowning accidents. One method utilizes ob-
ject detection to detect people in low resolution ther-
mal images and to raise warnings when people are
detected inside a risky area. The detector is able to
perform this task with perfect precision and a high
recall of 93.41%. It fails in situations with occlu-
sion and clutter. The other method uses an autoen-
coder and measures human activity based on the re-
construction error between input frames and the au-
toencoder’s reconstructions. The autoencoder-based
approach achieves a recall of 90.11% and a precision
of 79.61%. It fails due to unusual background phe-
nomena such as heat reflections and people only par-
tially entering the monitored region. Given that the
two methods have different strengths and weaknesses,
one or the other might be more appropriate depending
on the application.
ACKNOWLEDGEMENTS
This work is funded by TrygFonden as part of the
project Safe Harbor.
VISAPP 2021 - 16th International Conference on Computer Vision Theory and Applications
616

REFERENCES
Bochkovskiy, A., Wang, C.-Y., and Liao, H.-Y. M. (2020).
Yolov4: Optimal speed and accuracy of object detec-
tion. arXiv preprint arXiv:2004.10934.
Chong, Y. S. and Tay, Y. H. (2017). Abnormal event detec-
tion in videos using spatiotemporal autoencoder. In
International Symposium on Neural Networks, pages
189–196. Springer.
Deepak, K., Chandrakala, S., and Mohan, C. K. (2020).
Residual spatiotemporal autoencoder for unsuper-
vised video anomaly detection. Signal, Image and
Video Processing, pages 1–8.
Deng, J., Dong, W., Socher, R., Li, L.-J., Li, K., and Fei-
Fei, L. (2009). Imagenet: A large-scale hierarchical
image database. In 2009 IEEE conference on com-
puter vision and pattern recognition, pages 248–255.
Ieee.
Duman, E. and Erdem, O. A. (2019). Anomaly detection
in videos using optical flow and convolutional autoen-
coder. IEEE Access, 7:183914–183923.
Everingham, M., Van Gool, L., Williams, C. K., Winn, J.,
and Zisserman, A. (2010). The pascal visual object
classes (voc) challenge. International journal of com-
puter vision, 88(2):303–338.
Guo, Z., Liao, W., Xiao, Y., Veelaert, P., and Philips, W.
(2019). Deep learning fusion of rgb and depth images
for pedestrian detection. In 30th British Machine Vi-
sion Conference, pages 1–13.
Hasan, M., Choi, J., Neumann, J., Roy-Chowdhury, A. K.,
and Davis, L. S. (2016). Learning temporal regularity
in video sequences. In Proceedings of the IEEE con-
ference on computer vision and pattern recognition,
pages 733–742.
Lin, T.-Y., Doll
´
ar, P., Girshick, R., He, K., Hariharan, B.,
and Belongie, S. (2017a). Feature pyramid networks
for object detection. In Proceedings of the IEEE con-
ference on computer vision and pattern recognition,
pages 2117–2125.
Lin, T.-Y., Goyal, P., Girshick, R., He, K., and Doll
´
ar, P.
(2017b). Focal loss for dense object detection. In
Proceedings of the IEEE international conference on
computer vision, pages 2980–2988.
Lin, T.-Y., Maire, M., Belongie, S., Hays, J., Perona, P.,
Ramanan, D., Doll
´
ar, P., and Zitnick, C. L. (2014).
Microsoft coco: Common objects in context. In Euro-
pean conference on computer vision, pages 740–755.
Springer.
Liu, S., Qi, L., Qin, H., Shi, J., and Jia, J. (2018). Path ag-
gregation network for instance segmentation. In Pro-
ceedings of the IEEE conference on computer vision
and pattern recognition, pages 8759–8768.
Liu, W., Anguelov, D., Erhan, D., Szegedy, C., Reed, S.,
Fu, C.-Y., and Berg, A. C. (2016). Ssd: Single shot
multibox detector. In European conference on com-
puter vision, pages 21–37. Springer.
Lu, C., Shi, J., and Jia, J. (2013). Abnormal event detection
at 150 fps in matlab. In Proceedings of the IEEE inter-
national conference on computer vision, pages 2720–
2727.
Mahadevan, V., Li, W., Bhalodia, V., and Vasconcelos, N.
(2010). Anomaly detection in crowded scenes. In
2010 IEEE Computer Society Conference on Com-
puter Vision and Pattern Recognition, pages 1975–
1981. IEEE.
Mazzeo, P. L., Spagnolo, P., Leo, M., and D’Orazio, T.
(2008). Visual players detection and tracking in soc-
cer matches. In 2008 IEEE Fifth International Con-
ference on Advanced Video and Signal Based Surveil-
lance, pages 326–333. IEEE.
Nguyen, T.-N. and Meunier, J. (2019). Anomaly detection
in video sequence with appearance-motion correspon-
dence. In Proceedings of the IEEE International Con-
ference on Computer Vision, pages 1273–1283.
Punn, N. S., Sonbhadra, S. K., and Agarwal, S. (2020).
Monitoring covid-19 social distancing with person de-
tection and tracking via fine-tuned yolo v3 and deep-
sort techniques. arXiv preprint arXiv:2005.01385.
Redmon, J., Divvala, S., Girshick, R., and Farhadi, A.
(2016). You only look once: Unified, real-time object
detection. In Proceedings of the IEEE conference on
computer vision and pattern recognition, pages 779–
788.
Redmon, J. and Farhadi, A. (2017). Yolo9000: better, faster,
stronger. In Proceedings of the IEEE conference on
computer vision and pattern recognition, pages 7263–
7271.
Redmon, J. and Farhadi, A. (2018). Yolov3: An incremental
improvement. arXiv preprint arXiv:1804.02767.
Ren, S., He, K., Girshick, R., and Sun, J. (2015). Faster
r-cnn: Towards real-time object detection with region
proposal networks. In Advances in neural information
processing systems, pages 91–99.
Shine, L., Edison, A., and , J. C. V. (2019). A compara-
tive study of faster r-cnn models for anomaly detec-
tion in 2019 ai city challenge. In Proceedings of the
IEEE/CVF Conference on Computer Vision and Pat-
tern Recognition (CVPR) Workshops.
Song, H., Sun, C., Wu, X., Chen, M., and Jia, Y. (2019).
Learning normal patterns via adversarial attention-
based autoencoder for abnormal event detection in
videos. IEEE Transactions on Multimedia.
TrygFonden et al. (2018). Camera monitoring of ports. last
accessed: September 25, 2020.
Ultralytics (2020). Yolov5. last accessed: August 20, 2020.
Voigt, P. and Von dem Bussche, A. (2017). The eu general
data protection regulation (gdpr). A Practical Guide,
1st Ed., Cham: Springer International Publishing.
WHO (2014). Global report on drowning: preventing a
leading killer.
Supervised versus Self-supervised Assistant for Surveillance of Harbor Fronts
617
