
Deep Learning Assisted Retinopathy of Prematurity Screening Technique
Vijay Kumar
1
, Het Patel
1
, Kolin Paul
1
, Abhidnya Surve
2
, Shorya Azad
2
and Rohan Chawla
2
1
Khosla School of Information Technology, Indian Institute of Technology, Delhi, India
2
Dr. Rajendra Prasad Centre for Ophthalmic Sciences, All India Institute of Medical Sciences, Delhi, India
Keywords:
Fundus Image, Retinopathy of Prematurity (ROP), Plus Disease, Computer Aided Diagnosis (CAD), Image
Processing, Machine Learning (ML), Deep Learning (DL).
Abstract:
Retinopathy of Prematurity (ROP) is the leading cause of blindness in preterm babies worldwide. By using
proper scanning and treatment, the effect of the blindness of ROP can be reduced. However, due to lack of
medical facilities, a large proportion of these preterm infants remain undiagnosed after birth. As a result,
these babies are more likely to have ROP induced blindness. In this paper, we propose a robust and intelligent
system based on deep learning and computer vision to automatically detect the optical disk (OD) and retinal
blood vessels and also classify the high severity (Zone-1) case of ROP. To test and validate the proposed
system, we present empirical results using the preterm infant fundus images from a local hospital. Our results
showed that the YOLO-V5 model accurately detects the OD from preterm babies fundus images. Further,
the computer vision-based system accurately segmented the retinal vessels from the preterm babies fundus
images. Specifically for the Zone-1 case of ROP, our system is able to achieve an accuracy of 83.3%.
1 INTRODUCTION
Retinopathy of prematurity (ROP) is the leading cause
of blindness in premature infants worldwide (Orga-
nization et al., 2019). This is caused by abnormal
development of retinal blood vessels in a preterm
light-weight infant (Brown et al., 2018; Wang et al.,
2018). For the past several decades, paediatric oph-
thalmologists have used retinal images for screening,
detection, and monitoring of ROP. An ophthalmolo-
gist uses two types of methodology to analyse retinal
scan images: manual and automatic. Then they can
classify ROP based on anteroposterior location (area),
severity (stage) and vascular characteristics (Dogra
et al., 2017). One of such classification criteria is the
extent of vascularization, where the disease is classi-
fied into three zones: Zone-1, Zone-2 and Zone-3 as
shown in Figure 1. In clinical practice, it performs
a significant role for the ophthalmologist in planning
the treatment of ROP and plus disease. Apart from
this, it is also helpful to understand the improvement
and severity of the disease. Therefore, throughout the
treatment of ROP, it is very essential to measure the
extent of vascularization of the retinal vessels accu-
rately.
The problem in India is more acute as more than
65% of people live in villages or small-urban areas,
and medical facilities (i.e., newborn care, ophthalmol-
ogists, ROP screening devices, etc.) and their avail-
abilities are limited (Dogra et al., 2017; Organization
et al., 2019). Therefore, a large proportion of these
infants remain undiagnosed after birth. As a result,
these babies are more likely to have ROP induced
blindness. In addition, the neonatal care division
and ophthalmologists have a limited period of time
to provide appropriate diagnosis and treatment, which
makes the problem even more challenging. There-
fore, there is an urgent need for an innovative solution
to detect and classify the high severity (zone-1) case
of ROP that causes the most ROP induced blindness
in children.
Given its importance, many authors have pro-
posed several techniques for ROP diagnosis and clas-
sification recently. Some of these are based on im-
age processing and some are based on AI techniques.
Currently, machine learning (ML) especially deep
learrning (DL) based methods have led to remarkable
improvement in the performance of ROP diagnosis
and classification applications (Brown et al., 2018;
Figure 1: ROP disease classification.
234
Kumar, V., Patel, H., Paul, K., Surve, A., Azad, S. and Chawla, R.
Deep Learning Assisted Retinopathy of Prematurity Screening Technique.
DOI: 10.5220/0010322102340243
In Proceedings of the 14th International Joint Conference on Biomedical Engineering Systems and Technologies (BIOSTEC 2021) - Volume 5: HEALTHINF, pages 234-243
ISBN: 978-989-758-490-9
Copyright
c
2021 by SCITEPRESS – Science and Technology Publications, Lda. All rights reser ved

Tan et al., 2019; Ting et al., 2019b). The DL-based
systems can accurately detect and classify the ROP,
but, it fails to provide the detail and quantitative in-
formation of the disease. As a result, the ophthal-
mologist is incapable of correlating the results from
DL-based systems with the signs and symptoms of
disease (Brown et al., 2018; Tan et al., 2019; Ting
et al., 2019b). In this paper we will be suggesting a
solution keeping this problem in mind as in medical
applications explainability of results is considered to
be a major factor. Moreover, DL-based systems are
data-driven, which require a massive amount of la-
belled pathological data to train, test and validate a
model. In the case of ROP, obtaining a large number
of fundus images is challenging. Consequently, it hin-
ders the advancement and use of DL-based systems in
such medical applications.
Therefore, in this paper, we have introduced a DL-
assisted system to detect and classify ROP disease.
ROP classification is mainly based on the location and
extent of vascularization. It requires a retinal vessels
map with the extent and location of the optical disk
(OD). The OD is the bright and elliptical region in the
fundus image. The ROP classification algorithm uses
OD as a reference point to determine the degree and
progression of a disease based on the extent of blood
vessels. In addition, retinal features can be utilised
by the ophthalmologist to determine the correlation
between the ML/DL system results and pathological
signs and symptoms.
The rest of paper is organized as follows. Section
2, presents the recent work related to ROP screening.
Section 3, gives the design details of the proposed
DL-Assisted technique for ROP screening. Section
4, presents results, which comes at different stages of
the proposed technique’s pipeline. Finally, in Section
5, we discuss the proposed technique’s shortcomings.
2 RELATED WORK
Over the past several years, ophthalmologists have
been using numerous procedures for ROP screening
and classification. One of them is manual screening.
In this, ophthalmologists examine the symptoms of
the retinal image related to the disease. This proce-
dure is a highly biased and stressful practice. The de-
cision in this depends completely on the skill level
of the ophthalmologist. The decision is based on
the colour, texture, extent and structure of the reti-
nal vessels. This makes the results extremely person-
specific, which makes it suffer from inter-expert vari-
ability problems.
To overcome these limitations, ophthalmologists
and researchers chose computer-aided techniques in
their practice for medical diagnosis applications. Us-
ing Computer-Aided Diagnosis (CAD), image pro-
cessing, computer vision and machine learning-based
algorithms are used to detect the disease. However,
these are not very useful in the diagnostic process to
understand the progression of various retinal diseases
such as DR, glaucoma, AMD, ROP and plus disease.
In the last few years, several DL-based systems have
been developed for diagnosis and screening of retinal
condition. Self-learning capability, accuracy, and ef-
ficiency of DL systems attract special attention of re-
search communities. Therefore, its applications have
been successful in the field of ophthalmology, notably
for ROP, glaucoma, DR, and AMD, where retinal im-
age features for these diseases are not known (Ting
et al., 2019a). These are data-driven techniques in
which DL-model is pre-trained with historical patho-
logical datasets related to the specific disease. Many
DL based techniques have also developed for ROP
screening and diagnosis. Table 1, summarizes some
recent DL based systems used for ROP screening and
diagnosis. It uses a different variation of the DL net-
work for screening and classification of ROP and plus
diseases. The performance of DL-based systems is
better than that of traditional CAD applications (Ting
et al., 2019b; Zhang et al., 2018; Guo et al., 2020;
Ding et al., 2020). Additionally, the DL-based screen-
ing technique also resolves the issue of flexibility and
adaptability that are absent in the rule-based system.
The ML/DL based system is a data-driven tech-
nique. This requires a massive amount of data
(labelled/not-labelled) for its training, testing and val-
idation (Ting et al., 2019b; Zhang et al., 2018; Guo
et al., 2020; Ding et al., 2020). For medical appli-
cations, data collection (pathological, medicine and
treatment history) and labelling are tedious tasks. In
some settings the incidence of a disease is low and
their features depend on the socio-economic situation
as well as geographic distribution making it harder
challenge to obtain quality datasets. Recently, in
(Ting et al., 2019b), the authors proposed DNN-based
reinforcement learning techniques for ROP, which re-
duce the additional burden on the developer or re-
searcher to perform labelling before training a DL-
model. The performance of the trained DL module
for a specific dataset is efficient and accurate for that
dataset while their accuracy is questionable for any
other dataset. Furthermore, for the expert, it is diffi-
cult to understand and explain the correlation between
the signs and symptoms of the disease with the out-
come of the DL-system.
Deep Learning Assisted Retinopathy of Prematurity Screening Technique
235
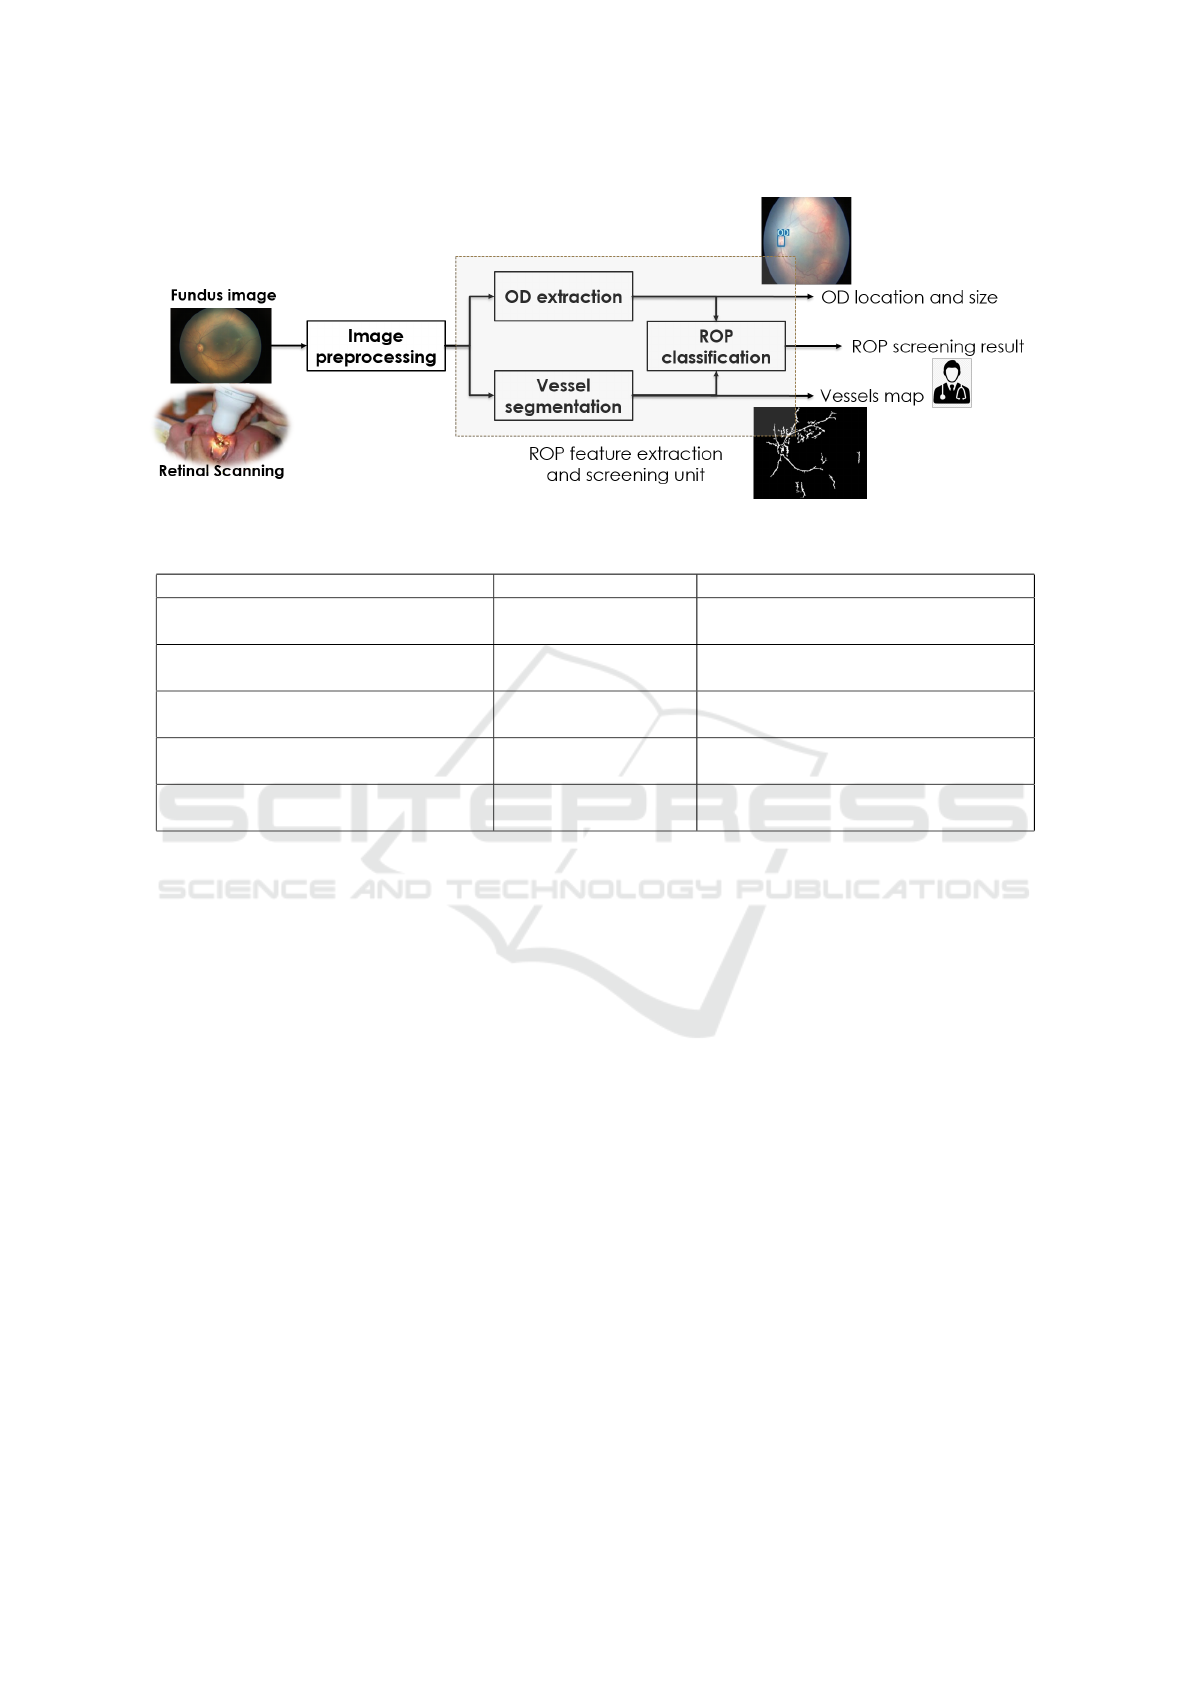
Figure 2: AI-ML assisted ROP feature extraction and disease screening system.
Table 1: Summary table for different ML/DL system for ROP disease screening using fundus image.
Network Size of datasets Result (%)
CNN (inception-V1 and U-net)
(Brown et al., 2018)
100 ROP plus: (Se: 93 and Sp: 94), pre-
plus: (Se: 100 and Sp: 94)
Transfer learning; AlexNet, VGG16,
and GoogLeNet (Zhang et al., 2018)
19543 Ac: 98.8 (VGG-16)
CNN (Tan et al., 2019) - ROP plus: (Se: 97 and negative predic-
tive value (NPV): 98)
ROPBaseCNN, ROPResCNN (Guo
et al., 2020)
959 Se: 100, Sp: 96, Pr: 96, Ac: 98
Hybrid (image segmentation +
CNN) (Ding et al., 2020)
1199 (in stage three) Pr: 62, Re: 62, F1: 62
(Sp: Specificity, Pr: precision, Ac: Accuracy, Se: Selectivity, Re: recall, F1: F1-score, CNN: convoluted neural network)
Therefore, to solve the above problems, we have
proposed a DL-assisted ROP screening technique,
which can operate in environments where the avail-
ability of large-scale historical datasets is not possible
and interpretation of the DL-based system outcomes
are highly essential.
3 PROPOSED APPROACH
As shown in Figure 1, ROP can be classified using
zones(I/II/III) which can be found using the extent of
vessel growth in the fundus image in predefined con-
centric areas centered at optical disk. A challenge that
we face is in regards of plus disease which can be
detected and quantified using tortuosity and ratio of
width of artery and vein at some predefined distance
from the optical disk.
The detailed architecture of the proposed system
is shown in Figure 2. It consists of four func-
tional units, namely, fundus imaging (or retinal scan-
ning), pre-processor, features extraction blocks and
disease classification unit. Fundus Imaging Unit is
responsible for taking and handling retinal scan im-
ages, including videos for retinal disease diagnosis
and screening. Ophthalmologists often perform reti-
nal examinations using the fundus camera. The fun-
dus image is a colour image of the retinal membrane
of the eye, taken with the fundus camera. Scanned im-
ages or video data are noisy and suffer from a number
of sets of errors caused by uneven illumination, mo-
tion blur and sharp and sudden changes in the signal.
Therefore, the quality of these images need to be im-
proved. For this, the system has a pre-processing unit.
This provides the capability to enhance the quality of
the images. It uses various image reconstruction and
enhancement algorithms to reduce the effect of noises
which are discussed in the following sections.
The pre-processed image is processed by the fea-
tures extraction unit to extract the pathological fea-
tures related to ROP. The features extraction unit is
made up of two sub-units namely OD extraction and
Vessel extraction unit. Both sub-units are jointly re-
sponsible for the extraction of the feature related to
the ROP from a fundus image. Finally, these features
are used by the classification unit to detect the ROP.
In this study, the proposed system uses retinal
blood vessel structure and extent to detect and clas-
HEALTHINF 2021 - 14th International Conference on Health Informatics
236

sify ROP (Dogra et al., 2017). For that, the clas-
sification unit uses the extracted features to get the
condition of ROP disease. The features set use for
ROP is {OD,Vessel}. The classification unit use in-
ternational classification for retinopathy of prematu-
rity (ICROP) rules for ROP Zoning (shown in Fig-
ure 1)(Dogra et al., 2017). In this, the classification
is made into three zones based on retinal blood ves-
sel architecture and their extent. Hence, the impor-
tance of the feature extraction unit is more as the ac-
curacy of the classification unit depends on how well
retinal features like optical disk (OD), blood vessels
(Vessel) are extracted from the retina (Dogra et al.,
2017). Hence, we have used two dedicated retinal fea-
ture extraction unit: OD extraction and blood vessels
segmentation are used. Out of these, the OD extrac-
tion module uses DL-based systems, while the vessel
extraction module is based on image processing and
computer vision-based algorithms.
3.1 Data Preparation
A significant number of historical data-points are
required for training, testing and validation of the
proposed system, especially for DL-based modules.
Therefore, we created different sets of fundus datasets
for training, testing and validation of different mod-
ules as per availability of relevant historical data
points ( or images). We have collected AIIMS dataset
for ROP disease from RP Center, AIIMS Delhi to de-
velop ROP Screening modules, which contains a total
of 439 images. The total number of preterm infants,
ROP positive or negative, is described in detail in Ta-
ble 2.
In this study, we have used the dataset in two
stages with the proposed system. In the first stage, we
have used it for the feature extraction. The proposed
system has two feature extraction modules for ROP
screening: OD Detection and Vessels Extraction. The
OD detection module is a DL-based system. For this,
we have labelled a total of 1556 fundus images. Out
of this, 990 labelled images are used for module train-
ing while the remaining 281 for testing and 285 are
used for validation (used to select best DL model from
each epoch to avoid overfitting) as explained in Table
3. The vessels extraction module uses image process-
ing and computer vision-based systems and does not
require any type of training before use. However, ver-
ification of its performance requires a ground truth or
gold standard.
In the final stage where we classify particular fun-
dus image into the respective zone, we have used im-
ages from the AIIMS dataset in which the OD and
blood vessels are clearly visible in the image for vali-
dation of our approach. These images have been col-
lected and labelled a neonatal ophthalmologist into
four categories, namely Zone-I, Zone-II, Zone-III and
healthy, which is the ground truth.
Table 2: AIIMS ROP dataset.
ROP Zone Total images Total subject
Zone-I 105 6
Zone-II 217 16
Zone-III 41 5
Healthy 76 4
Total 439 31
3.2 Image Pre-processing
In this study, we have used raw images of the prema-
ture infant’s retina from a local hospital to test and
validate the proposed system. These images suffer
from a variety of noises, such as motion blur, irregu-
lar illumination and sudden disturbances in image sig-
nals, which may reduce the accuracy of the proposed
system outcome. Therefore, there is a need to en-
hance the image quality before using these images to
detect disease. We reduce the adverse effects caused
by the noise by preprocessing. In this sub-section, we
discuss the image enhancement techniques used by
the proposed system to minimise the impact of noise
occurring in retinal scans (or images).
Colour fundus image of the neonatal is pale yel-
lowish colour. A colour image frame has three colour
channels: red (R), green (G) and blue (B). However,
the R-channel is saturated and the B-channel is un-
derexposed. Therefore, detailed information related
to vessels and OD from the R and B channels is not
visible. However, in the G-channel, these features are
evident and distinguishable. Hence, we preferred the
G-channel and have used it in all further imaging pro-
cessing modules. We have also used a median filter
and contrast-limited adaptive histogram equalization
(CLAHE) to improve the quality of the colour image
to reduce the effect of uneven illumination and mo-
tion blur (Ravichandran and Raja, 2014). However,
in the DL-system, we use the colour image as input
for feature extraction, disease detection and classifi-
cation and use CLAHE to correct the effect of colour
image quality due to uneven illumination.
3.3 OD Detection
For the ROP diagnosis and classification, we have fol-
lowed the standard procedure defined by the ICROP
(Dogra et al., 2017). According to the ICROP classi-
fication of ROP, the reference circles use in zoning are
Deep Learning Assisted Retinopathy of Prematurity Screening Technique
237
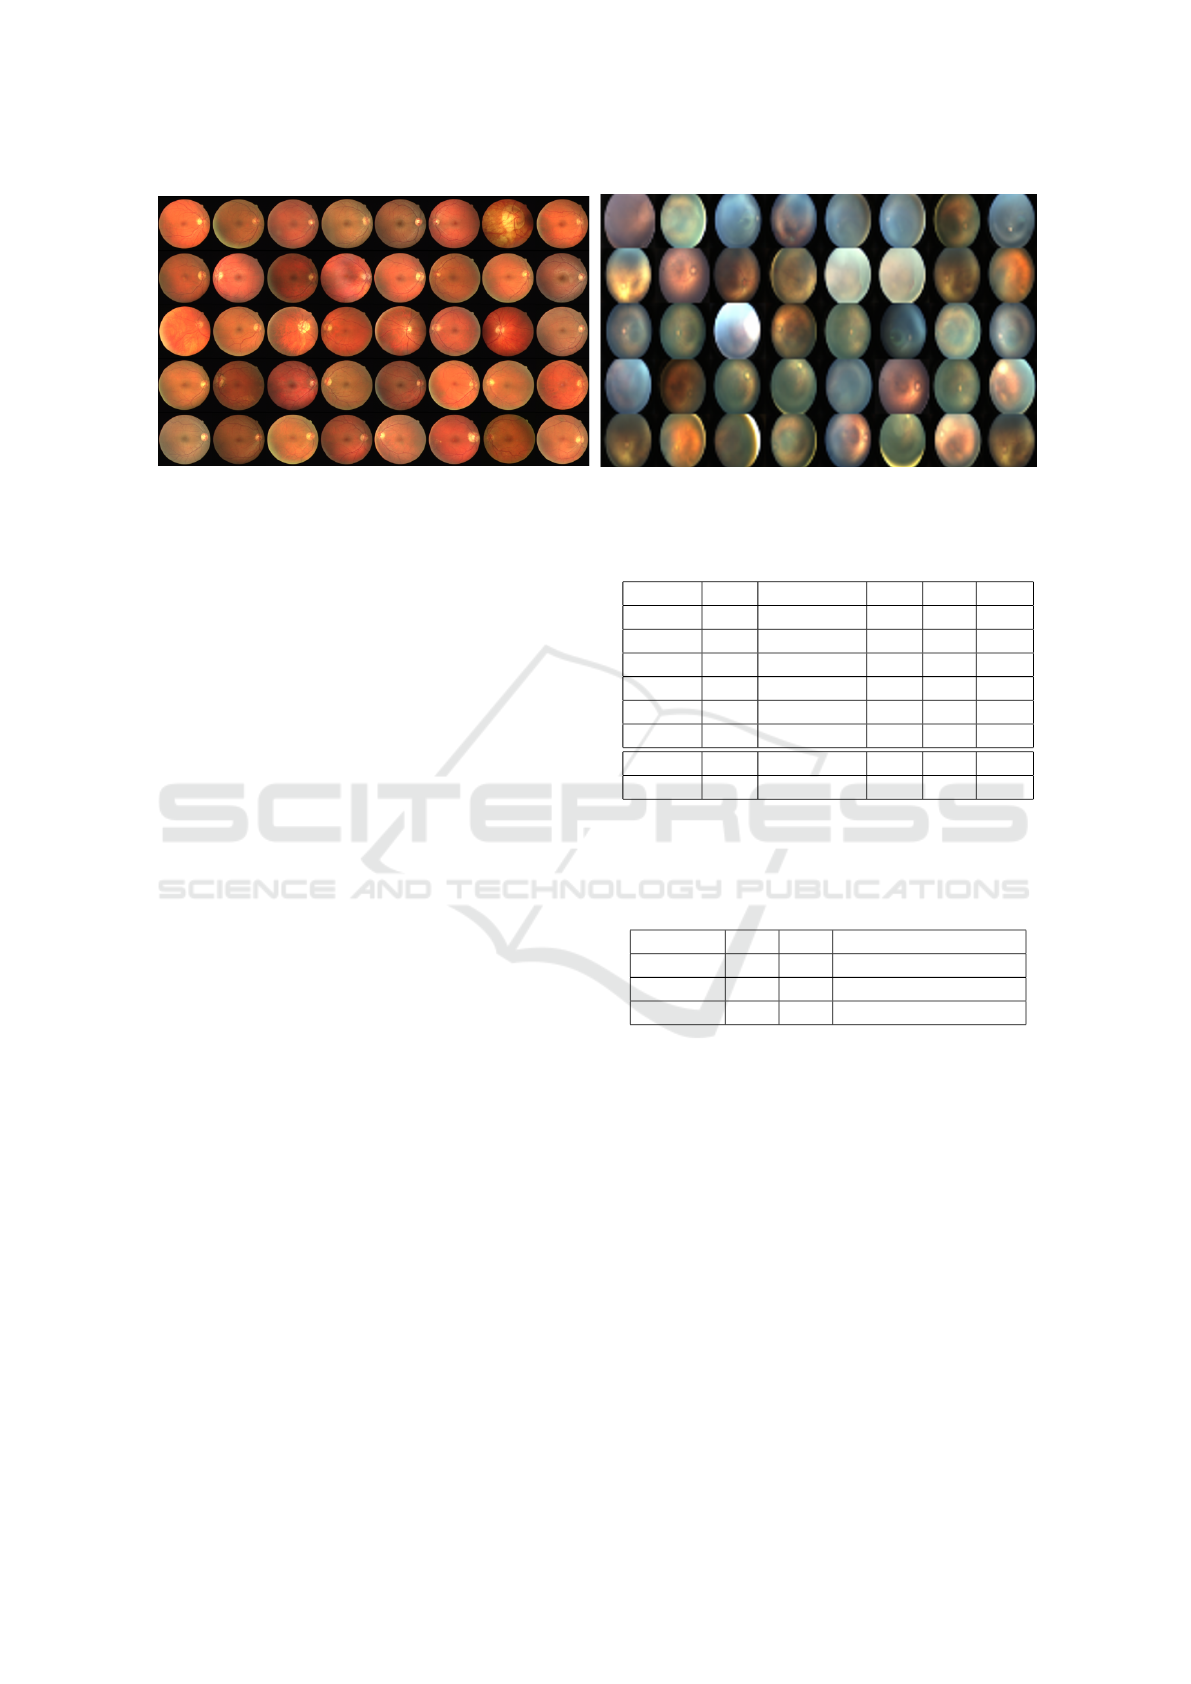
(a) DRIVE dataset
(b) AIIMS dataset (neonatal retinal images)
Figure 3: Variation in quality of images in various data-sets.
centred at optical nerves in a retinal image. Therefore,
the accuracy of an ROP classification depends on how
accurately the centre of OD is detected. There are
some simple non-data driven as well as data-driven
approaches proposed by various researchers in past
(Wang et al., 2019; Budai et al., 2013; Yavuz and
K
¨
ose, 2017; Islam et al., 2019) on this topic, which
use standard data-sets like DRIVE (Staal et al., 2004)
or STARE (Hoover et al., 2000). However, the main
issue in this approach is that it tries to locate optical
disk in fundus image using the variation in intensity
as the optical disk is (generally) the brightest spot in
the fundus image. In the AIIMS-ROP dataset, fun-
dus images of premature infants are taken using reti-
nal camera RetCam. These images are distinct from
the standard datasets. We can see the difference be-
tween the grids in Figure 3. It may also be noted that
these standard datasets are much more consistent in
terms of quality and they have very low noise as well
as a good contrast. So, feature extraction can be done
using one non-data driven approach, but in images ac-
quired in (standard) hospital setups. Hence, we have
to deal with a vast spectrum of image quality.
For ROP classification, we use a DL module that
can perform the OD detection efficiently and accu-
rately. It also provides the location of the OD cen-
tre. For the OD detection, we have created an object
detection module using state of the art DL-based ob-
ject detection model YOLO-v5 (Jocher et al., 2020)
as these models assure better accuracy with low la-
tency in prediction. To train these models, we have
created one large dataset. For that, we have sourced a
total of 6 datasets: five publicly available datasets and
one dataset from a local hospital. The details of all
datasets are given in Table 3. Some fundus images
in the newly created dataset do not have an OD. We
need to ensure that if the OD is not present in the im-
age then we do not get a false-positive result (shown
in Table 4). YOLO algorithm detects the object and
Table 3: Fundus image datasets for OD detection.
Dataset Total Resolution Train Test Valid
STARE 297 700x605 197 50 50
FIRE 224 2912x2912 144 40 40
DRIVE 40 565x584 30 5 5
HRF 45 3504x2336 25 10 10
IDRiD 511 4288x2848 361 75 75
AIIMS 439 1600x1200 233 101 105
Total 1556 - 990 281 285
% - - 63.62 18.06 18.32
Train: Training dataset, Test: Testing dataset and Valid:
Validation dataset
Table 4: Training datasets for the OD detection (Where, 0:
without OD and 1: with OD).
OD exist 0 1 % image with no OD
Train 115 875 11.62
Valid 10 275 3.51
Test 19 262 6.71
also provides their location and bounding box infor-
mation. Therefore, in the case of fundus image, it
detects the optical disk feature such as their bounding
box width, height and centre. Moreover, OD’s fea-
tures are utilised by the disease classification module
as well as by the expert directly for disease screening
and validation task. Redd et. al provide the details
network architecture of YOLO algorithm in (Redd
et al., 2019). We labelled the compiled dataset as per
YOLO model’s input and then we trained the network
with the input image resolution of 416 x 416.
3.4 Vessels Extraction
In the proposed system, the second most important
retinal feature utilised by the ICROP-based ROP zon-
ing algorithms is retinal blood vessel map. Therefore,
HEALTHINF 2021 - 14th International Conference on Health Informatics
238
the proposed system requires a vessel extraction mod-
ule to produce accurate retinal vessel maps from reti-
nal scans.
Over the last few years, many vessels extraction
algorithm have been developed by various researchers
(Fraz et al., 2012; Islam et al., 2020). It works very
well with an adult person retinal images and makes
accurate vessel maps after segmentation. As shown
in Figure 5, in the preterm infant, the retinal vascu-
lar structure does not develop properly. Due to this,
the blood vessels of the preterm infant retina are not
clearly visible. Therefore, the traditional algorithms
of vessel segmentation, which work well with the
publicly available retinal image datasets, do not work
with the infant’s retinal image.
Recently, some researchers have been devel-
oped vessels segmentation techniques that can accu-
rately segment the preterm infant retinal vessels map
(Yildiz et al., 2020; Luo et al., 2020). Here the au-
thors used DL-based techniques for segmentation of
vessels, which segment the exact vessels map of the
retina image of the premature infants. Selection of
the training dataset for the DL model is crucial be-
cause it influences the output of the system. Training
datasets included in these DL systems derived from
particular demography that is influenced by gender,
race, age, etc. Therefore, these models do not work
with local dataset. However, in a specific demogra-
phy, the model needs to be re-trained before it can be
used, which requires a large dataset.
In the proposed system, we have used an algo-
rithm from image processing and computer vision-
based vessel segmentation that separates retinal ves-
sels from fundus images. Due to the lack of ground
truth or gold standard for verification and testing, it is
difficult to measure the performance of the proposed
algorithm. However, the retinal vessels segmented by
the vessel segmentation unit from the fundus image
is sufficient for the ROP zoning application. We have
also verified the retinal vessels map obtained from via
the vessel segmentation approach with the neonatal
ophthalmologist.
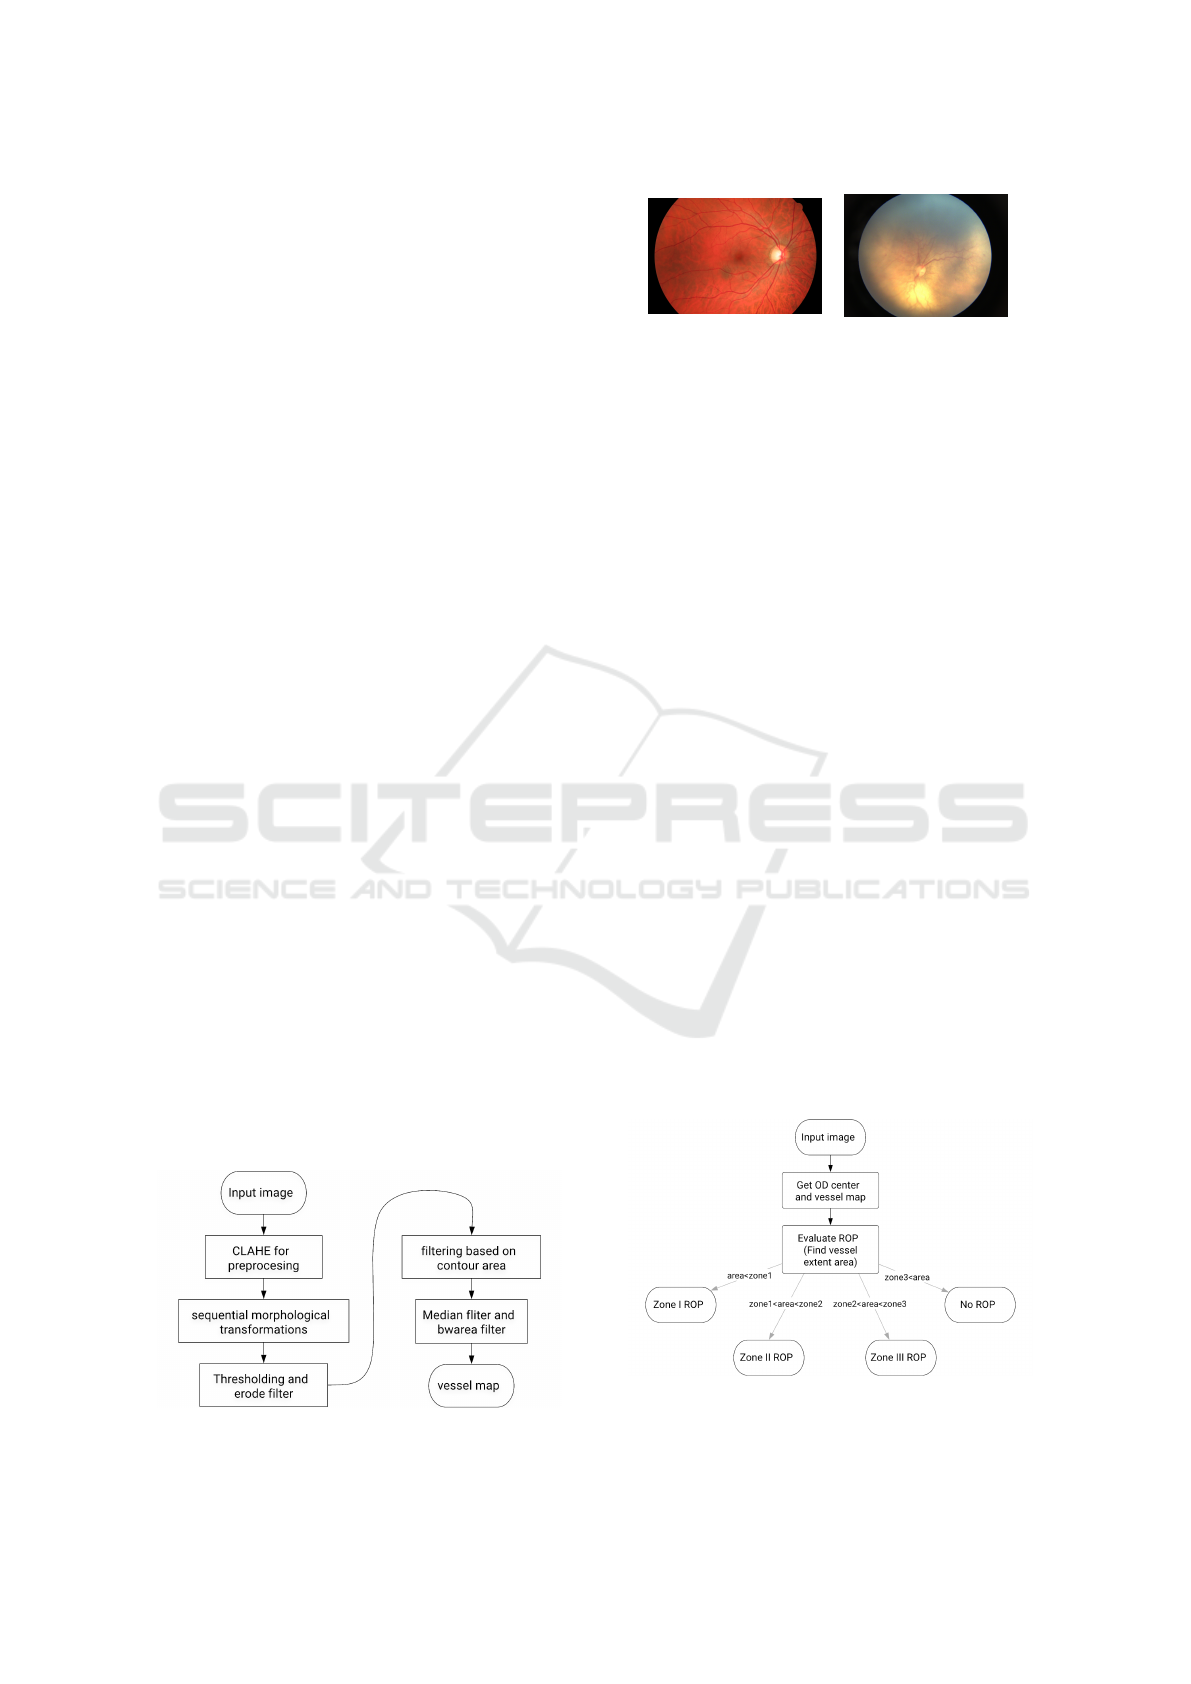
Figure 4: Vessels extraction form retinal fundus images.
(a) Normal fundus image
(b) Neonatal fundus image
Figure 5: Retinal images of elderly person and a neonatal.
The vessels extraction algorithm pipeline is shown
in Figure 4. It consists of mainly three stages named
image preprocessing, masks generation and blood
vessels segmentation. The preprocessing stage per-
forms all the essential operation to improve the qual-
ity of retinal images. We perform a series of mor-
phological operations followed by cluster threshold-
ing and noise reduction to generate results.
3.5 ROP Classification
The proposed system uses an easy and efficient ap-
proach for zone detection using the above-discussed
modules. In this paper, we consider a single fundus
image for zone prediction and hence we cannot cover
retinal peripheral areas that are required to efficiently
detect Zone-2 or higher or classify an image as no
ROP. The focus of our methods is to accurately de-
tect Zone-1 cases of ROP because of the severity. The
flowchart for proposed processes in Figure 6.
The accuracy of the classification is defined by the
two factors. The first is, how well the vessels are seg-
mented from the retinal image and the second is, how
well the OD detection algorithms detect the shape,
size and location of an optical disk. Further, the zon-
ing algorithm uses OD location and their size as a ref-
erence point for the concentric circle for zone clas-
sification. The radius of Zone-1 with approximately
equal to the five times of the OD diameter.
In the next section, we evaluate the proposed so-
lution.
Figure 6: Algorithm for ROP Zone classifier.
Deep Learning Assisted Retinopathy of Prematurity Screening Technique
239
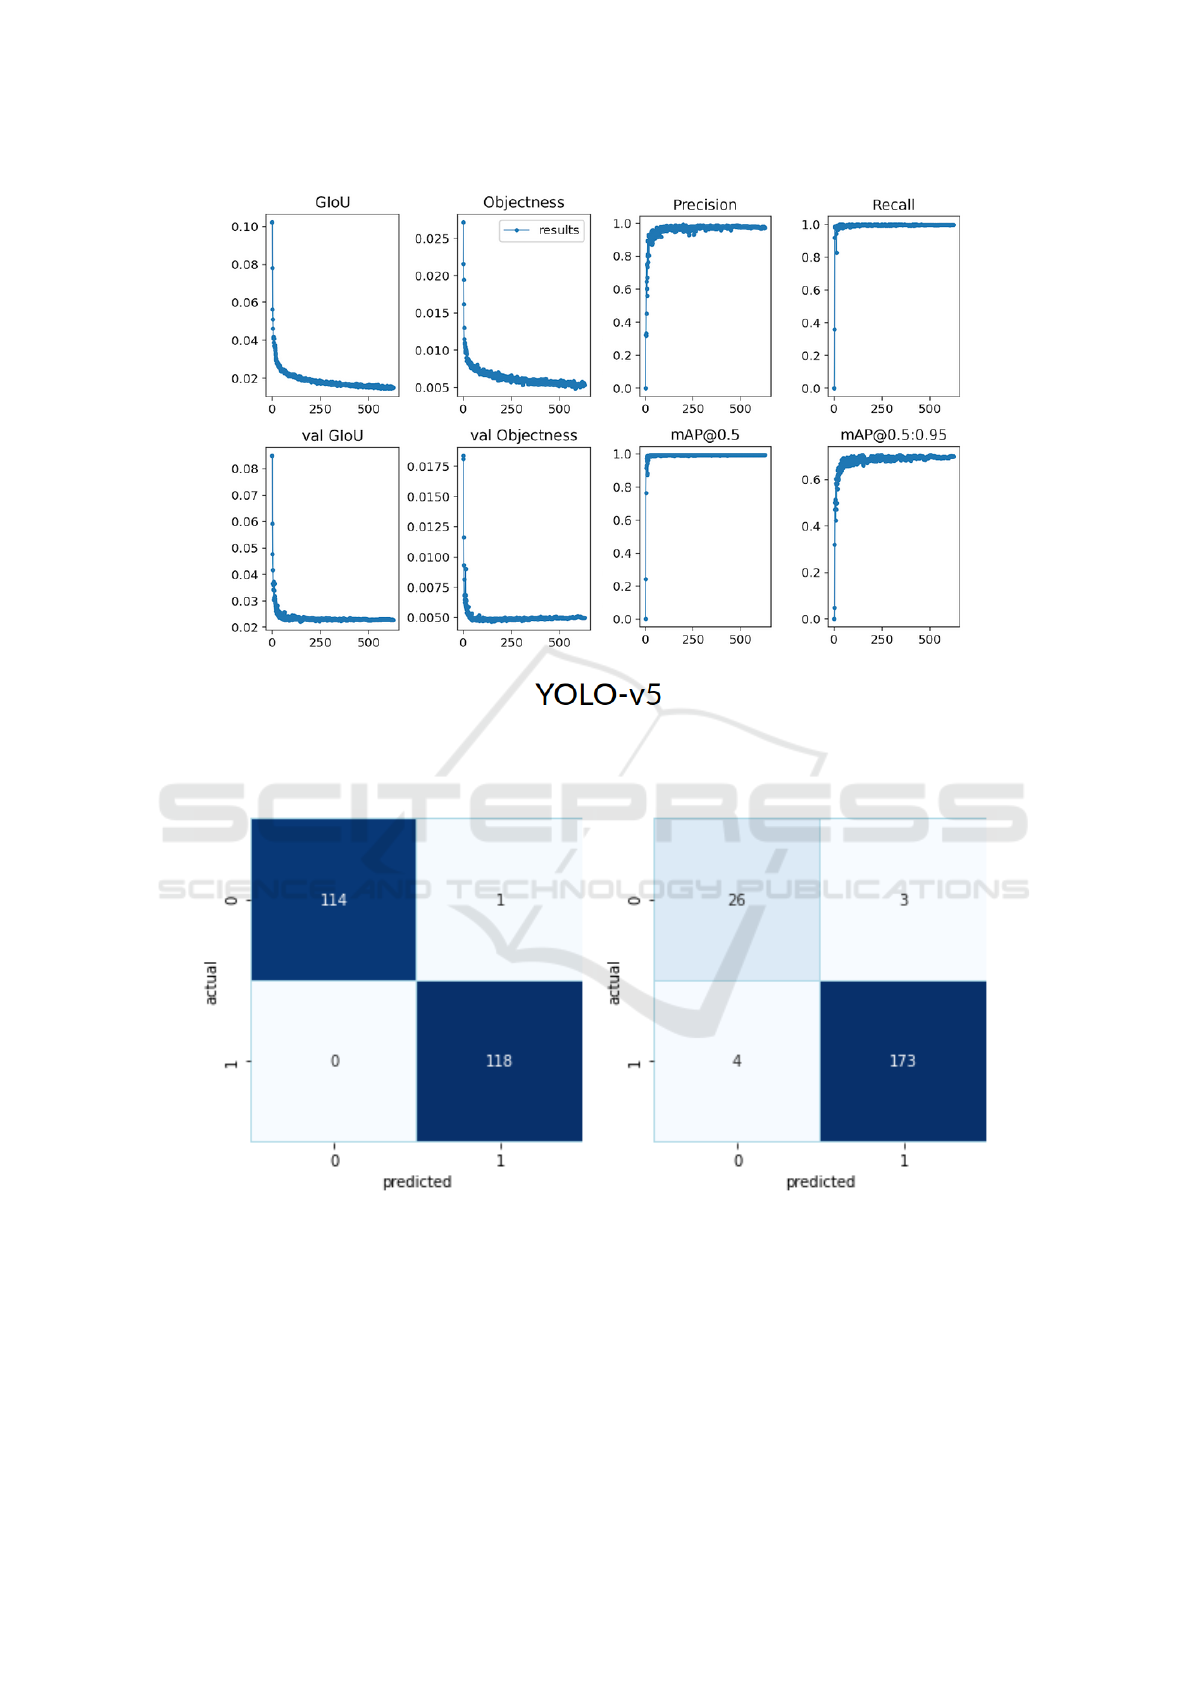
Figure 7: Model training metrics plot with respect to the epoch number. (Where, GIoU: generalized intersection over union
loss for training, Objectness: objective loss for the training, val GIoU: validation GIoU loss, val Objectness: validation
objective loss, and metrics are Precision, Recall and mAP@x: mean average precision if we consider IoU>x as correct
classification).
(a) AIIMS Train Dataset (b) AIIMS Test Dataset
Figure 8: Confusion Matrix of OD detection (Where, 0: without OD and 1: with OD).
4 RESULTS
The proposed system and its different modules are im-
plemented and tested on a laptop with Intel i7-9750H
CPU with 16 GB RAM and NVIDIA GeForce GTX
1660-Ti GPU.
In this study, we have proposed a DL-assisted
CAD system for ROP diagnosis and screening in pre-
mature babies.In this section, we have reported the
results obtained in the study of various stages of the
proposed system.
HEALTHINF 2021 - 14th International Conference on Health Informatics
240
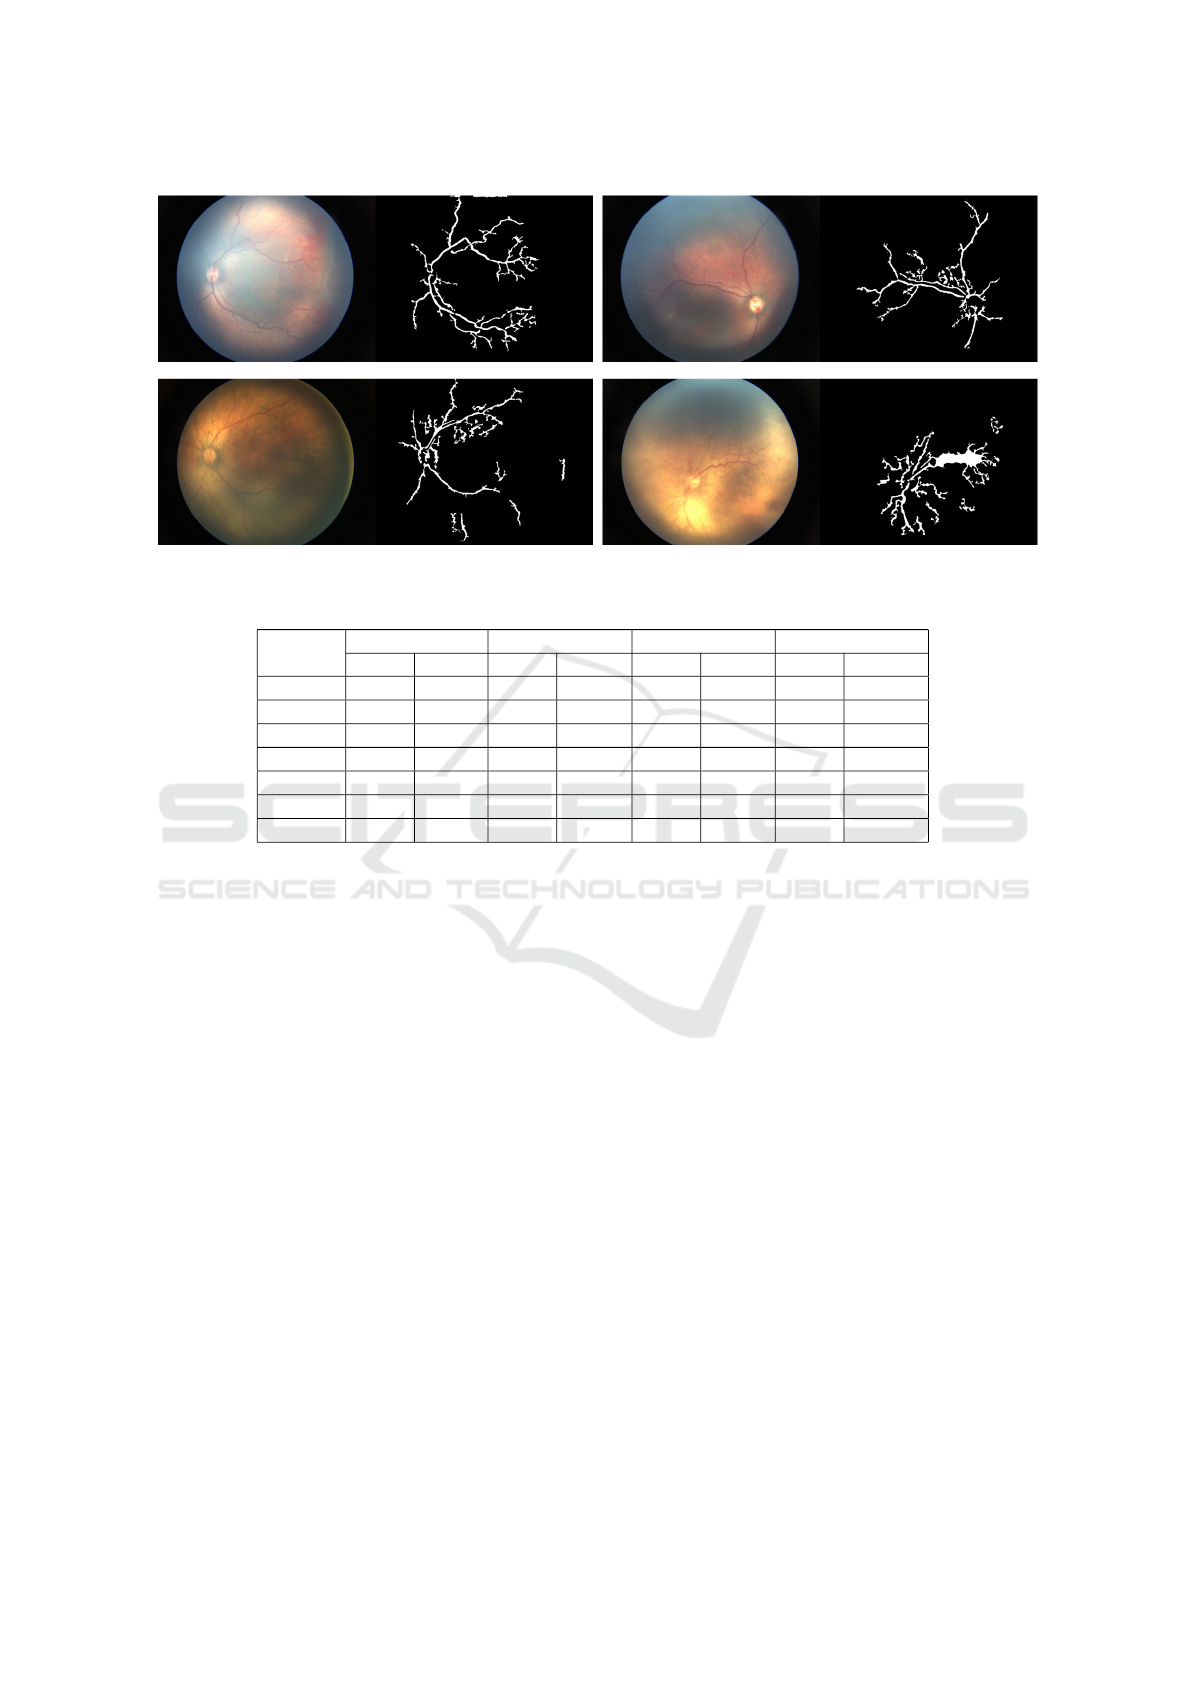
Figure 9: Blood vessel extraction results.
Table 5: Performance of YOLO-v5 on different datasets.
Dataset
Average IoU% mAP@0.5 IoU Accuracy@0.5 Accuracy@0.75
Train Test Train Test Train Test Train Test
AIIMS 95.59 80.62 0.995 0.973 99.57 96.6 98.71 79.61
HRF 95.71 89.28 0.995 0.995 100 100 100 100
STARE 95.09 83.64 0.995 0.995 100 99 100 90
IDRiD 95.49 88.55 0.995 0.995 100 100 100 97.33
DRIVE 95.69 86.83 0.995 0.995 100 100 100 100
FIRE 89.93 86.31 0.995 0.995 100 100 100 98.75
Overall 94.64 84.48 0.995 0.995 99.9 98.94 99.7 90.11
* IoU: Intersection over union is the ratio of intersection of predicted bounding
box and ground truth to the union of the both
* mAP@0.5 IoU: Mean Average precision at IoU threshold of 0.5
* Accuracy@x: Accuracy if we consider IoU>x as correct classification
4.1 OD Segmentation
After collecting six different datasets (listed in
Table 3)), we manually labelled bounding box for
OD in these images and then trained YOLO-v5
models. It took us around 10 hours to train this
model on out local machine with specifications
mentioned above and to detect OD from an image
it always took less than 100 milliseconds to get the
result. Figure 7 depicts the performance metrics
generalized intersection over union (GIoU) loss,
objective loss and confusion parameters (i.e., pre-
cision, recall and mean average precision (mAP) )
of DL-module with train and validation datasets at
different epochs. The first two rows in that image
shows GIoU and Objective function value that our
model is trying to reduce for train dataset in first
row and for validation dataset in second row. From
that, we can see that Train loss is decreasing and
Validation performance is increasing so we have suc-
cessfully trained the model. In the last two columns
we have plotted various performance metrics for
validation dataset as training progressed.
Results that we have got from the trained model
are mentioned in Table 5. Here we have created this
data set to train YOLO models by combining multi-
ple datasets, so our model must perform well for every
dataset. Here from this table, we can see good accu-
racy figures for all the datasets. Here also one can see
that for some standard datasets it is easy to get 100%
accuracy even for test dataset and these results are ex-
plained by consistency in images of standard dataset.
Also, in one dataset, there were some images for
which there were no OD in the image. So if we put
that as a binary classification problem of availability
of OD, then we obtain the confusion matrix on this
dataset using YOLO-v5 as shown in Figure 8 (In this
figure 0 means there is no OD in the image and 1
means there is an OD in the image). This shows that
in that particular task also our model performs well.
Deep Learning Assisted Retinopathy of Prematurity Screening Technique
241
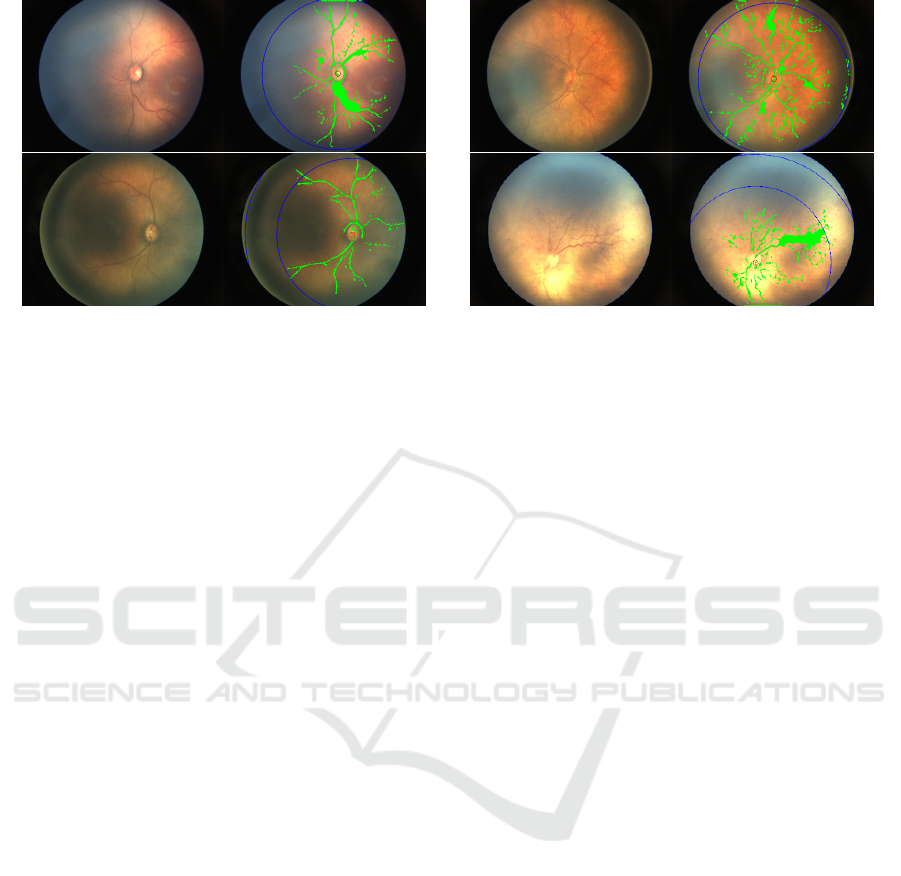
Figure 10: ROP zoning results: blue line depict zone boundary (Left side: original image, Right side: ROP zoning based on
vessels extent).
4.2 Vessels Segmentation
Figure 9 shows, the extracted blood vessel from AI-
IMS dataset using our approach. From these results,
we can observe that this algorithm is some times sen-
sitive to noise or overexposure. We tried to fine-tune
every parameter of this algorithm but variation in the
dataset is the limitation in our method. However, it is
not able to capture the thinner parts of the blood ves-
sels accurately. The results that we have got till now
is acceptable for zone detection, which is the task in
hand we need vessel extent for now.
4.3 ROP Zoning
Figure 10 shows the visualisation of the proposed so-
lution. As of now, we have 12 images (of 5 differ-
ent patients) which are of good quality and classified
as zone 1 ROP in the ground truth. From that, we
can get ten images correctly (83.33% accuracy image-
wise). However, if we take top-2 accuracy score, then
it comes at 100% patient wise as these two images
belong to a patient that had multiple images in the
set. Another one was successfully predicted as Zone-
1 ROP. Also, if we consider images of Zone-2 ROP,
we get 72% accuracy.
5 CONCLUSIONS
In this study, we have reported a proof of concept of
the proposed DL-assisted screening system for reti-
nal disease. In this, we studied, designed and ap-
plied the new system for ROP diagnosis and classi-
fication. We have used image processing and com-
puter vision-based technology for Fundus image pre-
processing and vessels extraction while considering
and testing YOLO-v5 DL-based algorithms to detect
OD. It provides an integrated platform to work data-
driven and rules-based system simultaneously. There-
fore, this can work successfully even in the absence of
a sufficient number of datasets. Also in this approach
doctor can see the results of classification along with
visualization of detected OD and vessels, so doctor
can understand the decision of the system and verify
it.
Additionally, we have tested our approach using
the local hospital premature infants retinal scan. For
the Zone-I ROP, the accuracy of our system is around
83.33%. Currently, the retinal camera uses for retina
scanning has a limited field of view (FOV). Therefore,
it could not capture the entire periphery of the retina
in a single frame. However, for Zone-2 and Zone-3 re-
quired a wider view of the retinal surface, which will
be not possible with the current set-up. Therefore, the
accuracy of our system is low for Zone-2 and Zone-
3, which we hope to significantly improve by using
multiple images obtained during an examination.
ACKNOWLEDGEMENTS
We thank Prof. Prem Kumar Kalra for their extremely
important scientific discussion and information re-
lated to this work.
REFERENCES
Brown, J. M., Campbell, J. P., Beers, A., Chang, K., Ostmo,
S., Chan, R. P., Dy, J., Erdogmus, D., Ioannidis, S.,
Kalpathy-Cramer, J., et al. (2018). Automated diagno-
sis of plus disease in retinopathy of prematurity using
deep convolutional neural networks. JAMA ophthal-
mology, 136(7):803–810.
HEALTHINF 2021 - 14th International Conference on Health Informatics
242

Budai, A., Bock, R., Maier, A., Hornegger, J., and Michel-
son, G. (2013). Robust vessel segmentation in fundus
images. International journal of biomedical imaging,
2013:154860.
Ding, A., Chen, Q., Cao, Y., and Liu, B. (2020). Retinopa-
thy of prematurity stage diagnosis using object seg-
mentation and convolutional neural networks. arXiv
preprint arXiv:2004.01582.
Dogra, M. R., Katoch, D., and Dogra, M. (2017). An up-
date on retinopathy of prematurity (rop). The Indian
Journal of Pediatrics, 84(12):930–936.
Fraz, M. M., Remagnino, P., Hoppe, A., Uyyanonvara, B.,
Rudnicka, A. R., Owen, C. G., and Barman, S. A.
(2012). Blood vessel segmentation methodologies in
retinal images–a survey. Computer methods and pro-
grams in biomedicine, 108(1):407–433.
Guo, X., Kikuchi, Y., Wang, G., Yi, J., Zou, Q., and Zhou,
R. (2020). Early detection of retinopathy of prema-
turity (rop) in retinal fundus images via convolutional
neural networks. arXiv preprint arXiv:2006.06968.
Hoover, A. D., Kouznetsova, V., and Goldbaum, M. (2000).
Locating blood vessels in retinal images by piecewise
threshold probing of a matched filter response. IEEE
Transactions on Medical Imaging, 19(3):203–210.
Islam, M., Poly, T. N., Walther, B. A., Yang, H. C., Li,
Y.-C. J., et al. (2020). Artificial intelligence in oph-
thalmology: A meta-analysis of deep learning models
for retinal vessels segmentation. Journal of clinical
medicine, 9(4):1018.
Islam, M. M., Poly, T. N., and Li, Y.-C. J. (2019). Retinal
vessels detection using convolutional neural networks
in fundus images. bioRxiv, page 737668.
Jocher, G., Stoken, A., Borovec, J., NanoCode012, Christo-
pherSTAN, Changyu, L., Laughing, Hogan, A., loren-
zomammana, tkianai, yxNONG, AlexWang1900, Di-
aconu, L., Marc, wanghaoyang0106, ml5ah, Doug,
Hatovix, Poznanski, J., L. Y., changyu98, Rai, P., Fer-
riday, R., Sullivan, T., Xinyu, W., YuriRibeiro, Clara-
munt, E. R., hopesala, pritul dave, and yzchen (2020).
ultralytics/yolov5: v3.0.
Luo, Y., Chen, K., Mao, J., Shen, L., and Sun, M. (2020).
A fusion deep convolutional neural network based on
pathological features for diagnosing plus disease in
retinopathy of prematurity. Investigative Ophthalmol-
ogy & Visual Science, 61(7):2017–2017.
Organization, W. H. et al. (2019). World report on vision.
Technical report, Geneva: World Health Organization.
Ravichandran, C. and Raja, J. B. (2014). A fast enhance-
ment/thresholding based blood vessel segmentation
for retinal image using contrast limited adaptive his-
togram equalization. Journal of Medical Imaging and
Health Informatics, 4(4):567–575.
Redd, T. K., Campbell, J. P., Brown, J. M., Kim, S. J.,
Ostmo, S., Chan, R. V. P., Dy, J., Erdogmus, D., Ioan-
nidis, S., Kalpathy-Cramer, J., et al. (2019). Evalua-
tion of a deep learning image assessment system for
detecting severe retinopathy of prematurity. British
Journal of Ophthalmology, 103(5):580–584.
Staal, J., Abramoff, M., Niemeijer, M., Viergever, M., and
van Ginneken, B. (2004). Ridge based vessel segmen-
tation in color images of the retina. IEEE Transactions
on Medical Imaging, 23(4):501–509.
Tan, Z., Simkin, S., Lai, C., and Dai, S. (2019). Deep learn-
ing algorithm for automated diagnosis of retinopathy
of prematurity plus disease. Translational Vision Sci-
ence & Technology, 8(6):23–23.
Ting, D. S., Peng, L., Varadarajan, A. V., Keane, P. A.,
Burlina, P., Chiang, M. F., Schmetterer, L., Pasquale,
L. R., Bressler, N. M., Webster, D. R., et al. (2019a).
Deep learning in ophthalmology: the technical and
clinical considerations. Progress in retinal and eye
research.
Ting, D. S. W., Pasquale, L. R., Peng, L., Campbell, J. P.,
Lee, A. Y., Raman, R., Tan, G. S. W., Schmetterer, L.,
Keane, P. A., and Wong, T. Y. (2019b). Artificial in-
telligence and deep learning in ophthalmology. British
Journal of Ophthalmology, 103(2):167–175.
Wang, J., Ju, R., Chen, Y., Zhang, L., Hu, J., Wu, Y., Dong,
W., Zhong, J., and Yi, Z. (2018). Automated retinopa-
thy of prematurity screening using deep neural net-
works. EBioMedicine, 35:361–368.
Wang, X., Jiang, X., and Ren, J. (2019). Blood vessel seg-
mentation from fundus image by a cascade classifica-
tion framework. Pattern Recognition, 88:331 – 341.
Yavuz, Z. and K
¨
ose, C. (2017). Blood vessel extraction
in color retinal fundus images with enhancement fil-
tering and unsupervised classification. Journal of
Healthcare Engineering, 2017:1–12.
Yildiz, V. M., Tian, P., Yildiz, I., Brown, J. M., Kalpathy-
Cramer, J., Dy, J., Ioannidis, S., Erdogmus, D.,
Ostmo, S., Kim, S. J., et al. (2020). Plus disease in
retinopathy of prematurity: Convolutional neural net-
work performance using a combined neural network
and feature extraction approach. Translational Vision
Science & Technology, 9(2):10–10.
Zhang, Y., Wang, L., Wu, Z., Zeng, J., Chen, Y., Tian, R.,
Zhao, J., and Zhang, G. (2018). Development of an
automated screening system for retinopathy of prema-
turity using a deep neural network for wide-angle reti-
nal images. IEEE Access, 7:10232–10241.
Deep Learning Assisted Retinopathy of Prematurity Screening Technique
243
