
Effects of Electrical Fields on Neuroblastoma (N2A) Cell
Differentiation: Preliminary Results
Daniel Martin Fernández
1
, Pablo Pérez García
1a
, María E. Martín
2b
, Paula Daza
2c
,
Juan Alfonso Serrano-Viseas
1d
, Gloria Huertas
1e
and Alberto Yúfera
1f
1
Instituto de Microelectrónica de Sevilla (IMSE), Universidad de Sevilla, Av. Americo Vespuccio, S/N Sevilla, Spain
2
Departamento de Biología Celular, Facultad de Biología, Universidad de Sevilla, Av. Reina Mercedes, S/N, Sevilla, Spain
Keywords: Biomedical Circuits, Electrical Pulse Stimulation (EPS), Microelectrodes, Neuroblastoma (N2A), Stem Cell
Differentiation.
Abstract: This work describes Electrical Stimulations (ES) assays on stem cells. The neuroblastoma (N2A) cell linage
was submitted to several electrical fields to enable and enhance its differentiation toward neurons. Both Direct
Current (DC) and Alternated Current (AC) time dependent electric field protocols were applied to N2A cell
culture under differentiation conditions, obtaining different responses. Control and electrically excited
samples’ number of differentiated cells and neurite lengths were measure after differentiation. Results showed
that DC fields have a strong influence on N2A differentiation since the percentage of differentiated cells and
the neurites lengths were the highest. In addition, a significant alignment of neurites measured with the applied
electrical field has been detected, which demonstrates the high sensitivity of differentiation processes to
electrical field polarity.
1 INTRODUCTION
In the most advanced organisms, each cell has a
specific function, being its morphology and
physiology adapted for greater efficiency carrying out
that function. This process is known as
differentiation. Cellular differentiation, therefore, is
the process by which a cell pauses its division process
and changes its function and phenotype; that is, it
expresses parts of its DNA that were previously
suppressed and vice versa. In our specific case, N2A
cells differentiate into neurons. Undifferentiated N2A
cells are small and round; when differentiation
begins, the cytoplasm extends in one or more
directions, forming threads called neurites, also the
cell flattens (Echalier, 2018).
N2A can be cultivated in suspension or with
substrate. Differentiation occurs either way;
although, in suspension cultures, the morphology
a
https://orcid.org/0000-0001-7283-7254
b
https://orcid.org/0000-0002-3204-1726
c
https://orcid.org/0000-0001-5170-1868
d
https://orcid.org/0000-0001-9881-0148
e
https://orcid.org/0000-0001-5851-2576
f
https://orcid.org/0000-0002-1814-6089
remains round and the number of differentiated cells
decreases; these cells, once transferred to a culture
with substrate, reach a normal degree of
differentiation and a flat morphology. Cells cultured
with substrate differentiate with a normal rate and flat
morphology (Figure 1) (Ross, 1975).
Figure 1: N2A cells in the process of differentiation:
Suspension culture (left) and substrate culture (right) (Ross,
1975).
152
Fernández, D., García, P., Martín, M., Daza, P., Serrano-Viseas, J., Huertas, G. and Yúfera, A.
Effects of Electrical Fields on Neuroblastoma (N2A) Cell Differentiation: Preliminary Results.
DOI: 10.5220/0010320101520159
In Proceedings of the 14th International Joint Conference on Biomedical Engineering Systems and Technologies (BIOSTEC 2021) - Volume 1: BIODEVICES, pages 152-159
ISBN: 978-989-758-490-9
Copyright
c
2021 by SCITEPRESS – Science and Technology Publications, Lda. All rights reserved
An Electric Field (EF) plays, under the adequate
electrostimulation (ES) protocol, a relevant role in the
reorganization of the cell cytoskeleton (McCaig,
2005) (Villanueva, 2019). Normally, cytoskeletal
reorganization is mediated, inter alia, by extracellular
signaling kinase dependent (ERK) pathways. A
signaling pathway is a common process at the cellular
level. It starts from a chemical reactant that initiates a
series of reactions within the cell; this ultimately
produces a result. Signaling pathways are the primary
method most cells use to transmit and translate
chemical signals. The ERK pathway produces
cytoskeletal reorganization and, ultimately, cell
differentiation. One of the steps in this signaling
pathway is dependent on cyclic adenosine
monophosphate (cAMP) (Liu, 2001). Several studies
have demonstrated the efficacy of cAMP (Chang,
1976), or of factors that increase cAMP activity
(Chatterjee, 1992), (Tremblay, 2009), inducing cell
differentiation in N2A, as well as the efficacy of β -
Hydroxy-β-methylbutyrate (HMB). HMB, in turn,
activates the ERK signaling cascade (Salto, 2015).
There are also authors that claim that cyclic AMP acts
similarly, when it is activated by an electric field and
it is activated by chemical factors (Pullar, 2005),
when it comes to migrating keratinocytes. This could
prove that the application of an electric field produces
the activation of cAMP. With this information, it is
possible to link electrostimulation and cell
differentiation. There could be a relationship between
the application of electrostimulation and the ERK
signaling cascade; possibly involving the activation
of cyclic AMP. Therefore, an electric field could use
the ERK signaling pathway to reorganize the
cytoskeleton and ultimately lead to cell
differentiation, by activating cAMP.
The main objective of this work is to promote the
differentiation and growth of neurites in mouse N2A
cells, applying electric fields during the
differentiation process. To achieve that, two
experiments will be carried out with different
electrostimulation protocols, keeping the same cell
incubation protocol. Experiments are planned to
compare the efficacy of both excitation protocols
enabling the differentiation of N2A cells into
neurons. The proposed electrostimulation system
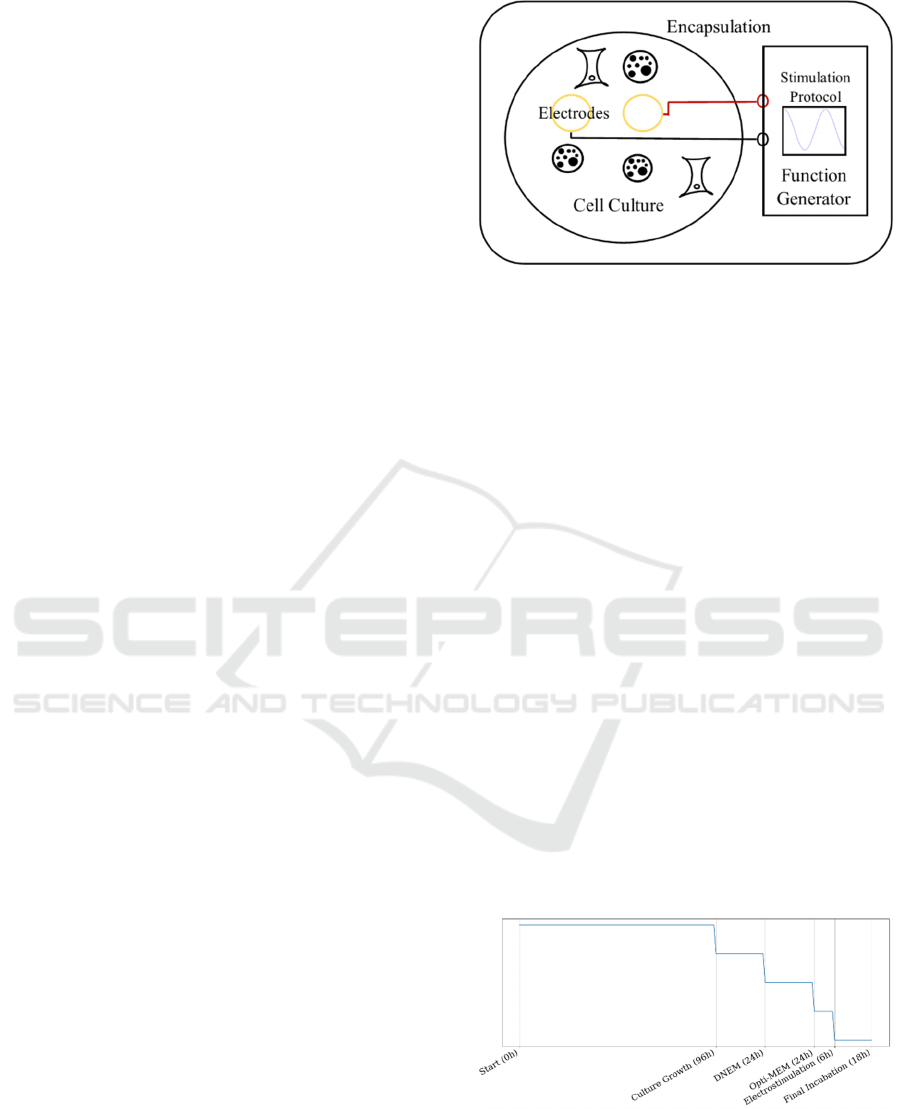
main blocks are shown in Figure 2. The functional
blocks are: the electrodes for cell culture; the circuits
for electrical stimulation, generating the proposed
signals, and the electrical system encapsulation for
insulation inside the incubator. Two electrical signals
(protocols) are applied: DC, with several values, and
squared signals at the same frequency and duty
cycles, modifying its amplitude.
Figure 2: Main blocks in proposed electrostimulation
system.
2 MATERIALS AND METHODS
This section will describe the experimental procedure
followed on electrostimulation assays with N2A.
2.1 N2A Cell Culture
Initially, 25,000 cells were seeded for the first
experiment (DC) and 12,500 cells for the second
(AC), both in 600ml, located on each of the 8 wells of
the plate, that will be explained in the next section.
The DC culture grew for 72 hours and the AC for 96
hours. For sample preparation, DNEM (Dulbecco's
Modified Eagle Medium) was added initially.
Subsequently, they were placed in an incubator at
37ºC with 5% CO2 for 24 hours. This medium was
then removed and serum-free medium (Opti-MEM,
Reduced Serum Medium) was added for the cells to
differentiate, and returned to the incubator for 24
hours more. After that time, electrostimulation was
carried out for 6 hours. Once 18 hours more of
incubation had passed, the experiment was finished
(Figure 3) and the results obtained were evaluated.
Figure 3: AC incubation protocol.
2.2 Electrodes
The choice of electrodes is important. The results will
depend on the material from which they are made of,
Effects of Electrical Fields on Neuroblastoma (N2A) Cell Differentiation: Preliminary Results
153
their geometry, and layout. In many studies, the
culture is made in Petri dishes and, therefore, there is
total freedom in the choice of electrodes and their
configuration. The best electrode arrangement is
calculated then, as well as some way to place them in
that arrangement. In our case, the culture took place
in wells on a plate with electrodes, so all these
drawbacks were eliminated. The chosen plate is
specifically designed for Electrical Cell Impedance
Sensing (ECIS) techniques, being applicable directly
to electrostimulation assays. As advantages: it can be
used with large numbers of cells, it reduces
impedance fluctuations, its electrodes are uniformly
arranged in space, and all wells hold the same
volume. The cells were cultured in wells located in a
commercial plate from Applied Biophysics (Applied
Biophysics, 2020) using the model 8W10E+ from the
ECIS Cultureware line shown in Figure 4.
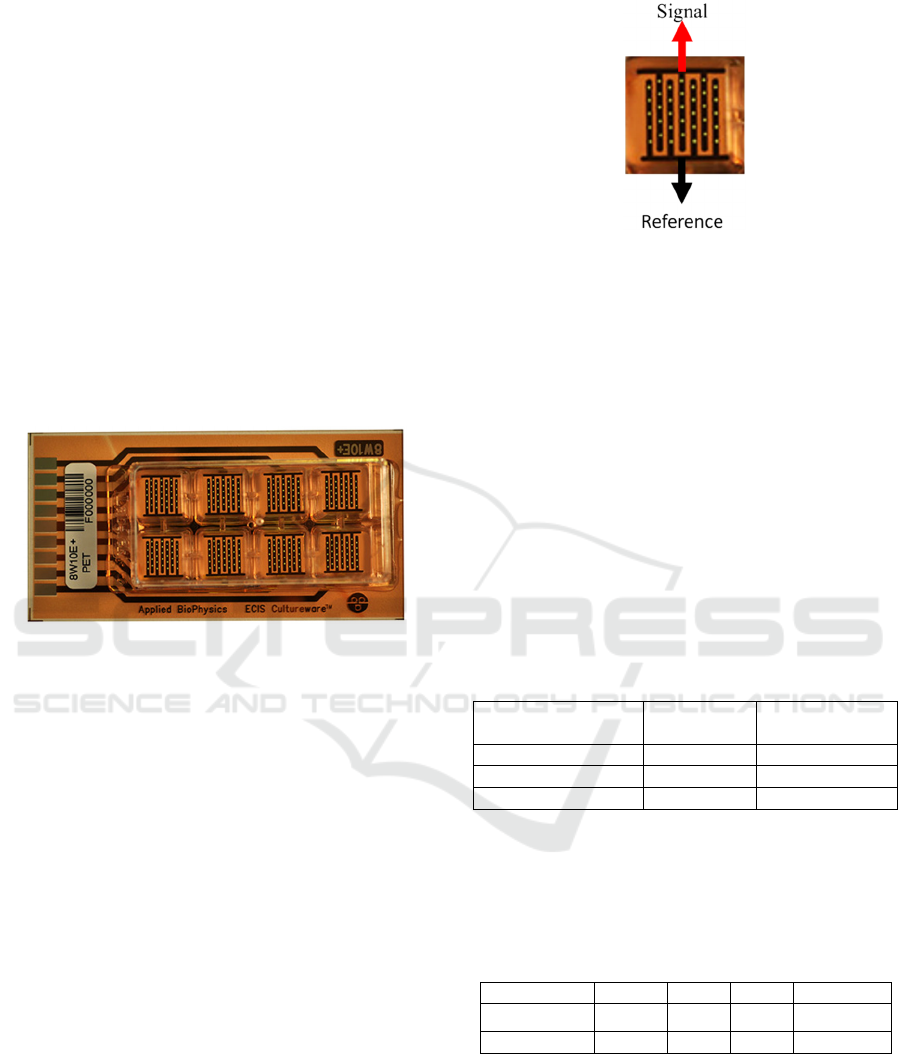
Figure 4: AB Electrodes (Applied Biophysics, 2020).
Each of the eight wells has two sets of 20 circular
electrodes with a diameter of 250µm. The electrodes
are arranged in an interlocking fingers (interdigit)
configuration, where sets of five electrodes face each
other; one set with the signal and one with the
reference, as it is illustrated in Figure 5.
The electrostimulation signal, therefore, will be
applied from the working to the reference electrodes
and vice versa. It was necessary to calculate the
separation between both electrodes to apply the
electric field with the correct amplitude, in terms of
volts by centimeter [V/cm]. For this end, the distance
tool within Matlab image tools, was employed.
Knowing that the diameter of the electrode is 250 µm,
we could extrapolate the distance between the
electrodes. We calculate the distance between
electrodes, in pixels, as the average of the
measurements taken, and we applied the conversion
factor calculated previously. The result is 0.947mm,
approximately. With this data, we were able to
transform the amplitudes defined in V/cm to specific
voltages for our experimental setup.
Figure 5: Electrode configuration inside a well. There are
20 gold electrodes in parallel (working electrode) vs 20
gold electrodes in parallel (reference electrode). Each
circular electrode has a 250µm diameter. Model 8W10E+.
2.3 Stimulation Circuits. ES Signals
2.3.1 DC ES Signals
In the first experiment, four direct current signals
were used, one of them being ground. The
characteristics of the signals were chosen according
to the bibliography. The main work contributions to
DC electrostimulation of N2A cells and similar are in
Table 1. The chosen amplitude values are consistent
with the values that other authors have used in their
studies, and specifically with this cell type.
Table 1: Summary of the voltage amplitudes reported for
DC electrostimulation.
Cell line Amplitude
(V/cm)
Ref.
N2A 1.1-10 (Jain, 2013)
SH-SY5Y 1.5 (Xiong, 2015)
Xenopus Neurons 0.1 - 10 (Jaffe, 1977)
Considering the values in Table I, and the distance
between electrodes of 1mm, the V/cm values are
calculated for our electrode setup. The final DC
amplitudes in our assay are listed in Table 2.
Table 2: Amplitude selected for the DC assay.
Amplitude 1 2 3 4 (GND)
(mV)
125 250 500 0
(V/cm) 1.25 2.5 5 0
For the electrostimulation circuit, an inverter
amplifier was used, built with an operational
amplifier and two resistances, with its gain defined by
the resistance’s ratio.
BIODEVICES 2021 - 14th International Conference on Biomedical Electronics and Devices
154
2.3.2 AC ES Signals
In the case of alternating current, more parameters
had to be decided, not only the amplitude, but also the
waveform, frequency and pulse width (Table 3).
Three different signals were applied. To make
comparisons between setups and to facilitate the
assembly of the circuit, it was decided to apply the
same signal with three different amplitudes, as in the
case of direct current. Ours, as well as other possible
proposals are listed in Table 3. The squared signal
proposed in this work is illustrated in Figure 6.
Table 3: ES parameters for AC assays.
Signal Freq
[Hz]
Pulse
width
Amplitu
de
Ref.
Squa.
Bipha.
100 2.5ms pos
2.5ms neg
125,250,
500
mV/mm
This work
Squa.
Bipha
n.a. 200µs–1ms 100mV-
2V
(Braeken,
2009)
Squa.
Bipha
100 50-200µs 4 -
32µA/cm
(Chang,
2011)
Sin 1,10,50 ---- 1V/cm (Lim, 2013)
Squa. 100 5ms 300mV/m
m
(Chang,
2016)
Squa. 1 2ms 5V (Xiong,
2015)
Squa. 1,3,5 0.25–10ms 1 –
6V/cm
(Tandon,
2011)
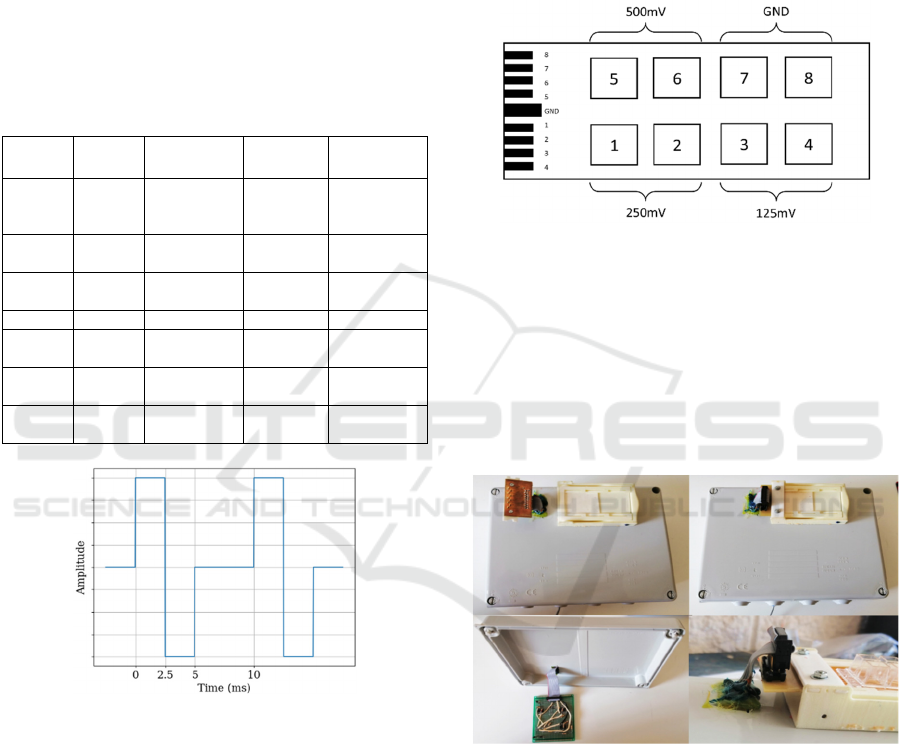
Figure 6: Proposed waveform for the AC signal. Three
amplitudes are considered. Frequency is 100Hz, and the
selected amplitudes are 100mV, 200mV and 425mV.
The timer circuit generates square pulses of
frequency 100Hz and pulse width 2.5ms; in addition
to a circuit that varied its amplitude. It was decided to
use assemblies based on the 555 integrated circuit
(IC) for the timer and differential amplifiers based
opamps for the amplitude variation. The timing
circuit needed a square pulse generator and two
circuits to regulate the width of the pulse, one for the
positive pulse and one for the negative pulse; both
pulses had to happen one immediately after the other.
With two IC 555s in monostable mode we would be
able to do that. Later we would use a differential
amplifier to invert the negative pulse and combine it
with the positive one, in addition to regulating the
amplitude of both. In this from, we would have the
complete circuit to generate one of the three AC
signals. Each, DC and AC signal is applied to two
wells. Figure 7 displays the plate layout of the DC
signals applied. AC is similar.
Figure 7: Proposed DC signals layout. Each DC signal is
applied to two wells. Wells 7 and 8 are the controls.
2.4 System Encapsulation
The whole electrostimulation system, circuits plus
electrodes, was put inside an incubator during
experiments. Cells in the plate were set over the cage,
while the circuits were placed inside it, to insulate
them from the incubators conditions (Figure 8).
Figure 8: Cage system: electrode wells are put over the cage
and the electrostimulation circuits inside.
2.5 Cell Measurements
Several measurements were performed, to evaluate
the performance assay.
Number of cells
Number of differentiated cells
Number of neurites
Neurite lengths
Neurite polarization
Effects of Electrical Fields on Neuroblastoma (N2A) Cell Differentiation: Preliminary Results
155
3 EXPERIMENTAL RESULTS
The experimentation process consists of several parts:
the first is the culture of N2A cells, then
electrostimulation is carried out and, finally,
photographs are taken under the microscope of each
electrode. This procedure lasted three days, during
which the direct current and alternating current
experiments were carried out in an overlapping
manner. The cultures had been prepared previously,
according to the procedure detailed in the Material
and Methods section.
After the stimulation process, an optical
microscope and a Leica family camera were used to
take the snapshots, communicating to a computer
using the LAS EZ software (Leica, 2020). Using this
procedure, we were able to take pictures of each
electrode, whilst adjusting parameters such as
exposition, gain, gamma, etc. to highlight neurites on
differentiated cells. Only images that provided
information were taken, that is, electrodes with
multiple layers of cells or damaged electrodes would
not be photographed. The photographs were stored in
folders according to their well.
From the pictures taken, the several paramezters
proposed to characterize the experiment were measure:
number of cells, number of differentiated cells, number
of neurites, length of neurites and neurite polarization.
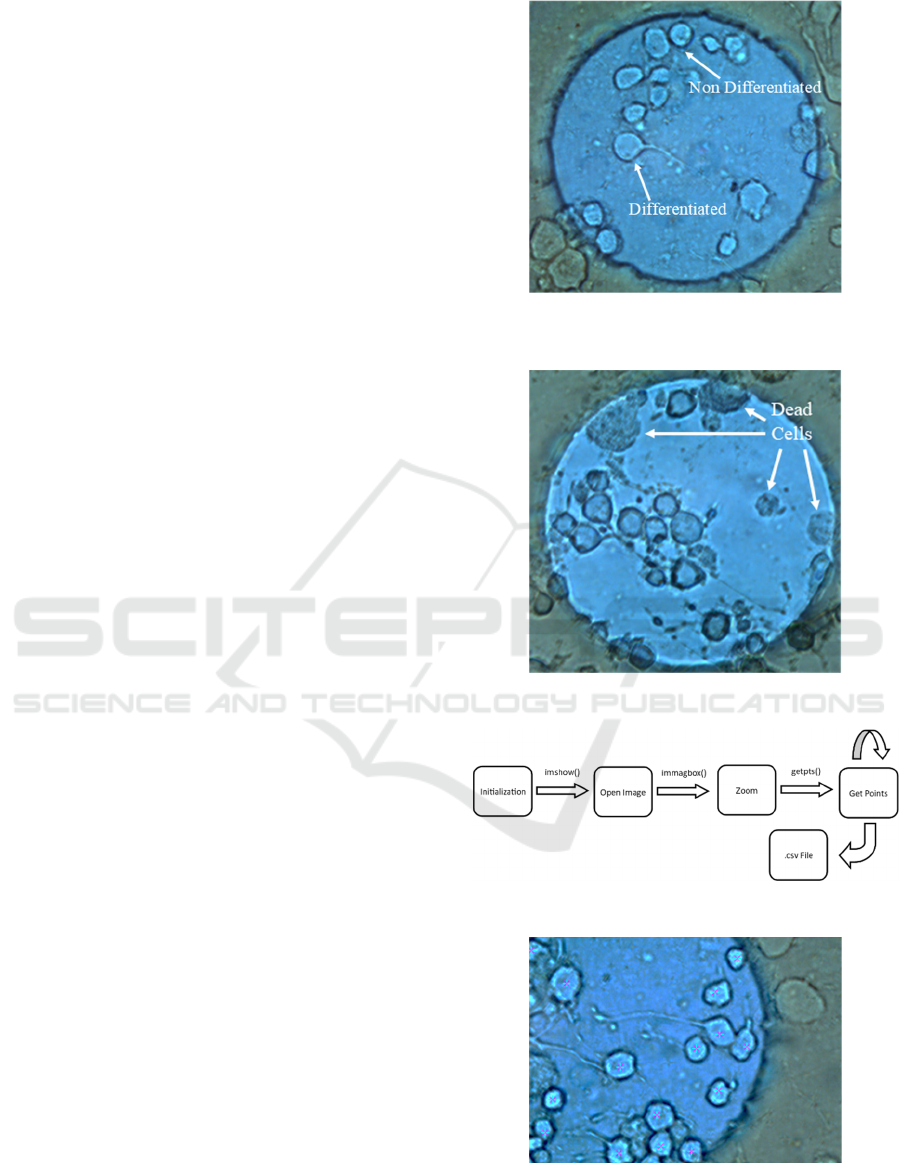
To distinguish between differentiated and
undifferentiated cells, a criterion based on morphology
was followed: cells with extensions (neurites) are
differentiated cells (Figure 9). On the other hand, it was
necessary to distinguish between living and dead cells.
Dead cells are normally found in “spongy”-looking
aggregates (Figure 10).
With clear criteria, the cells were counted first. A
Matlab script was programmed for this task (Figure
11). The script opens the images found in the folder
(corresponding to a well) one by one, that is, it opens
one and, when given the order, closes it and opens the
next one. Once an image is opened, the view is
zoomed in, in order to visualize the electrode better;
click where a cell is to count it, and when all have
been counted, proceed with the differentiated cells.
After that, the image will be closed and the next one
will be opened. Once finished, the script will generate
a .csv file with the number of total cells in each image,
another with the differentiated cells and another with
the
coordinates of the points where the differentiated
cells are (Figure 12).
Figure 9: Example: differentiated and non-differentiated
cell.
Figure 10: Example: dead cells.
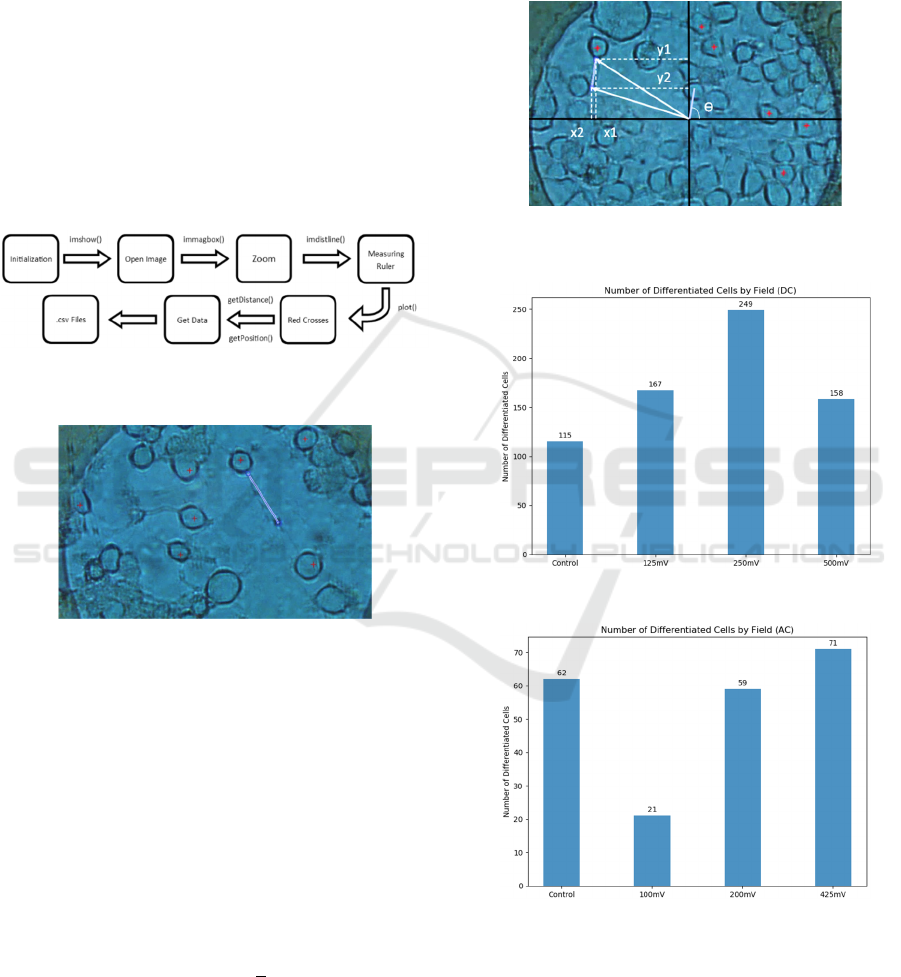
Figure 11: Cell counting Matlab script block diagram.
Figure 12: Matlab display when cells are being counted.
BIODEVICES 2021 - 14th International Conference on Biomedical Electronics and Devices
156
The next step was to count and measure the
neurites of the differentiated cells. For this, another
script has been developed in Matlab (Figure 13). This
script opens the images in a similar way to the
previous one, in this case the coordinates of the points
calculated in the last step are read in order to mark the
differentiated cells with a red cross. In turn, a ruler
with two moving points is shown. The ruler must be
placed at the beginning and end of the neurite and
when given the order, the length of the neurite, its
starting point and its end are recorded. When the last
neurite of an image is measured, the order is given
and the image changes to the next. Subsequently, two
.csv files are generated, one with the distances of the
neurites per electrode and the other with the starting
and ending points of the neurites (Figure 14).
Figure 13: Neurite length measuring Matlab script block
diagram.
Figure 14: Example measuring the neurite length with
Matlab.
As additional information, the orientation of the
neurites has also been obtained, that is, the angle they
form in the image, respect a given coordinate origin.
This was possible thanks to the nature of the
information extraction process from the images. By
knowing the start and end points of the neurite (Figure
15), it was possible to obtain the angle it forms, using
the inverse of the tangent; as shown in Equation (1).
This approximation, although not perfect, allows us
to recognize some type of pattern in the angles of the
neurites, if it exists.
tan
(1)
Where y = (y1-y2), x = (x1-x2) and ϴ is the angle
that the neurite forms (Figure 15).
An extensive analysis was performed to obtain the
expected measurements from the experiment. In the
following are summarized some of the more relevant,
illustrating the sensitivity of N2A cells to DC and AC
electric fields. Figures 16 and 17 show the mean value
of the number of differentiated cells in DC and AC
conditions, for the several values of amplitudes
applied.
Figure 15: Parameters used in the calculus of the neurite
angle. The center of the electrode is taken as reference axis.
Figure 16: Number of differentiate cells vs DC level.
Figure 17: Number of differentiate cells vs AC level.
The percentage of differentiate cell, with respect
to the total number of counted cells is displayed in
Figures 18 and 19, for DC and AC conditions
respectively. The efficiency on differentiation seems
to be higher for DC electrical fields, being highest at
125mV (1.25V/cm).
Effects of Electrical Fields on Neuroblastoma (N2A) Cell Differentiation: Preliminary Results
157
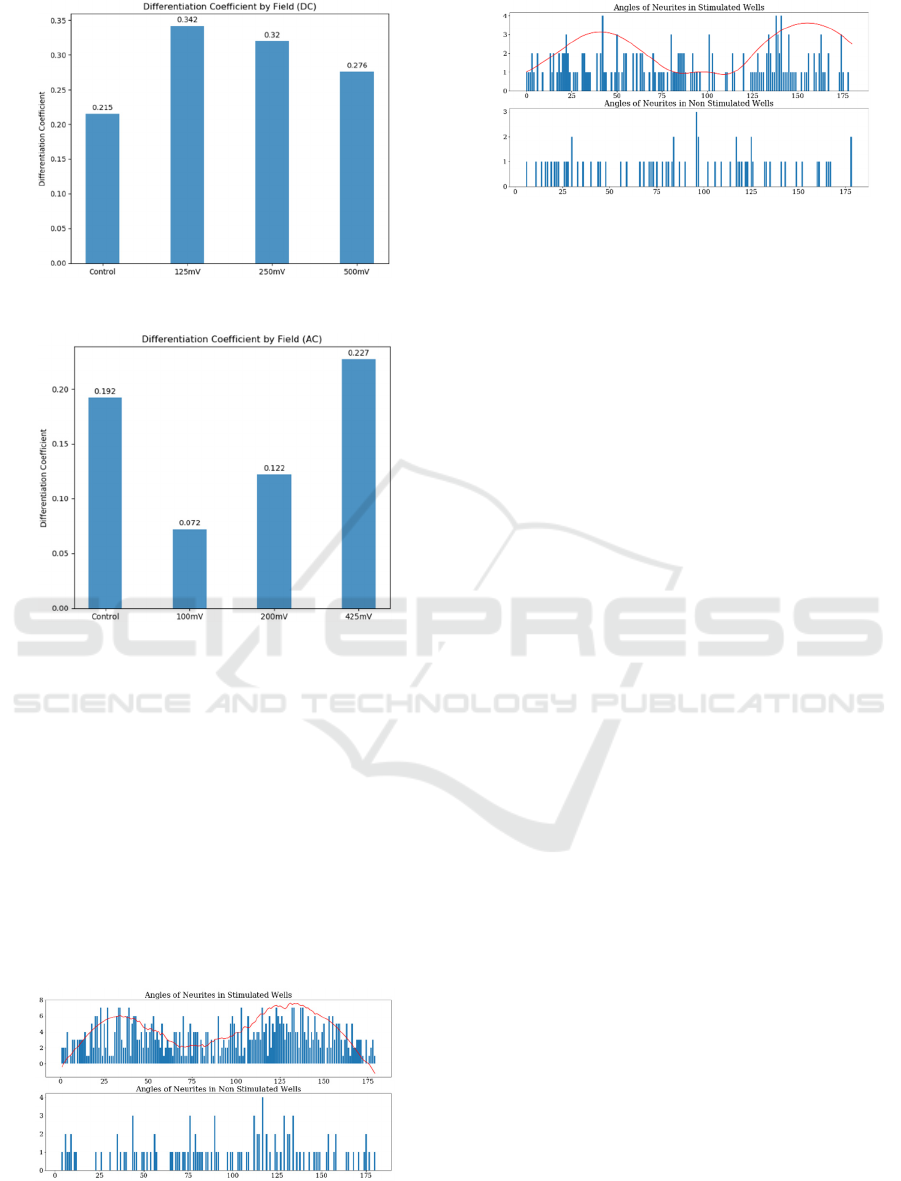
Figure 18: Differentiation coefficient for DC.
Figure 19: Differentiation coefficient for AC.
Finally, the phase angle tested over the
photographs for the two assays (DC and AC) are
displayed on Figures 20 and 21, together with their
respective controls. In both cases (DC and AC), it can
be appreciated a high polarization around (25º- 40º)
and (130º-150º) intervals, validating the fact that one
of the neurite answers to electrical field is its biasing
along the applied ES electric field (Patel, 1982).
The presented results show how N2A cells can be
electro-stimulated using lateral electric fields defined
from the bottom electrodes, and how their neurites
were biased along the direction defined by the electric
fields applied.
Figure 20: Neurites polarization (DC): Number of neurites
measure for each angle between 0º and 180º. The red line
represents an approximated fitting curve.
Figure 21: Neurites polarization (AC): Number of neurites
measure for each angle between 0º and 180º. The red line
represents an approximated fitting curve.
4 CONCLUSIONS
An experimental procedure and the results of
electrostimulation assays on neuroblastoma cells, in
the process of differentiation towards neurons, have
been presented. Two types of signals were utilized on
the experiments: the first one consisting of a direct
current voltage signal and the second one a biphasic
square voltage signals at 100 Hz, both with three
different amplitudes. The results obtained
demonstrate that, for the selected amplitude values,
the differentiation process is more sensitive to DC
than to AC signals, with similar amplitudes. This
could be due to the biphasic nature of the AC signal
applied. A biphasic signal polarizes cells in the two
directions of the electrical field, whilst a DC signal
only polarizes towards the cathode. Another factor to
keep in mind is the rms value of the AC, this being,
approximately, 0.71 times the amplitude of the signal.
Therefore, the AC signals applied have less effective
amplitude than the DC ones. This could also explain
the tendency seen in Figure 19, where the coefficient
increases as the amplitude does. The optimum lateral
ES field values, 100mV/mm, is coincident with the
reported by other authors (Jain, 2013), using vertical
electrical fields over its setup. This result supported
the validity of the assays. A remarkable alignment of
the neurites was observed on the maximum electric
field directions expected (30º – 150º), which means a
polarization response of N2A cells to external
stimulus, as stated in (Patel, 1982). More in-depth
experiments must be done in AC ES, for wider
frequency ranges and duty cycles, to fully
characterize ES signals effects on N2A
differentiation. In addition, higher/smaller ES periods
of 6h should be tested, for the same reason. Finally,
as future work, it is programmed to incorporated
some biomarkers, as cAMP, in parallel with
electrostimulation, for biological validation of the
assays.
BIODEVICES 2021 - 14th International Conference on Biomedical Electronics and Devices
158

ACKNOWLEDGEMENTS
This work was supported partially by the Spanish
founded Project: System for measure and
electrostimulation applied to differentiation and
motility of cells. P18-FR-2308. PAIDI 2020 Project.
Funded by: Junta de Andalucía, Consejería de
Economía y Conocimiento, and also by the Spanish
Government’s Ministerio de Ciencia, Innovación y
Universidades, Plan Estatal 2017-2020 Retos-
Proyectos I+D+I: Real time monitoring of
hemodynamic variables using intelligent stents
(iSTENT) with capacitive sensors and bioimpedance,
under the project RTI2018-093512-B-C21, co-
financed with FEDER.
REFERENCES
Applied Biophysics, 2020, ECIS Cultureware 8W10E+.
https://www.biophysics.com/cultureware.php#8W10E
Plus.
Braeken, D. et al., 2009, “Local electrical stimulation of
single adherent cells using three-dimensional electrode
arrays with small interelectrode distances.” Conference
proceedings : IEEE EMBS. Annual Conference, pp.
2756–2759, doi: 10.1109/IEMBS.2009.5333871.
Chang, J. H. T. and Prasad, K. N., 1976, “Differentiation of
mouse neuroblastoma cells in vitro and in vivo induced
by cyclic adenosine monophosphate (cAMP),” Journal
of Pediatric Surgery, vol. 11, no. 5, pp. 847–858, doi:
10.1016/0022-3468(76)90113-5.
Chang, K.-A. et al., 2011, “Biphasic Electrical Currents
Stimulation Promotes both Proliferation and
Differentiation of Fetal Neural Stem Cells,” PLoS ONE,
6 (4), p. e18738, doi: 10.1371/journal.pone.0018738.
Chang, H. F., Lee, Y. S., Tang, T. K., and Cheng, J. Y.,
2016, “Pulsed DC electric field-induced differentiation
of cortical neural precursor cells,” PLoS ONE, vol. 11,
no. 6, pp. 1–16, doi: 10.1371/journal.pone.0158133.
Chatterjee, D., Chakraborty, M. and Anderson, G. M.,
1992, “Differentiation of Neuro-2a neuroblastoma cells
by an antibody to GM3 ganglioside,” Brain Research,
vol. 583, no. 1–2, pp. 31–44, doi: 10.1016/S0006-
8993(10)80007-1.
Echalier, G., 2018, Cells or Tissues in Course of
Differentiation. Elsevier Inc.
Jaffe, L. F. and Nuccitelli, R., 1977, “Electrical controls of
development,” Annual review of biophysics and
bioengineering, vol. 6, no. 2, pp. 445–476, doi:
10.1146/annurev.bb.06.060177.002305.
Jain, S., Sharma, A. and Basu, B., 2013, “Vertical electric
field stimulated neural cell functionality on porous
amorphous carbon electrodes,” Biomaterials, 34(37),
9252–9263, doi: 10.1016/j.biomaterials.2013.08.057.
LAS EZ - LEICA. 2020. https://www.leica-
microsystems.com/es/productos/software-de-
microscopia/detalles/product/show/Products/leica-las-
ez/.
Lim, J. H., McCullen, S. D., Piedrahita, J. A., Loboa, E. G.,
and Olby, N. J., 2013, “Alternating current electric
fields of varying frequencies: Effects on proliferation
and differentiation of porcine neural progenitor cells,”
Cellular Reprogramming, vol. 15, no. 5, pp. 405–412,
doi: 10.1089/cell.2013.0001.
Liu, F., Verin, A. D., Borbiev, T., and Garcia, J. G. N.,
2001, “Role of cAMP-dependent protein kinase A
activity in endothelial cell cytoskeleton
rearrangement,” American Journal of Physiology -
Lung Cellular and Molecular Physiology, vol. 280, no.
6 24-6, pp. 1309–1317, doi:
10.1152/ajplung.2001.280.6.l1309.
McCaig,C. D., Rajnicek, A. M., Song, B. and Zhao, M.,
2005,“Controlling cell behavior electrically: Current
views and future potential,” Physiological Reviews, vol.
85, no. 3, pp. 943–978, doi:
10.1152/physrev.00020.2004.
Patel, N., and Poo, M. M., 1982, “Orientation of neurite
growth by extracellular electric fields,” Journal of
Neuroscience, vol. 2, no. 4, pp. 483–496, doi:
10.1523/jneurosci.02-04-00483.1982.
Pullar, C. E. and Isseroff, R. R., 2005, “Cyclic AMP
mediates keratinocyte directional migration in an
electric field,” Journal of Cell Science, vol. 118, no. 9,
pp. 2023–2034, doi: 10.1242/jcs.02330.
Ross, J., Olmsted, J. B., and Rosenbaum, J. L., 1975, “The
ultrastructure of mouse neuroblastoma cells in tissue
culture,” Tissue and Cell, vol. 7, no. 1, pp. 107–135,
doi: 10.1016/S0040-8166(75)80010-3.
Salto, R. et al., 2015, “β-Hydroxy-β-methylbutyrate (HMB)
promotes neurite outgrowth in Neuro2a cells,” PLoS
ONE, vol. 10, no. 8, pp. 1–13, doi:
10.1371/journal.pone.0135614.
Tandon, N., Marsano, A., Maidhof, R., Wan, L., Park, H.,
and Vunjak-Novakovic, G., 2011, “Optimization of
electrical stimulation parameters for cardiac tissue
engineering,” Journal of tissue engineering and
regenerative medicine, vol. 5, no. 6, pp. e115-25, doi:
10.1002/term.377.
Tremblay, R. G., Sikorska, M., Sandhu, J. K., Lanthier, P.,
Ribecco-Lutkiewicz, M., and Bani-Yaghoub, M., 2010,
“Differentiation of mouse Neuro 2A cells into
dopamine neurons,” Journal of Neuroscience Methods,
vol. 186, no. 1, pp. 60–67, doi:
10.1016/j.jneumeth.2009.11.004.
Villanueva, P, Pereira, S., Olmo, A., Pérez, P. Yuste, Y.,
Yúfera, A., de la Portilla, F., 2019, Electrical Pulse
Stimulation of Skeletal Myoblast Cell Cultures with
Simulated Action Potential. Journal of Tissue
Engineering and Regenerative Medicine. vol. 13, no 7,
pp:1265-1269. doi: 10.1002/term.28692019.
Xiong, G. M., Do, A. T., Wang, J. K., Yeoh, C. L., Yeo, K.
S. and Choong, C. 2015, “Development of a
miniaturized stimulation device for electrical
stimulation of cells,” Journal of Biological
Engineering, vol. 9, no. 1, doi: 10.1186/s13036-015-
0012-1.
Effects of Electrical Fields on Neuroblastoma (N2A) Cell Differentiation: Preliminary Results
159
