
On-site Sensor Noise Evaluation and Detectability
in Low Cost Accelerometers
Marco Manso
1a
and Mourad Bezzeghoud
2b
1
Instituto de Ciências da Terra, Universidade de Évora, Évora, Portugal
2
Departamento de Física (ECT), Instituto de Ciências da Terra (IIFA), Universidade de Évora, Portugal
Keywords: Accelerometers, Seismology, Environmental Monitoring, Noise.
Abstract: Seismic networks help understanding the phenomena related with seismic events. These networks are
employing low-cost accelerometers in order to achieve high-density deployments enabling accurate
characterisation (high resolution) of strong earthquake motion and early warning capabilities. In order to
assess the applicability of low-cost accelerometers in seismology, it is essential to evaluate their noise
characteristics and identify their detectability thresholds. In this paper, a method is proposed that provides an
indication of sensor noise, being demonstrated on different sensors. The method is designed to adapt to a
sensor’s characteristics while on-site and in-operation, thus removing potentially related logistical and
maintenance bottlenecks.
1 INTRODUCTION
Seismic events can be extreme and severe threats to
humanity, causing a heavy death toll, serious
destruction and damage. Helping to understand these
phenomena, seismic networks have been deployed in
increasing number, filling in gaps in the global
coverage and improving our understanding of the
physical processes that cause earthquakes.
For example, Portugal has made a significant
effort to develop the Broadband Portuguese seismic
network integrating seismological stations supporting
real-time monitoring of the earthquake activity
(Caldeira et al., 2007). The Portuguese national
network (Instituto Português do Mar e da Atmosfera
- IPMA) is the seismic monitoring of all the
Portuguese territory, from the Azores and Madeira
archipelagos to the mainland territory, covering the
extensive Azores-Gibraltar plate boundary segment.
This national network also contributes to global
monitoring efforts.
EMSO-PT (http://emso-pt.pt/), the Portuguese
counterpart of the European Multidisciplinary
Seafloor and water column Observatory (EMSO), is
an infrastructure jointly funded by the Portuguese
government and the European Commission that aims
a
https://orcid.org/0000-0003-0953-049X
b
https://orcid.org/0000-0002-4908-0422
to create and develop infrastructures for scientific and
technological research within the scope of Marine
Sciences. One the goals of EMSO-PT is to improve
the national seismic monitoring network, thus
allowing for the development of an Earthquake Early
Warning System (EEWS), including those generated
in the Atlantic region in and adjacent to the
Portuguese territory. Considering the seismogenic
Eurasia-Nubia plate boundary located south of
mainland Portugal, current efforts by the Instituto de
Ciências da Terra (ICT), University of Évora (UE)
and IPMA aim to densify the seismic network in the
extreme west of the Algarve.
A paradigm change occurred in the United States
by deploying high density seismic networks with the
capability to record the propagation of seismic
activity in high resolution: The California Institute of
Technology (CalTech) that established the
Community Seismic Network (CSN), an earthquake
monitoring system based on a dense array of low-cost
acceleration sensors (more than 1000) aiming to
produce block-by-block strong shaking
measurements during an earthquake (see
http://csn.caltech.edu/, last accessed 2020/08/14);
The University of Southern California's (USC)
Quake-Catcher Network (QCN) began rolling out
100
Manso, M. and Bezzeghoud, M.
On-site Sensor Noise Evaluation and Detectability in Low Cost Accelerometers.
DOI: 10.5220/0010319001000106
In Proceedings of the 10th International Conference on Sensor Networks (SENSORNETS 2021), pages 100-106
ISBN: 978-989-758-489-3
Copyright
c
2021 by SCITEPRESS – Science and Technology Publications, Lda. All rights reserved

6000 tiny sensors in the San Francisco Bay Area,
being part of the densest networks of seismic sensors
ever devoted to study earthquakes in real time (see
https://quakecatcher.net/, last accessed 2020/08/14).
Following this trend, the ICT and UE are
developing the Seismic Sensor Network Alentejo
(SSN-Alentejo) that brings the most dense seismic
sensor network ever deployed in Portugal. This novel
network plans to deploy 60 low-cost sensors
distributed in a mesh configuration spaced on average
10 km and covering an area of about 5000 square
kilometres (Manso et. al, 2020).
A high dense network-enabled seismic network
operating in the principle of “live” data brings the
opportunity to explore new applications in
seismology, including real-time earthquake detection,
more accurate characterisation (high resolution) of
strong earthquake motion and the generation of
Shakesmaps in near real-time.
The remainder of this paper is organised as
follows. Section 2 presents the background for this
work, describing the relevant characteristics of low-
cost accelerometers. Section 3 presents an analysis of
sensor noise based on measurements collected from
accelerometers, describing a suitable method for on-
site and while in-operation. The method is used to
determine the sensor detectability threshold related
with seismic activity. Section 4 concludes this paper.
2 BACKGROUND
In the last years, sensors and sensing network
technology evolved at a fast pace, resulting in
improved performance (resolution, sensibility and
processing capacity), operation (energy efficiency,
operation time) and connectivity (broadband
communications), at significant cost reduction. Low-
cost Micro-Electro Mechanical Systems (MEMS)
accelerometers, in particular, demonstrated the
capability to generate relevant data for seismic
analysis in dense deployment contexts (Lainé and
Mougenot, 2014).
MEMS technology has enabled the mass
production of small size accelerometers. Capacitive
accelerometers, in particular, are highly popular due
to reduced cost, their simple structure, and the ability
to integrate the sensor close to the readout electronics.
When subjected to an acceleration, the inertial mass
shifts cause a proportional change in capacitance. By
measuring the capacitance change, the acceleration
can be calculated.
In order to properly exploit its data, it is important
to take into account MEMS benefits and limitations,
(Farine et al., 2003; Evans et al., 2014; Manso et al.,
2017) including: adequate sensitivity, noise level,
and range (measured in g) to be applicable to
earthquake strong-motion acquisition (M>3),
however, limited by the high level of instrumental
self-noise especially affecting measurement of low
frequency weak-motion forces; well fit to measure
high frequency (>40Hz) ground motion since their
resonant frequency (typically above 1 kHz) is far
above the seismic band pass; measure the gravity
acceleration component thus providing a useful
reference for sensitivity calibration and tilt
measurement; have high acceleration ranges (several
g) and can sustain high acceleration (several hundred
g); complement broadband seismometers by
detecting weak high frequency signals.
There is a wide range of low-cost accelerometers
built for different purposes and exhibiting different
characteristics. Concerning seismological
applications, the following parameters should be
taken into account: Range: Specifies the minimum
and maximum acceleration values it can measure. It
is often represented relative to g (e.g., ±2g);
Resolution: Specifies both (i) the degree to which a
change can be detected and (ii) the maximum possible
value that can be measured. For example, a digital
sensor with 16-bits resolution is able to quantify
65536 possible values. If the scale is set to ±2g
(hence, a 4g range) the minimum possible change that
can be detected is about 61µg; Noise density:
Accelerometers are subject to noise produced by
electronic and mechanical sources. Since they have a
small inertial mass, noise increases at low
frequencies. The noise density is often represented in
terms of power spectral density (PSD) and is
expressed as g/√Hz. It varies with the measurement
bandwidth: when multiplied by it, the resulting value
represents the minimum acceleration values that can
be resolved; Bandwidth: Specifies the frequency
range that the sensor operates in. It is limited to the
natural resonance frequency of the mechanical
structure of the accelerometer itself, which is
typically very high (>kHz); Sample rate: Specifies
the number of measurements (samples) per second.
This paper main focus is to observe the presence
of sensor noise among several accelerometers. The
most relevant parameter is therefore “Noise density”.
Next, an analysis of sensor noise measured from
different accelerometers is provided.
On-site Sensor Noise Evaluation and Detectability in Low Cost Accelerometers
101
3 NOISE ANALYSIS OF
LOW-COST
ACCELEROMETERS
The main limiting characteristic of consumer-based
MEMS accelerometers in seismological applications
is the presence of sensor noise that is originated from
the sensor’s electrical and mechanical components.
Ultimately, the sensor noise determines the minimum
resolution of the sensor. Typically, accelerometers’
manufacturers provide in the respective datasheets an
indication of sensor noise via the parameter “power
spectral density” (PSD) that is measured in g/√Hz.
Multiplying the PSD value by the square root of the
measurement bandwidth gives the root mean square
(RMS) acceleration noise, which is the minimal
resolvable value for acceleration (NXP, 2007). It is
noted that noise increases with bandwidth.
In this chapter, an indication of sensor noise is
measured by deploying and collecting acceleration
data from several accelerometers while at rest
position. The sensor noise assessment is made by
calculating the standard deviation (eq. 1) of the signal
(calculated using a “moving window” of 100
samples), after removing the DC value. The lower the
standard deviation the lower the sensor noise.
𝜎
∑
(1)
Where: i is the sample number, x
i
is the measurement
related with sample i, µ is the mean value and N is the
sample size.
The environment where accelerometers are
installed might be affected by external factors (e.g.,
traffic or seismic activity), which can be registered by
accelerometers and should be excluded from the
sensor noise analysis. In order to exclude these
“signals” from “noise”, a threshold logic is defined
and implemented as follows:
let 𝜎𝑛 be the standard deviation related
with sample window n
let
𝜎
be the registered minimum
standard deviation for the running
period
if (
𝜎𝑛 > 𝜎
. 𝑇ℎ𝑟𝑒𝑠ℎ𝑜𝑙𝑑 ) then
is signal
else
is noise
endif
The first part of the analysis uses dedicated
accelerometers operating at different bandwidth,
while the second part compares the sensor noise in
dedicated accelerometers and consumer smartphones.
Note that this analysis assumes a “quiet”
environment, thus the presence of background
environmental noise is not taken into account.
3.1 Sensor Noise in Dedicated
Accelerometers
In this subchapter, an indication of sensor noise is
measured in two dedicated accelerometers, namely:
Analog ADXL355, a 3-axis digital sensor with
20-bit resolution, noise density (as PSD) of
25µg/√Hz. (source: https://analog.com)
Invensense MPU-6050 with 16-bit resolution,
noise density (as PSD) of 400µg/√Hz. (source:
https://www.invensense.com)
Based on the specifications, the ADXL355 sensor
noise is substantially lower (16x less) than the MPU-
6050. Moreover, sensors are setup to work at different
bandwidth in order to observe its effect in sensor
noise.
The results are presented next.
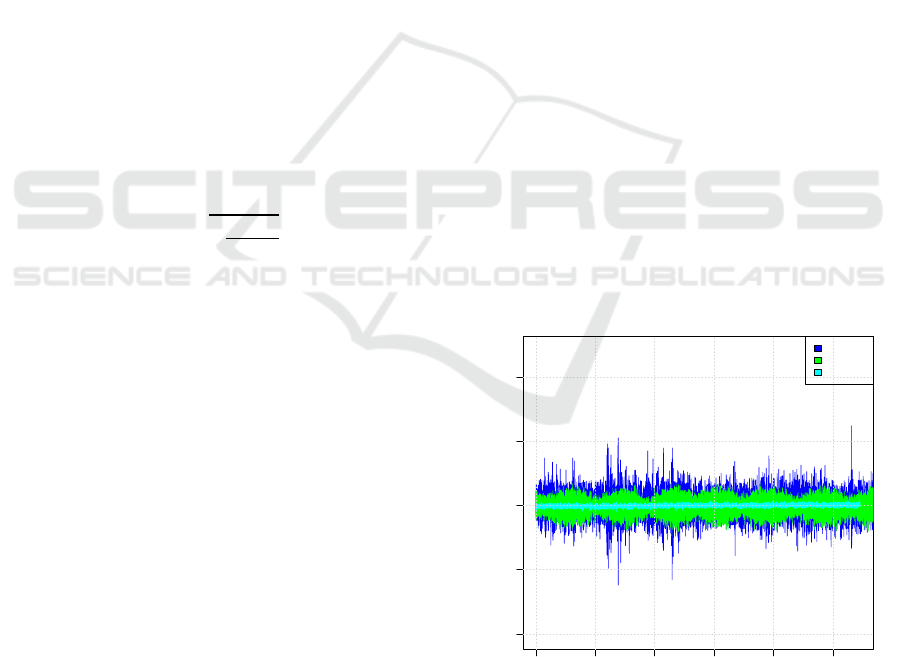
3.1.1 ADXL355 Measurements
The ADXL355 is setup to operate in three different
sampling frequencies: 15Hz, 100Hz and 1KHz. The
measured magnitude acceleration values subtracted
by the average (in g) are presented in Figure 1. As it
can be seen, the magnitude of the acceleration
increases with the sampling frequency.
Figure 1: ADXL355 Measured Acceleration Magnitude for
different sampling frequencies.
The measured standard deviation for ADXL-355 is
presented in Figure 2 and Table 1. Two types are
0 200040006000800010000
-0.004 -0.002 0.000 0.002 0.004
Sample Number
Acceleration (g)
A
ccele
r
ation magnitude (in g) with
A
DXL355 senso
r
at
r
est
f=1kHz
f=100Hz
f=15Hz
SENSORNETS 2021 - 10th International Conference on Sensor Networks
102
considered for analysis: 𝜎
that represents the
“sample window” with lowest sensor noise, and
𝜎
that provides an indication of the average
value of all included 𝜎.
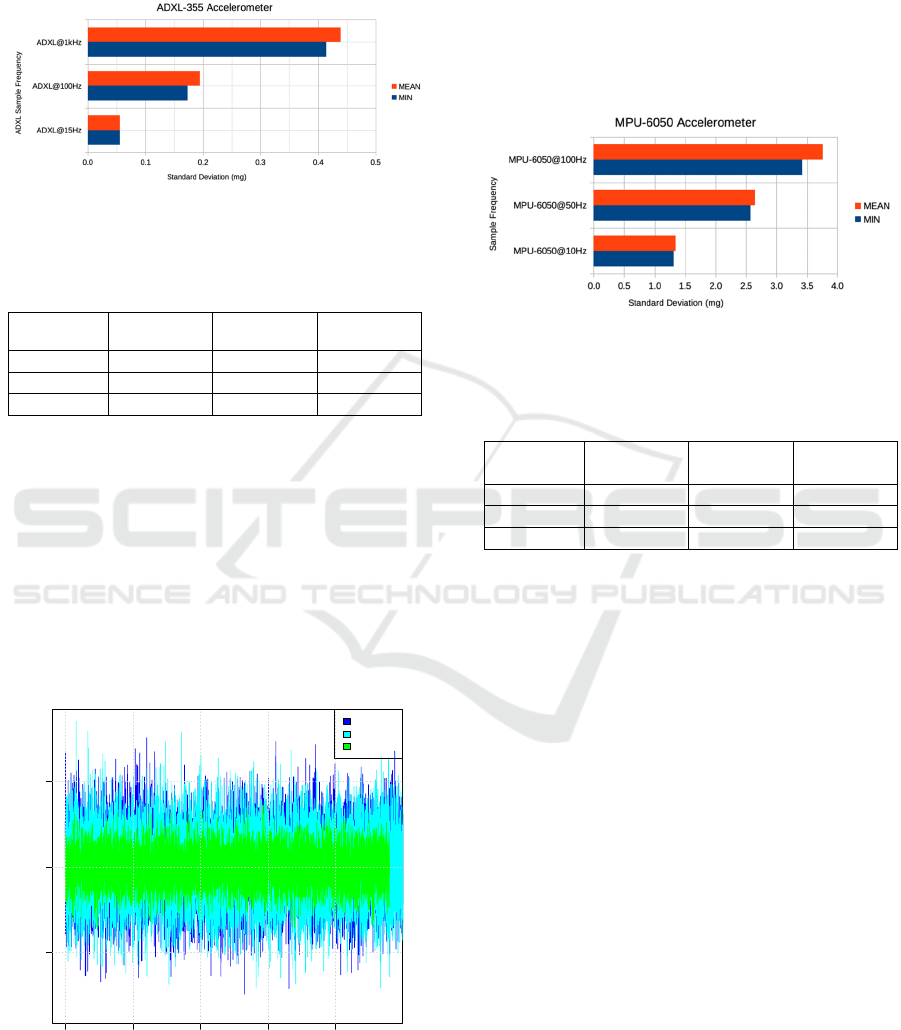
Figure 2: ADXL355 Measured Standard Deviation for
different sampling frequencies.
Table 1: ADXL355 Measured Standard Deviation:
minimum recorded value and mean value.
ADXL355
MIN
(mg)
MEAN
(mg)
∆
(mg)
1000 Hz 0.4143 0.4394 0.0252
100 Hz 0.1734 0.1950 0.0217
15 Hz 0.0555 0.0563 0.0008
As expected, increasing the sample frequency
increases sensor noise, resulting in higher dispersion in
measurements and thus in a higher standard deviation.
The lowest standard deviation value (0.0555mg) was
recorded at 15Hz (the lowest sample frequency used)
and the highest standard deviation value (0.4143 mg)
was recorded at 1KHz). This trend is also present in the
difference between 𝜎
and 𝜎
.
3.1.2 MPU-6050 Measurements
Figure 3: MPU-6050 Measured Acceleration Magnitude for
different sampling frequencies
The MPU-6050 is setup to operate in three different
sampling frequencies: 5Hz, 10Hz and 100Hz. The
measured magnitude acceleration values subtracted
by the average (in g) are presented in Figure 3. Once
again, the magnitude of the acceleration increases
with the sampling frequency.
The measured standard deviation for MPU-6050
is presented in Figure 2 and Table 1. As previously,
the analysis considers 𝜎
and 𝜎
.
Figure 4: MPU-6050 Measured Standard Deviation for
different sampling frequencies
Table 2: MPU-6050 Measured Standard Deviation:
minimum recorded value and mean value.
MPU-
6050
MIN
(mg)
MEAN
(mg)
∆
(mg)
100 Hz
3.4253 3.7606 0.3354
50 Hz
2.5713 2.6515 0.0802
10 Hz
1.3122 1.3472 0.0350
Again, sensor noise increases with the sample
frequency: the lowest standard deviation value
(1.3122 mg) was recorded at 10Hz (the lowest sample
frequency used) and the highest standard deviation
value (3.4253 mg) was recorded at 100Hz). This trend
is also present in the difference between 𝜎
and
𝜎
. Moreover, the standard deviation value can
also be used to compare sensor noise between
different accelerometers: Table 1 and Table shows
that, at a sampling frequency of 100Hz, the MPU-
6050 standard deviation value is higher (about 20x
higher) than ADXL-355, as expected from their
respective datasheets.
A comparison between different accelerometers
sensor noise is given next.
3.2 Sensor Noise in Smartphones and
Dedicated Sensors
In this subchapter, an indication of sensor noise is
measured for different accelerometers, including
those present in consumer smartphones, operating at
the same sampling frequency (100Hz) for purposes of
comparing the associated sensor noise. The following
devices were analysed:
0 2000 4000 6000 8000
-0.005 0.000 0.005
Sample Number
Acceleration (g)
A
ccele
r
ation magnitude (in g) with MPU-6050 senso
r
at
r
est
f=100Hz
f=50Hz
f=10Hz
On-site Sensor Noise Evaluation and Detectability in Low Cost Accelerometers
103
A TCL mobile phone
A Xiaomi mobile phone
A CAT mobile phone
Invensense MPU-6050 (used in 3.1.2)
ST LIS3DHH dedicated accelerometer
Analog ADXL-355 (used in 3.1.1)
The results are presented next.
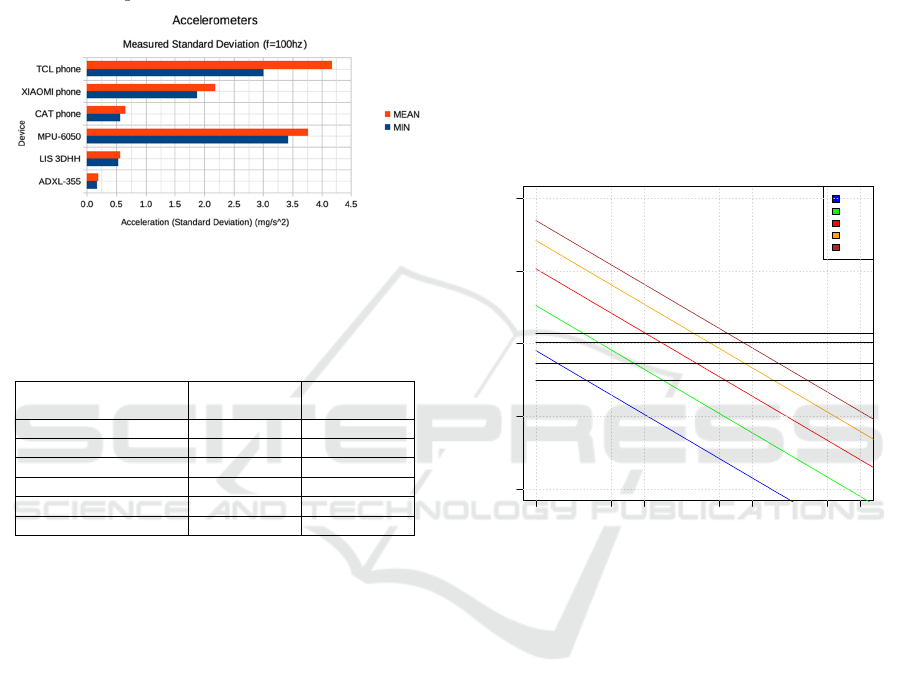
Figure 5: Measured Standard Deviation for several
accelerometers operating at a sampling frequency of
100Hz.
Table 3: Measured Standard Deviation for several devices:
minimum recorded value and mean value.
Accelerometers
MIN
(mg)
MEAN
(mg)
TCL phone 3.0115 4.1707
XIAOMI phone 1.8716 2.1893
CAT phone 0.5595 0.6563
MPU-6050 3.4253 3.7606
LIS 3DHH 0.5270 0.5634
ADXL-355 0.1734 0.1950
The developed method yields an indication of sensor
noise, which is sensor specific. As shown in Figure 5
and Table , the dedicated accelerometer ADXL-355
yields the lowest minimum standard deviation
(0.1734 mg), followed by the LIS 3DHH (0.5270
mg), the CAT phone (0.5595 mg). The TCL phone
and the MPU-6050 yield the highest values, with
3.0115 mg and 3.4253 mg respectively. It is also
pertinent to note the disparity between the mean and
the minimum value of standard deviation for the TCL
phone, indicating that the minimum value for
standard deviation alone is not sufficiently robust to
assess sensor noise in actual deployments.
3.3 Detectability Threshold Analysis
A potential application of accelerometers consists in
measuring ground motion for seismological purposes.
In this regard, accelerometers need to have the
necessary sensitivity to detect and measure seismic
events, which can have different magnitudes.
Introduced in Manso et. al (2020), herein it is
presented in equation (2) an estimation of the
detectability threshold (DetecT) of accelerometers,
considering their noise level, as measured in 3.1 and
3.2, multiplied by C, a constant that is used to increase
the assurance that measurements are above noise
level:
𝐷𝑒𝑡𝑒𝑐𝑇 𝜎
.𝐶 (2)
Considering a typical Ground Motion Prediction
Equation (GMPE) proposed by Atkinson (2015) and
resulting Peak Ground Acceleration (PGA), the
accelerometers detectability threshold, depending on
the earthquake magnitude and epicentral distance, is
presented in Figure 6.
Figure 6: Accelerometers detectability threshold for
accelerometers, depending on the earthquake magnitude
and epicentral distance.
Using C=5 in (2), in a best case scenario, the ADLX-
355 is the sensor with the lowest DetecT, being
capable to detect earthquakes with M=3 and M=5 at
a distance larger than 10 km and 100 km respectively.
Both the MPU-6050 and TCL phone exhibit similar
performance and should be able to detect earthquakes
with M=3 and M=5 at a distance of about 2 km and
20 km respectively.
The ADXL-355 accelerometer exhibited the best
performance based on the measured sensor noise,
thus further analysis is presented. ADXL-355
detectability threshold changes with the chosen
sampling frequency, as illustrated in Figure 7. For a
M=3 event, the ADXL-355 would be able to detect it
at a distance of about 30 Km if operating at a 15Hz
frequency, or about 10 Km if operating at a 1000Hz
frequency. For a M=5 event, the ADXL-355 at 15Hz
would be able to detect it at a distance of about 300
1 5 10 50 100 500 1000
1e-06 1e-04 1e-02 1e+00 1e+02
Distance (km)
PGA (g)
ADXL355
LIS3DHH | CAT phone
XIAOMI phone
MPU6050 | TCL phone
Detectability
M=2
M=3
M=4
M=5
M=6
SENSORNETS 2021 - 10th International Conference on Sensor Networks
104
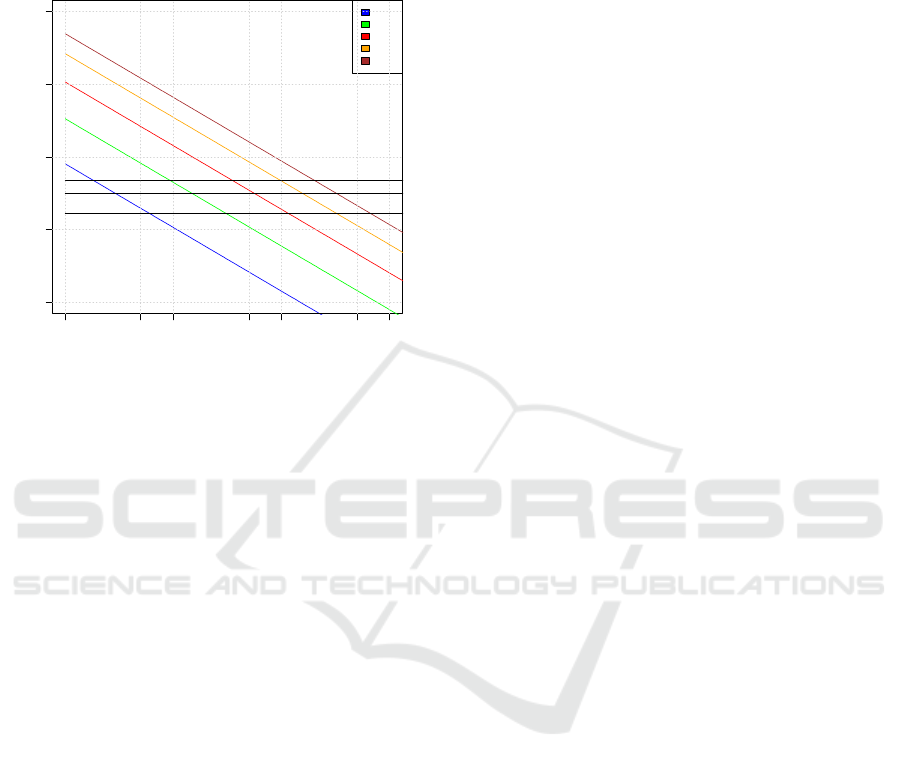
Km. Therefore, applications where the sampling
frequency can be lowered will benefit with increased
detectability.
Figure 7: ADXL-355 accelerometer detectability threshold
when using different sampling frequencies, depending on
the earthquake magnitude and epicentral distance.
Although promising, these findings are preliminary
for a more thorough analysis, considering the
frequency domain, is required in order to properly
assess the sensors detectability threshold.
4 CONCLUSION
Low-cost accelerometers have found numerous real-
world applications, including in seismology and risk
hazard assessment of buildings and human heritage.
Being low-cost, it facilitates their widespread
adoption enabling the deployment of high-density
networking providing high resolution observation
and massive amount of data that may feed intensive
processing techniques like big data and artificial
intelligence, applying machine learning techniques
and pattern matching-based processing that are much
more sensitive than the power detectors used in
current seismic systems (Addair et al., 2014), making
them especially relevant in the presence of noise and
weak signals.
This work conducted a preliminary analysis of
sensor noise observed in different types of
accelerometers, successfully developing a method to
measure noise on-site and in-operation. The method
produces an indication of sensor noise based on the
measured standard deviation. It yields results
consistent with sensors specifications (i.e., ADXL-
355, LIS 3DHH and MPU-6050) or, when not
available, with the observations. Importantly, the
method adapts to the sensor’s characteristics (e.g.,
sensor noise), allowing to identify the occurrence of
relevant events (i.e., presence of signal), without
necessarily knowing a-priori the sensor specification
(noise is calculated with the sensor in-operation). In
addition, this method also adapts to changing
circumstances, such as “noise” alterations caused by
subtle changes in sensor characteristics (resulting
from e.g., small displacements or temperature
change). When considering a high-density
deployment, logistic and maintenance aspects can
represent serious bottlenecks unless the system
supports adaptive capabilities, as those here
described.
Next steps in this work involve a thorough
analysis of the sensor noise characteristics including
the frequency domain and against a reference sensor,
thus understanding in more depth the applicability of
low-cost accelerometers in real-work applications
related with seismology, as well as their limitations.
ACKNOWLEDGEMENTS
The SSN-Alentejo project is funded by the Science
Foundation of Portugal (FCT) under grant number
ALT20-03-0145- FEDER-031260.
REFERENCES
Addair T, Dodge D, Walter W, and Ruppert S (2014)
Large-scale seismic signal analysis with Hadoop.
Computers & Geosciences 66, 145–154
Atkinson, G. (2015). Ground-Motion Prediction Equation
for Small-to-Moderate Events at Short Hypocentral
Distances, with Application to Induced-Seismicity
Hazards. Bulletin of the Seismological Society of
America. March 2015. DOI: 10.1785/0120140142
Caldeira B, Carrilho F, Miranda M, Bezzeghoud M, Alves
P, Silveira G, Villalonga F, Pena J, Matias L, Borges J,
Vales D, Corela C and Madureira G (2007) Recent
improvements in the Broadband seismic networks in
Portugal. EMSC Newsletters, special issue, 22, 18-19
Evans J, Allen R, Chung A, Cochran E, Guy R, Hellweg M,
Lawrence J (2014) Performance of Several Low-Cost
Accelerometers. Seismological Research Letters
Volume 85, Number 1 January/February 2014.
Farine M, Thorburn N, and Mougenot D (2003) General
Application of MEMS Sensors for Land Seismic
Acquisition – Is it Time? Accessible at:
http://cseg.ca/assets/files/resources/abstracts/2003/218
S0130.pdf
1 5 10 50 100 500 1000
1e-06 1e-04 1e-02 1e+00 1e+02
Distance (km)
PGA (g)
ADXL355@1000Hz
ADXL355@100Hz
ADXL355@15Hz
Detectability
M=2
M=3
M=4
M=5
M=6
On-site Sensor Noise Evaluation and Detectability in Low Cost Accelerometers
105

Lainé J. and Mougenot D. (2014) A high-sensitivity MEMS-
based accelerometer. The Leading Edge. November
2014. Special Section: Sensor technology and
nanotechnology.
http://dx.doi.org/10.1190/tle33111234
Manso M., Bezzeghoud M., Caldeira B. (2017) Design and
Evaluation of a High Throughput Seismic Sensor
Network. Tools for Planning, Deployment and
Assessment. 6th International Conference on Sensor
Networks SENSORNETS, Porto, Portugal, 19 to 21
February.
Manso, M., Bezzeghoud, M., Borges, J., Caldeira, B.,
Abdelhakim A. High-density seismic network for
monitoring Alentejo region (Portugal) and Mitidja
basin region (Algeria). Arab J Geosci 13, 976 (2020).
https://doi.org/10.1007/s12517-020-05972-w
(Published: 17 September 2020).
NXP (2007) Accelerometer Terminology Guide - Quick
Reference Guide. Freescale Semiconductor. Rev 0,
05/2007.
SENSORNETS 2021 - 10th International Conference on Sensor Networks
106
