
Symbolic Translation of Time Series
using Piecewise N-gram Similarity Voting
Siegfried Delannoy
1,2
,
´
Emilie Poisson Caillault
2 a
, Andr
´
e Bigand
2 b
and Kevin Rousseeuw
1
1
ORIENTOI DEV, 165 Av. de Bretagne, 59000 Lille, France
2
LISIC, ULCO, EA 4491, Calais, France
Keywords:
Similarity Measure, N-gram, Temporal Extractions, Web-Application, User Profiles, Weighted Vote
Classification.
Abstract:
This paper studies a way to discriminate user behaviour from their viewed pages in a web-application. This
technique is on similarity measure selection and time sequence splitting techniques. Using temporal splitting
techniques, the proposed similarity measures greatly improve the result accuracy. We applied these ones on
several datasets from the well known UCR Archive and our research is focused on a private dataset (ORI-
ENTOI) and a public one called UCR-CBF. Some of the proposed temporal tricks appear to make similarity
measures efficient with noises. They make them possible to deal with repeating terms, which is a drawback
for most of the similarity measures. Thus the similarity measures are shown to reach the state of the art on
UCR datasets. We also evaluated the proposed technique on our private (ORIENTOI) dataset with success.
We finally discuss about the weakness of our method and the ways to improve it.
1 INTRODUCTION
Knowledge discovery from users’Webpage naviga-
tion is an old concern, but still open and active (Sha-
habi et al., 1997; Nowak et al., 2018). Internet
access became really common, thus many compa-
nies have an interest in web user’s profiling to adapt
their financial or communication strategies, such as e-
commerce, media services, bank or social network. In
the last decade, serious games are used both to iden-
tify and to understand user behaviour in a medical or
educational way (Wattanasoontorn et al., 2013; Bi-
enkowski et al., 2014). One user can be characterized
by a sequence of game-play actions. Game excite-
ment, tiredness, stress, personality, but also device,
environment or knowledge may influence on action
responses. All these factors should be identified and
taken into account in the interpretation.
Our work focuses on the way to improve a web
application dedicated to the orientation and discov-
ery of jobs from serious games. Based on the anal-
ysis of game actions and user behaviour, it is possi-
ble to establish relationships between users and busi-
ness cards. Profile analysis is a key-point. This pa-
a
https://orcid.org/0000-0001-6564-8762
b
https://orcid.org/0000-0002-3165-5363
per therefore aims to classify users according to their
navigation behaviour in this serious-game-based web
application.
The paper is inspired by the Loh et al.’s work (Loh
et al., 2016), which presents a similar context: classi-
fying users in a serious game using a virtual maze.
In (Loh et al., 2016) they used several Similarity
Measures (SMs) to discriminate profiles from Game-
play Action-Decision (GAD): Explorer, Fulfiller, and
Leaver. Player actions are saved as a sequence of trav-
elled cases in the maze, identified by a letter. This
sequence will be compared with reference sequences
defined by an expert to assign its profile. They studied
5 SMs comparing the player sequences and the refer-
ence sequences: Dice, Jaccard, Overlap, Cosine and
Longest Common Substring (LCS). And they used N-
gram preprocessing to deal with the importance of
temporality order in the sequences. These similar-
ity measures can be used in a wide range of fields:
Dice and Jaccard for document clustering (Afzali and
Kumar, 2018), fraud detection, Jaccard for fingerprint
similarity (Bajusz et al., 2015), LCS for DNA analy-
sis. Phan et al. (Phan et al., 2017) proposed to use
SMs for biological time series imputation. (Bajusz
et al., 2015) concluded that a similarity measure can
be poor in a study field, but strong in another. Even
if we also have a maze in our web application (ORI-
Delannoy, S., Caillault, É., Bigand, A. and Rousseeuw, K.
Symbolic Translation of Time Series using Piecewise N-gram Similarity Voting.
DOI: 10.5220/0010317603270333
In Proceedings of the 10th International Conference on Pattern Recognition Applications and Methods (ICPRAM 2021), pages 327-333
ISBN: 978-989-758-486-2
Copyright
c
2021 by SCITEPRESS – Science and Technology Publications, Lda. All rights reserved
327

ENTOI), this new application is really different: our
maze have near-random generation. This fact makes
over 1.8e+28 possibilities of maze, making impossi-
ble for us to use this method on this part of our ap-
plication. So, rather than using this approach to the
game part of our data, we used this on the viewed
pages in the application. Viewed pages are converted
into characters to use SMs.
The context of our work is different from the
Loh’s context, since we are not using gameplay se-
quences but navigation sequences. This particular
context implies more complexity to deal with, espe-
cially the high redundancy corresponding to the core
loop of our application. Moreover, the similarity mea-
sure proposed by Loh does not deal without splitting
in some situations on the second used dataset (CBF).
So, this paper extends Loh et al.’s approach to classify
users from their navigation page-key information and
proposes a new weighted similarity voting classifier.
We also used some temporal extractions, such as n-
gram to keep the information relative to the sequence
order and then to add a sequence splitting technique to
decrease noise interference and strengthen SM about
redundancy.
Section 2 details this new approach. Results on
collected navigation path data (ORIENTOI) and sev-
eral public data from UCR archive are discussed be-
fore concluding with other applications.
2 PROPOSED METHOD
This part describes the proposed approach to clas-
sify a sequence from a train database and argues the
choice made.
2.1 General Outline
User actions are described by a character sequence
x of length denoted |x|. x
j
= {x
ji
} is the sequence
of the player j, ordered by i time-index from 1 to
|x
j
|. |x| could vary, so their similarities from a train-
ing database are used to assign a behaviour label. We
denote x
t
the t
th
sequence of a training dataset with T
profiles.
So to classify a sequence x
j
of a player j from T
train profiles, we adopted this general scheme:
1. Symbolic Preprocessing: replace x
t
and x
j
by
their character sequences if not already done.
2. S-split of x
t
(sequence from T ) and x
j
sequences.
S-split means that a sequence x is cut into S seg-
ments of length L except for the last segment. The
s
th
j
segment is defined as:
x
js
=
x
ji
⊆ x
j
, s ∈ [1 : S]
L =
|x|
S
i ∈ [1 + (s − 1) × L : min (s × L, |x|)]
(1)
Thus, for a value S close to |x|, x could not be
exactly cut in S segments. S = 1 corresponds to
the full sequence, i.e. without any segmentation.
3. Computing N-gram on each segment of x
j
and x
t
with n ∈ {1 : N}. Each resulted N-gram is noted
x
0
.
4. Similarity Measures: computing vectors w
j
of
length |T | containing the similarities sim of x
j
with all training sequences of T , as follows:
sim(x
j
,x
t
) =
1
S
×
S
∑
s=1
sim(x
0
js
,x
0
ts
) (2)
Similarity ranges from 0 (dissimilar) to 1 (sim-
ilar), but sim(A, A) isn’t necessarily equal to 1
(Like Dice and Overlap).
5. Vectors Manipulation or Voting Techniques to
obtain a unique vector w
j
from one or several W
j
.
6. Classifying, by assigning to the user j the dom-
inant class of the k-nearest neighbors from the T
train profiles.
In the following, metrics will be named as follow
N-SM/S, where N is the value N of N-gram, SM
the similarity measure, and S the number of splits.
2 − Dice/3 means that the original sequence is cut
in 3 subsequences, transformed with contiguous se-
quence of 2-letter items and Dice measure are used
for comparison.
2.2 Voting Scheme
There are 2 main ways to use a voting scheme (Phan
et al., 2018), the hard voting, and the weighted vot-
ing. In the hard case, all votes are the same in terms
of importance, but in the weighted case, each vote
can have a different importance into the final result.
The weighted case can be useful if we want to make
some model more important than other. In our case,
we tried several approaches, and a weighted voting
scheme based on the accuracy of metrics (founded
from the training set) and occurrence of SM gave us
better results (see section 4.5).
2.3 Pros and Cons
N-gram Size. Dice, Jaccard and Overlap similarities
are based on counts from intersection of items in
ICPRAM 2021 - 10th International Conference on Pattern Recognition Applications and Methods
328
2 sequences. Thus, an item from the start of a
sequence A can be related to an item at the end of
sequence B. It could be partially revised by using
a high n-value. But high n-value are not robust to
noise. Let see an example with Jaccard scores be-
tween 2 sequences ”123456789” and ”12X456X89”.
They decrease according to n-value: 1-Jaccard =
0.7, 2-Jaccard = 0.33, 3-Jaccard = 0.07, 4-Jaccard = 0.
Similarity Measures. Some SMs used by (Loh
et al., 2016) do not take into account frequency. 3 of
the 5 SM (Dice, Jaccard and Overlap) use intersect
of the characters of the 2 sequences to calculate
similarity. Such approach makes them sensitive to
noise and redundancy. LCS is also highly sensitive
to noise, for the reason that a mutation in the middle
of a common substring, can greatly decrease the sim-
ilarity calculated. In order to override this issue, we
implement 2 other metrics based on item frequency
: Bag-of-words (BoW) and Term Frequency-Inverse
Document Frequency (TF-IDF) well known in text
similarity. BoW is the Euclidean distance between
term occurrence vectors in x
j
and x
t
, TF-IDF between
their term occurrences weighted by their document
frequency. Thus the previous distances d are trans-
formed to obtain similarity value sim called sBoW
and sTF-IDF defined by sim = 1 − d/rowmax(d).
S-split. Previous metrics could be not relevant due
to possible matching between the beginning of x
j
and
the end of x
t
. Our split technique ensures boundary
and monotony conditions.
3 PROPOSED FRAMEWORK
AND DATASET
Several datasets (data) are used to validate our ap-
proach: an extraction from ORIENTOI database and
some data from the UCR archive (Dau et al., 2018)
with a focus on the artificial CBF dataset. CBF was
chosen because of its citation and its similarity with
the ORIENTOI’s dataset: same sequence beginnings,
some level and shape differences in the rest of the se-
quences, and to ensure replicability. More informa-
tion is available in the table 1.
Table 1: Dataset Information: sequence length, total num-
ber of train and test profiles, distribution of test samples per
class (C1, C2, C3).
Data length train test C1 C2 C3
CBF 128 30 900 300 298 302
ORIENTOI 1-919 30 3,887 356 212 3,319
The 27 other UCR datasets are not detailed here,
they come from various types: Image outline, sensor
readings, motion capture, spectrographs, electric de-
vices, ECG and simulated. They are selected for a
comparison with the accuracy results done in (Bag-
nall et al., 2017).
1-NN (one nearest-neighbor) classifier is used to
assign the profile of a sequence from the train se-
quences.
All UCR data are composed of one training set
and one testing set. So the train part is used both for
labelling of the test part and for validation (using a
leave-one-out cross-validation). Thus, the parameters
(N,S and SM) and the process to find the best combi-
nation of similarities with their weightings are com-
pletely and independently computed apart of the test
set. N-gram values are set from 1 to 5 as well as the
splitting values (S ∈ 1 : 5).
For ORIENTOI’s dataset, 10 elements per class
are chosen randomly to compose the train set. So clas-
sifiers are trained on these 30 elements like CBF and
their capacity of generalization are computed from the
rest: 3,887 sequences.
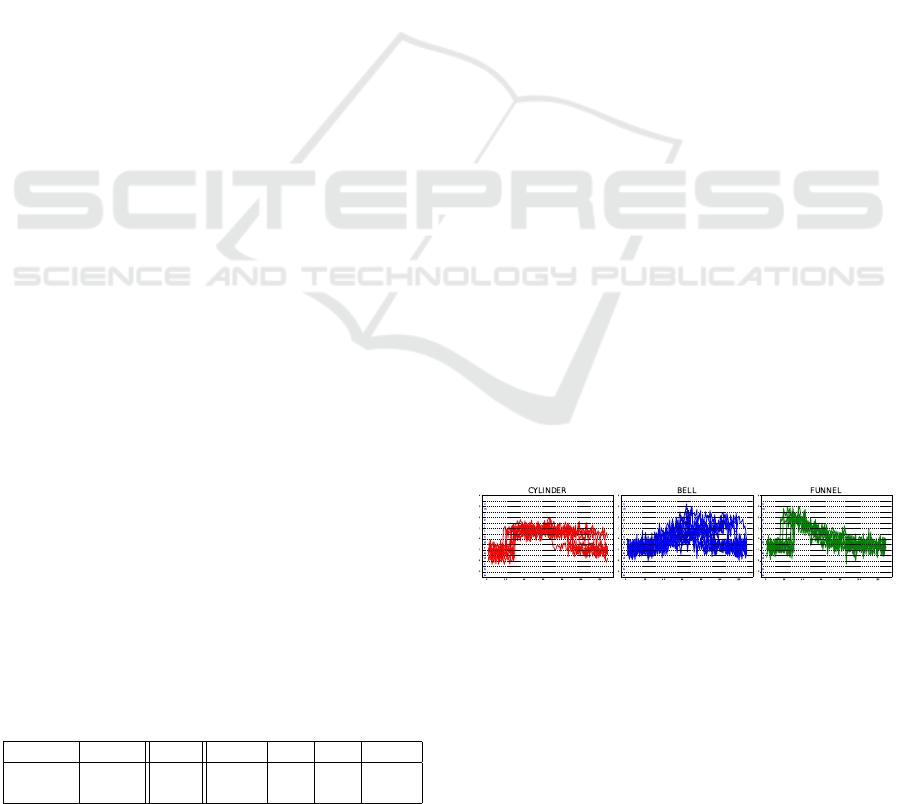
3.1 The CBF Dataset
The CBF dataset from the UCR Archive (Dau et al.,
2018), is a simulated data set defined by N. Saiko in
his thesis ”Local Feature Extraction and Its Applica-
tions Using a Library of Bases ”. Data from each
class is starndard normal noise plus an offset term
which differs for each class. CBF is composed of 930
numeric time series with equal length and 3 classes
(C1=Cylinder, C2=Bell and C3=Funnel) to identify,
with 30 train data for 900 test data. We use the CBF
train and test sets. Each time series is transformed
by symbolic quantization with a 0.5 step in the signal
range [-3.5;3.8], illustrated in Fig 1. This 0.5 step is
firstly chosen arbitrary and then adapted in 4.8.
Figure 1: Symbolic quantization per class on CBF train
dataset.
3.2 ORIENTOI’s Dataset (This Dataset
Is Private and Will Is Not Explained
Here)
In the ORIENTOI’s application, one user has to play
a required number of games before reaching the se-
rious part with job orientation. Detecting and under-
Symbolic Translation of Time Series using Piecewise N-gram Similarity Voting
329

standing player is an important part to generate some
personality elements and to adapt the part of job pro-
posal. The intended purpose here is to classify the
players into 3 classes, quite similar to Loh et al.’s pro-
files, defined by:
• C1 - Early Quitters. Players that did not reach a
required number of games, to obtain some gener-
ated personality elements ;
• C2 - Quitters. Players that reached the personal-
ity part, but stopped before the serious part, and
so, never answered about job preference (the final
step) ;
• C3 - Fulfillers. Players that reached the end of
the full process at least once.
Thus the ORIENTOI’ dataset is composed of page-
key sequences ordered by their time-stamp for each
player. A character is assigned to each page. The
length of player navigation varies from 1 to 919 time-
stamps, with a large majority of Fulfillers.
4 RESULTS
This section presents accuracy results obtained on
UCR and ORIENTOI datasets, with a deepening on
CBF to show some weakness and strength of the pro-
posed technique.
Similarity Measure (SM) name in the following
tables will be shortened as follow: Di. (Dice), Jac.
(Jaccard), Ovl. (Overlap), Cos. (Cosine), LCS
(Longest common substring), BoW (Normalized bag
of word) and IDF (Normalized text frequency-inverse
document frequency).
4.1 CBF: Without N-gram and S-split
On CBF, using only SM leads to poor results shown
in the table 2. The best accuracy (AC) is obtained
with frequency-based SMs: Cosine, BoW and IDF. It
is explained by the fact that 88.5% of the occurrences
are done by 6 different letters and that 3 Letters from
test set never appear in the train set, and 4 appear in
only 2.8% of the sequences. So, SM using intersect
like Dice, Jaccard and Overlap produce poor result.
Table 2: Accuracy percentage (AC) per similarity (SM)
without N-gram and S-split in the UCR-CBF test dataset.
SM Di. Jac. Ovl. Cos. LCS BoW IDF
AC 37.1 56.7 37.1 66.4 40.0 65.5 67.4
4.2 CBF: With N-gram
By adding N-gram and whatever the method (except
LCS), more uniform results (> 60%) are obtained,
presented in table 3. Dice and Overlap SMs are sig-
nificantly improved using n-gram. They have same
accuracy due the equal length of all sequences. But
these result remain low, because of noise that gener-
ates mutating characters and non-discriminative char-
acter (that situation at least appears once in most se-
quences).
Table 3: Best accuracy percentage per SM for N-gram value
for the UCR-CBF test dataset.
SM Di. Jac. Ovl. Cos. LCS BoW IDF
N 4 2 4 2 3 3 1
AC 64.1 69.8 64.1 67.0 41.4 67.8 67.4
4.3 CBF: With S-split
Then, by simply adding s-split, we present in table 4
the significant improvement of accuracy results. Fun-
nel and Bell have a highly similar term frequency after
quantization (for these 2 classes, only 6 letters have
mean different frequency, with less than 0.3% of dif-
ference) and that implies confusion between these 2
classes, see an accuracy close to 2/3 in table 3. S-
split is a main step that allows a more than 20% gain.
Once again, frequency-based SM performs particu-
larly well on CBF (> 99% of good classification).
Table 4: Best accuracy percentage (AC) per similarity (SM)
and the associated S-split value for the UCR-CBF test
dataset.
SM Di. Jac. Ovl. Cos. LCS BoW IDF
S 4 4 4 3-5 5 3-5 3
AC 89.2 96.5 89.2 99.5 77.1 99.6 99.1
4.4 CBF: With N-gram and S-split
Both N-gram and S-split preprocessing lead to better
results for Dice, Jaccard and Overlap SMs, as shown
in the table 5. At this stage, the highest result is 99.6%
with the BoW using 3-split or 5-split. Since using
high N-gram is sensitive to noise, most of best scores
correspond to unigram and bigram.
Table 5: Best accuracy percentage per SM with the as-
sociated S-split and N-gram values for the UCR-CBF test
dataset.
SM Di. Jac. Ovl. Cos. LCS BoW IDF
S 5 3 5 3-5 5 3-5 3
N 2 2 2 1 1 1 1
AC 96.7 98.7 96.7 99.5 77.1 99.6 99.1
ICPRAM 2021 - 10th International Conference on Pattern Recognition Applications and Methods
330

4.5 CBF: Similarity Measure
Aggregation
Some SMs are reliable to predict class, depending on
the selected n-gram and s-split. 175 metrics N-SM/S
are computed according to the possible combinations
(SM,N,S). The proposed voting scheme aims to catch
the strength and the complementarity of each SM and
to propose a nice combination. This can be done ei-
ther by vectors manipulating (means or product) or
voting scheme.
A step-forward process on the training set leads
to a single measure, 2-Jaccard/3, with an accuracy of
100% on the training set, but 98.7% (F1-measure =
0.987) on the testing set.
To enforce complementarity, we decided to keep
all the metrics with an accuracy in the train part that
have less than 10% of relative difference with the best
one, and using them in a weighted voting scheme, de-
fined as follow: Accuracy(m)
2
/
p
Occurence(m).
Accuracy(m): is the accuracy of the metric m on
the training set (validation step). This allows us to
increase the gap between high and poor metrics.
Occurence(m): this is the occurrence of the SM in
the kept metrics from the training set. Thus, it lowers
the influence of too frequent SMs and allows more
complementarity: each SM brings a different kind of
information.
An hard vote obtained from the 175 metrics
(weigths=1) permits 93.3% of good recognition on
the testing set based on the training profiles. With this
weighted vote combining the 175 metrics, test accu-
racy increases up to 98.8%. With the selected metrics
based on the 10%-relative difference,99.5% of test ac-
curacy is reached (F1-measure = 0.995), close to the
state-of-art result: 99.8% (Bagnall et al., 2017). Also,
weighted similarity vote we proposed obtains better
accuracy than the 7 of 9 algorithms cited in (Bagnall
et al., 2017).
As said previously, n-gram are highly sensitive to
noise, by dismissing n-gram from this voting scheme,
the prediction reaches 99.8% of accuracy and a F1-
measure of 99.8%, as well as Bag of SFA Symbols or
COTE for CBF in (Bagnall et al., 2017).
4.6 ORIENTOI’s Results
For the ORIENTOI’s dataset (ORIENTOI in the se-
quel), and only using the best metric (1-Jaccard/1),
an accuracy of 85.3% (F1-measure = 0.844) is ob-
tained and once again, the ”step forward” stops into
the first step. Our vote method allows to reach an ac-
curacy of 97.2% (F1-measure = 0.971). N-gram pro-
cess seems to be useful to classify for this dataset:
only 95.9% accuracy without n-gram (F1-measure =
0.961). This could be explained by the fact that in
an application, multiple choices exists and the n-gram
help the method to take into consideration the impor-
tance of transition between pages. The s-split is less
important in ORIENTOI. Due to the high redundancy
of the core loop (cycle of main interest actions), the
s-split is less effective.
4.7 UCR Results
In (Bagnall et al., 2017), 9 algorithms are tested on
85 UCR datasets. We used the same benchmark to
validate our approach on 28 of them.
Table 6 details accuracy results for the 6 types of
data in UCR and recall the state-of-art best scores (p0
from Table 6). The relevance of the N-gram process
(p1, p1a) depends on the used dataset. Mean accuracy
with the previous SM vote protocol is 66.3% with-
out n-gram and s-split process. Adding n-gram up-
grades this accuracy to 70.9%, and using just s-split
upgrade it to 78.1% (p2, p2a). Both processes give a
close score: 78.2%. This shows the importance of s-
split, but does not mean that metrics with n-gram isn’t
reliable. Furthermore, metrics without n-gram reach
state-of-art for 3 of the 28 used datasets.
Our weighted vote scheme has better results than
an hard vote scheme (mean accucary of 60.8%) on
these 28 datasets without n-gram and s-split. And
for full metrics (N-SM/S), weighted vote scheme was
78.2%, and 77.7% for the hard vote scheme, pointing
the usefulness of lowering too redundant SM on kept
metrics.
Our method seems to be efficient in some kind of
data, such as motion capture, ECG or simulated and
less in others, such as spectrographs, as you can see
in the table 6.
4.8 UCR Results: Adapted
Quantization Step
A fixed quantization (0.5-step) could not be relevant
for each dataset. So adapted step was explored for
each dataset of UCR among these values: 5, 10, 15,
20 and 30 (p1a, p2a). Results with this adapted quan-
tization are noted p1a and p2a in table 6. Few datasets
have lower result with adapted step, and some dataset
have notable better results, such as SonyAIBORobot-
Surface1, Wine, BirdChicken and SyntheticControl.
Note that we only test 5 adapted steps in this case,
and an optimal quantization could be learnt from the
training set. Symbolic Aggregate approximation on
CBF has also been compared without better success,
but could be investigated for the other datasets.
Symbolic Translation of Time Series using Piecewise N-gram Similarity Voting
331

Table 6: Accuracy percentage for some UCR Test datasets:
p0 ((Bagnall et al., 2017)) is the best cited result ; then the
proposed approach (p): p1 = vote with both n-gram and s-
split; p2 = vote without n-gram; p1a = p1 and p2a = p2 with
adapted step (5, 10, 15, 20, 30). The 2 Last rows correspond
to mean and standard deviation accuracy on all datasets and
* the occurence number of best results between p1 and p2
or p1a and p2a.
Dataset p0 p1 p2 p1a p2a
Coffee 100.0 96.4 96.4 92.8 96.4
Wine 92.6 46.2 50 70.3 59.2
Beef 76.4 40.0 46.6 55.3 50.0
Plane 100 99 100 100 100
Trace 100 94 95 99 99
ItalyPowerDemand 97.0 91.5 91.7 90.3 90.7
MoteStrain 91.7 87.6 87.3 86.8 88.6
Lightning7 79.9 69.8 57.5 65.7 69.8
SonyAIBORobotS.2 96.0 81.2 80.5 84.1 78.6
OliveOil 90.1 73.3 66.6 83.3 73.3
SonyAIBORobotS.1 89.9 59.7 59.0 78.2 73.3
BeetleFly 94.8 85.0 95.0 85 95
DiatomSizeReduction 94.6 92.1 91.5 93.4 95
ProximalPhalanxTW 81.5 77.5 77.0 76.0 76.0
MiddlePhalanxTW 58.7 53.2 53.8 56.4 57.7
FaceFour 99.6 80.6 84.0 87.5 78.4
Fish 97.4 75.4 76.0 72.5 73.1
BirdChicken 94.6 70.0 70.0 90.0 75.0
ArrowHead 87.7 62.2 68.5 74.8 74.8
Adiac 81 51.6 51.6 58.5 58.0
WordSynonyms 77.8 62.0 57.5 60.3 57.3
CBF 99.8 99.5 99.8 99.7 99.8
SyntheticControl 99.9 92.6 87.3 97.3 87.6
ECGFiveDays 98.6 79.3 76.5 82.2 80.1
TwoLeadECG 98.5 80.7 90.7 87.5 84.2
ECG200 89.0 88.0 85.0 86.0 87.0
GunPoint 99.9 94.6 91.3 96.6 94.0
ToeSegmentation1 95.4 82.4 75.0 84.0 78.9
Occ. best* - 13 12 14 10
MEAN 91,5 77,3 77,1 81,9 79,6
STD 9,7 16,5 16,5 13,4 14,3
5 CONCLUSION
The Loh et al.’s work is revisited and extended to
focus on the way to classify user profiles from their
viewed pages in a web-application. A piecewise n-
gram similarity voting is proposed and validated for
the investigated dataset and also on several datasets
with different contexts.
Without the proposed splitting techniques, results
obtained on some data are relatively good, but the
generalization on other data is less convincing. The
splitting techniques allow us to constrained match-
ing between sequences with boundary and monotonic
conditions, and greatly improves the results on UCR
datasets. Due to noise and to the nature of the cho-
sen similarity measures, not- splitting sequences give
poor results for CBF. Splitting really provides an im-
portant gain for these applications. With an arbitrary
step of quantization, the simple fact of using splitting
increases the result on 21 of 28 of UCR datasets with
absolute gain up to 54.1% and mean gain of 11.7%.
As for the gain on our dataset (ORIENTOI), the
redundancy of actions in our data reduces the interest
of the subdivision and has to be highlighted. This sub-
division has the advantage of constraining the com-
parison space, so that a character at the beginning of
a sequence is not compared to a character at the end
of another sequence. An overly redundant cycle will
still appear in all the divisions and will minimize or
even cancel the interest of the sub-division method.
The proposed weighted voter reaches better re-
sults than a simple step forward. And our general
method allows us to reach the state-of-the-art score
on 3 of the datasets and to have less than 6% of dif-
ference to accuracy for 8 other ones.
The proposed average Piecewise N-Gram similar-
ity (and combination of them) give promising results
to classify user profiles by their navigation path in an
in-situ serious game web application.
This method can also be extended and enhanced for
time series (see section 5). The efficiency of similarity
measures depends on the dataset and the way to com-
pare sequences. The proposed piecewise comparison
of 2 sequences (s-split) is elementary and may benefit
to similarity measures but should be adapted for cycle
within the sequence.
Perspectives.
The proposed method can deal with time series with
close state-of-the art accuracy but some improve-
ments are required to enhance these results:
• Better Adapting the Step of the Symbolic Pre-
processing: the value range varies with the con-
sidered datasets and could be wide. The range
is from 3.38 to 19.19 according to the chosen
dataset. With a 0.5 quantization level,the last one
have 39 symbols whereas the first one have only 7.
However, the 5 fixed step values are not necessary
optimal and should be further investigated.
• More S-split or Fluctuating S-split: the length
of the used time series are also wide, from 24 to
570. Sub-sequencing a time series of 570 points
into 5 splits may be not enough. Also, the equal
splitting length and/or weight is perhaps not the
most suitable solution for some datasets.
• Finding When to Use N-gram: as showed in this
paper, some time series got better results without
n-gram. It could be interesting to find out when to
use (or not) a n-gram technique.
ICPRAM 2021 - 10th International Conference on Pattern Recognition Applications and Methods
332

• The KNN: we only used the 1-NN because it
seems to be a relatively good choice, but it’s per-
haps not the case for all datasets. And an other
method is possibly more suitable.
• Better Detecting the Best Couples of Metrics
to Use: the method we propose to detect cou-
ple of metrics to be used together is not optimal
and it’s certainly the most important way to im-
prove all the results. In fact, some of possible met-
ric combinations are able to reach 100% accuracy
on CBF, even without weighted vote scheme, and
with less metrics used.
ACKNOWLEDGEMENTS
This research was supported/partially supported by
ORIENTOI DEV that provided the ORIENTOI
dataset and the ”Association Nationale Recherche
Technologie”.
REFERENCES
Afzali, M. and Kumar, S. (2018). An extensive study of sim-
ilarity and dissimilarity measures used for text doc-
ument clustering using k-means algorithm. Interna-
tional Journal of Information Technology and Com-
puter Science, 10:64–73.
Bagnall, A., Lines, J., Bostrom, A., Large, J., and Keogh,
E. (2017). The great time series classification bake
off: a review and experimental evaluation of recent
algorithmic advances. Data Mining and Knowledge
Discovery, 31(3):606–660.
Bajusz, D., R
´
acz, A., and H
´
eberger, K. (2015). Why is
tanimoto index an appropriate choice for fingerprint-
based similarity calculations? Journal of Cheminfor-
matics, 7(1):20.
Bienkowski, M., Feng, M., and Means, B. (2014).
Enhancing teaching and learning through educa-
tional data mining and learning analytics: An is-
sue brief. Report number: https://tech.ed.gov/files/
2015/04/Developer-Toolkit.pdf, Affiliation: US De-
partment of Education.
Dau, H. A., Keogh, E., Kamgar, K., Yeh, C.-C. M.,
Zhu, Y., Gharghabi, S., Ratanamahatana, C. A., Yan-
ping, Hu, B., Begum, N., Bagnall, A., Mueen, A.,
Batista, G., and Hexagon-ML (2018). The ucr time
series classification archive. https://www.cs.ucr.edu/
∼eamonn/time
series data 2018/.
Loh, C. S., Li, I.-H., and Sheng, Y. (2016). Comparison
of similarity measures to differentiate players’ actions
and decision-making profiles in serious games analyt-
ics. Computers in Human Behavior, 64:562 – 574.
Nowak, J., Korytkowski, M., Nowicki, R., Scherer, R., and
Siwocha, A. (2018). Random forests for profiling
computer network users. In Rutkowski, L., Scherer,
R., Korytkowski, M., Pedrycz, W., Tadeusiewicz, R.,
and Zurada, J. M., editors, Artificial Intelligence and
Soft Computing, pages 734–739, Cham. Springer In-
ternational Publishing.
Phan, T., Poisson-Caillault, E., Lefebvre, A., and Bigand,
A. (2017). Dynamic time warping-based imputation
for univariate time series data. Pattern Recognition
Letters.
Phan, T.-T.-H., Bigand, A., and Caillault,
´
E. P. (2018).
A new fuzzy logic-based similarity measure applied
to large gap imputation for uncorrelated multivariate
time series. Applied Computational Intelligence and
Soft Computing, 2018:1–15.
Shahabi, C., Zarkesh, A. M., Adibi, J., and Shah, V. (1997).
Knowledge discovery from users web-page naviga-
tion. In Proceedings Seventh International Workshop
on Research Issues in Data Engineering. High Perfor-
mance Database Management for Large-Scale Appli-
cations, pages 20–29.
Wattanasoontorn, V., Boada, I., Garc
´
ıa Hernandez, R., and
Sbert, M. (2013). Serious games for health. Enter-
tainment Computing, 4:231–247.
Symbolic Translation of Time Series using Piecewise N-gram Similarity Voting
333
