
Machine Learning Algorithms for Predicting Chronic Obstructive
Pulmonary Disease from Gene Expression Data with Class Imbalance
Kunti Robiatul Mahmudah
1
, Bedy Purnama
1,2
, Fatma Indriani
1,3
and Kenji Satou
4
1
Graduate School of Natural Science and Technology, Kanazawa University, Kanazawa, Japan
2
Telkom School of Computing, TELKOM University, Bandung, Indonesia
3
Department of Computer Science, Universitas Lambung Mangkurat, Banjarbaru, Indonesia
4
Institute of Science and Engineering, Kanazawa University, Kanazawa, Japan
Keywords: Microarray Data, Gene Expression, COPD, Machine Learning, Class Imbalance.
Abstract: Chronic obstructive pulmonary disease (COPD) is a progressive inflammatory lung disease that causes
breathlessness and leads to serious illness including lung cancer. It is estimated that COPD caused 5% of all
deaths globally in 2015, putting COPD as the three leading causes of death worldwide. This study proposes
methods that utilize gene expression data from microarrays to predict the presence or absence of COPD.
The proposed method assists in determining better treatments to lower the fatality rates. In this study,
microarray data of the small airway epithelium cells obtained from 135 samples of 23 smokers with COPD
(9 GOLD stage I, 12 GOLD stage II, and 2 GOLD stage III), 59 healthy smokers, and 53 healthy non-
smokers were selected from GEO dataset. Machine learning and regression algorithms performed in this
study included Random Forest, Support Vector Machine, Naïve Bayes, Gradient Boosting Machines, Elastic
Net Regression, and Multiclass Logistic Regression. After diminishing imbalance data effect using SMOTE,
classification algorithms were performed using 825 of the selected features. High AUC score was achieved
by elastic net regression and multiclass logistic regression with AUC of 89% and 90%, respectively. In the
metrics including accuracy, specificity, and sensitivity, both classifiers also outperformed the others.
1 INTRODUCTION
Chronic obstructive pulmonary disease (COPD) is a
progressive inflammatory lung disease that restricts
airflow from the lung and imposes a significant
burden on daily patient’s lives. COPD becomes one
of the significant risk factors for developing lung
cancer (Sekine et al., 2012). According to WHO,
COPD caused 5% of all deaths globally in 2015 and
in 2020, it is estimated that 4.7 million out of 68
million deaths worldwide will be caused by COPD
(Lopez-Campos et al., 2016). COPD is often noticed
when the condition has caused major lung damage.
It is difficult to detect COPD in the early stage
because the symptoms only appear after significant
lung damage has occurred. With current
computational technologies, developing machine
learning algorithms, and better access to health and
disease-related data, opportunities for detecting
COPD in the early stage will be improved. Anakal,
S. & Sandhya, P. (2017) highlighted the need of
employing machine learning algorithm in designing
Clinical Decision Support Systems to classify the
different stages of COPD in patients. By employing
machine learning algorithms, Yao, Yangwei, et al
(2019) identified 38 genes which associated with the
pathogenesis of COPD and ILD (interstitial lung
disease). The identified genes can be used to assist
in determining better treatments for COPD and ILD.
Studies of diseases are commonly conducted by
using gene expression data which can reveal
components of the genome that are significantly
changed to help us understand which biological
processes are affected (e.g., Qian et al., 2014).
However, gene expression data analysis and
handling are complex and difficult tasks since the
number of experiments is less than the number of
genes or probes which usually used as features.
Furthermore, platform differences resulting in batch
effects, different experimental conditions, and the
lack of uniformity in experimental annotation
become the major challenge.
What makes this challenge even more difficult is
that the presence of class imbalance, i.e., the number
148
Mahmudah, K., Purnama, B., Indriani, F. and Satou, K.
Machine Learning Algor ithms for Predicting Chronic Obstructive Pulmonary Disease from Gene Expression Data with Class Imbalance.
DOI: 10.5220/0010316501480153
In Proceedings of the 14th International Joint Conference on Biomedical Engineering Systems and Technologies (BIOSTEC 2021) - Volume 3: BIOINFORMATICS, pages 148-153
ISBN: 978-989-758-490-9
Copyright
c
2021 by SCITEPRESS – Science and Technology Publications, Lda. All rights reserved
of data represented in one class is smaller than other
classes. The minority class is usually the main
interest since classifiers will degrade their
performance on this class while biased towards the
majority class. Class imbalance problem has become
an important issue in the field of machine learning
and remains as one of the major difficulties in
intelligent computer systems. Researchers in this
field have developed techniques to solve this
problem. One of the methods to deal with class
imbalance is by resampling the original dataset
either by oversampling or undersampling (Chawla et
al., 2002).
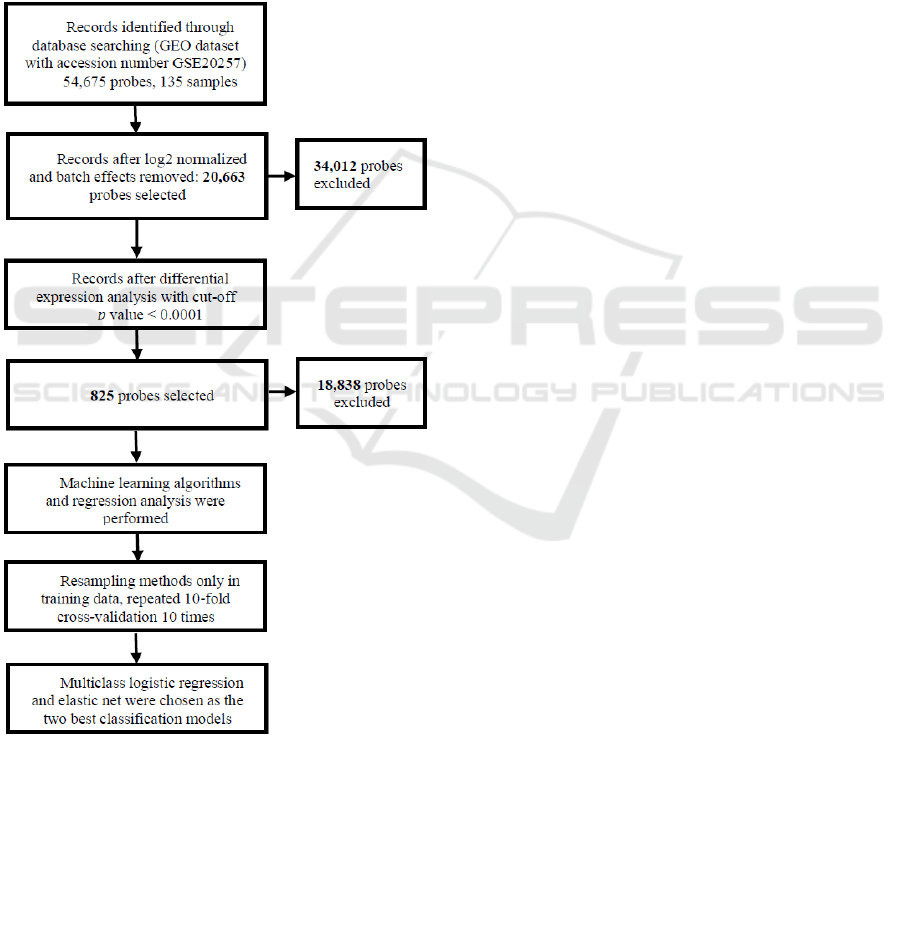
Figure 1: Flowchart of this study plan.
This study was designed to solve the problem
using some machine learning algorithms by dealing
with class imbalance using synthetic minority
oversampling technique (SMOTE). For comparison,
we also performed other different resampling
methods of the “caret” package. The flowchart of
this study is shown in Figure 1.
The rest of this document describes our methods
in detail. In section 2, we describe the material and
methods used for this study. It briefly discusses data
selection methods to increase model performance.
We briefly describe machine learning and regression
algorithms suitable for this analysis and the
evaluation metrics used for assessing the
performance of our proposed method. Section 3
discusses the experiment and result. Finally, section
4 concludes this paper.
2 MATERIAL AND METHODS
2.1 Dataset
We used microarray dataset of the small airway
epithelium (SAE) provided by the Gene Expression
Omnibus (GEO) database,
https://www.ncbi.nlm.nih.gov/geo/, with accession
number GSE20257. It is a series of GPL570
platform which described as Smoking-induced
Disarray of the Apical Junctional Complex Gene
Expression Architecture in the Human Airway
Epithelium. The airway epithelial cells were
obtained by bronchoscopy and brushing which were
done by Crystal Laboratory of Department of
Genetic and Medicine, Weill Cornell Medical
College. The data were originally collected on June
27, 2011 and were updated recently on March 25,
2019. The gene expressions are arranged in
GeneChip HG-U133 Plus2.0 arrays, a single array
representing around 14,500 well-characterized
human genes that can be used to explore human
biology and disease processes (ThermoFisher,
2001).
The dataset contains gene expression data of 135
human subjects with the total number of 54,675
probes. Out of 135 subjects, 23 subjects are smokers
with COPD (9 GOLD stage I, 12 GOLD stage II,
and 2 GOLD stage III), 59 subjects are healthy
smokers, and 53 subjects are healthy nonsmokers.
The data were log2 normalized, removing batch
effects using “affy” and “biobased” R packages
provided by Bioconductor. Differential expression
analysis was then performed using “Limma”
package to select probes that were significantly
changed in healthy non-smokers compared to COPD
patients. These selected probes were then used in the
machine learning algorithms. The probe selection is
aimed at reducing the dimension of the dataset,
which is essential to reduce the computational cost
Machine Learning Algorithms for Predicting Chronic Obstructive Pulmonary Disease from Gene Expression Data with Class Imbalance
149

of modelling. Furthermore, removing unneeded,
irrelevant, and redundant attributes that statistically
do not contribute to the accuracy and other
evaluation metrics of a predictive model can
improve the model’s performances.
2.2 Machine Learning (ML)
We employed various machine learning models
including support vector machine (SVM), naïve
bayes, random forest, gradient boosting machine
(GBM), and regression models included elastic net
regression and multiclass logistic regression (LR)
for the classification task. All ML and regression
methods were applied using “caret”, “e1017”,
“nnet”, and “naivebayes” R packages.
Elastic net is one of regularized regression
models which use a linear combination penalty of L
1
and L
2
. It combines the strength of the other two
regularized regression models, ridge and lasso
regression. Parameter α in elastic net regression has
a value between 0 and 1. The aim of the elastic net
regression model was to minimize the loss function.
Multiclass LR is an extension of binary logistic
regression. This model allows us to predict
categorical response variable which has more than
two outcomes. This model aims at capturing the
linear relationship between the response variables
and the independent variables.
2.3 Synthetic Minority Over-sampling
Technique (SMOTE)
A dataset is called imbalanced if the classes are not
approximately equally distributed. Imbalance is a
challenging problem for classification algorithms
because the classifier’s decision is biased toward the
majority class. Dominating effects of the majority
class exert severe impact on the value and meaning
of most of the evaluation metrics (Luque et.al.
2019).
One of the prominent methods to solve class
imbalance is to resample the original dataset either
by oversampling the minority class and/or
undersampling the majority class (Chawla et al.,
2002). SMOTE utilizes a k-nearest
neighbor algorithm to create synthetic samples based
on the existing minority samples.
2.4 Evaluation Metrics of Predictive
Models
To evaluate the performance of the proposed
classification models, the mean accuracy, AUC,
sensitivity, and specificity were calculated for each
model. Sensitivity and specificity are important
evaluation metrics for evaluating a model’s ability to
recognize positive and negative outcomes of a
disease-related dataset. (Trtica-Majnaric et al.,
2010).
Various evaluation metrics such as accuracy,
sensitivity, and precision are derived from confusion
matrix. Table.1 shows the possible nine outputs of
classification models for three classes 1,2, and 3. It
represents the elements of a 3×3 confusion matrix as
described in Tharwat A. (2018).
In Table 1, the columns represent the predicted
classes, and the rows represent the actual classes.
We then have the numbers of nine cases where TP
1
is the case for which the classifier predicted as class-
1 and the sample were actually class-1, and E
12
is a
sample from class-1 that misclassified as class-2.
Thus, the false negative in the class-1 (FN
1
) is the
sum of E
12
and E
13
𝐹𝑁
=𝐸
+𝐸
which
indicates the sum of all samples that were actually
class-1 but were misclassified as class-2 or class-3.
Whereas the false positive in the class-1 (FP
1
) is the
sum of E
21
and E
31
𝐹𝑃
=𝐸
+𝐸
which
indicates the sum of all sample that actually were not
class-1 but were misclassified as class-1.
Table 1: An illustrative example of the confusion matrix
for a 3-class classification test.
Predicted
Class
True Class
12 3
1 TP
1
E
21
E
31
2 E
12
TP
2
E
32
3 E
13
E
23
TP
3
In the “caret” packages, the accuracy is defined
as the overall accuracy using the predicted classes,
while sensitivity and specificity are defined as the
averages of the “one versus all” statistics. As
described in Ballabio et al., (2018), the overall
accuracy is computed as follows:
𝐴𝑐𝑐 =
∑
𝑇𝑃
𝑛
(1)
where 𝑇𝑃
is the number of true positive samples in
class-i, and 𝑛 is the total number of samples.
Accuracy shows how accurate our classification
model is able to predict the class labels given in the
BIOINFORMATICS 2021 - 12th International Conference on Bioinformatics Models, Methods and Algorithms
150

problem statement. In other word, the best selected
model has the highest accuracy.
Sensitivity for multiclass classification is
computed as follows:
𝑆𝑛 =
∑
𝑆𝑛
𝑔
(2)
where 𝑆𝑛
is sensitivity for class-i and g is the total
number of classes. 𝑆𝑛
can be calculated as follows:
𝑆𝑛
=
𝑇𝑃
𝑇𝑃
+𝐹𝑁
(3)
On the other hand, specificity for multiclass
classification is computed as follows:
𝑆𝑝 =
∑
𝑆𝑝
𝑔
(4)
where 𝑆𝑝
is specificity for class-i. 𝑆𝑝
can be
calculated as follows:
𝑆𝑝
=
∑
𝑛𝑛
(5)
Sensitivity shows the ability of a model in
correctly identifying positive data out of all actual
positives data. In contrast, specificity shows the
ability of a model in correctly identifying negative
data out of all actual negative data. The higher the
sensitivity and specificity, the better the model in
correctly identifying data that belong to a certain
class as well as a data that do not belong to the class.
To calculate AUC score, we used
multiclass.roc
function from pROC packages
which computed multiclass AUC as an average
AUC defined by Hand and Till (2001). For multiple
classes labelled as 0,1,2,…,
𝑐1
with 𝑐2, the
separability between class i and j or auc is defined as
follows:
𝑎𝑢𝑐 =
𝐴
𝑖|
𝑗
+𝐴
𝑗
|𝑖
2
(6)
where 𝐴
𝑖|𝑗
is the probability shows that if we
draw a member of class j randomly, the estimated
probability of j belongs to class i will be lower than
if if we randomly draw a member of class i instead.
This also applies to the reverse case. For multiclass
case 𝐴
𝑖|𝑗
𝐴
𝑗|𝑖
.
𝐴𝑈𝐶 =
2
𝑐
𝑐1
𝑎𝑢𝑐𝑠
(7)
with aucs all the pairwise roc curves.
The best model is selected based on the highest
value of the four evaluation metrics. The higher the
AUC, the better the model in distinguishing a
positive example from a negative one.
2.5 Evaluation of Resampling Methods
In the experiment, we performed SMOTE algorithm
using two different CRAN packages “DMwR” and
“smotefamily”. We also performed down-sampling
and up-sampling for comparison. Up-sampling
works by randomly sampling a dataset so that all
classes have the same number of samples as
majority class. On the contrary, down-sampling will
randomly sample a data set so that all classes have
the same number of samples as the minority class.
To evaluate the performance of all the classifiers,
we performed repeated k-fold cross-validations as it
is a very common technique used for this purpose.
This evaluation technique improves the performance
of machine learning algorithms and regression by
repeating the k-fold cross-validation procedure n
times and reporting the mean result of all folds from
all runs. Filzmoser (2009) shows that repeated cross
validation is a good strategy for optimizing the
complexity of regression models as well as machine
learning models.
3 EXPERIMENTS AND RESULT
The gene expression data usually contain unneeded,
irrelevant, and redundant attributes during the
collection process of the data. In the first step before
performing classification model, we removed
unneeded attributes so that our proposed
classification method will be more accurate. In this
data pre-processing, the raw data downloaded from
GOE dataset were log2 normalized using “biobased”
R package, removed batch effects and unwanted
variation using “affy” package, and compared
statistically or analysed for differential expression
using “Limma” package.
After removing batch effects in the data pre-
processing, 20,663 probes were selected out of
54,675 probes. We then identified 825 probes which
were significantly changed with p value < 0.0001 in
COPD subjects compared to healthy non-smoker
subjects as shown in Figure 2.
The dataset was splitted into training and test set
with percentage of 80% and 20% respectively. We
then applied SMOTE only in the training data to
resample the data. The oversampled data were
included in machine learning and regression
modelling approaches with repeated 10-fold cross-
validations 10 times.
Machine Learning Algorithms for Predicting Chronic Obstructive Pulmonary Disease from Gene Expression Data with Class Imbalance
151
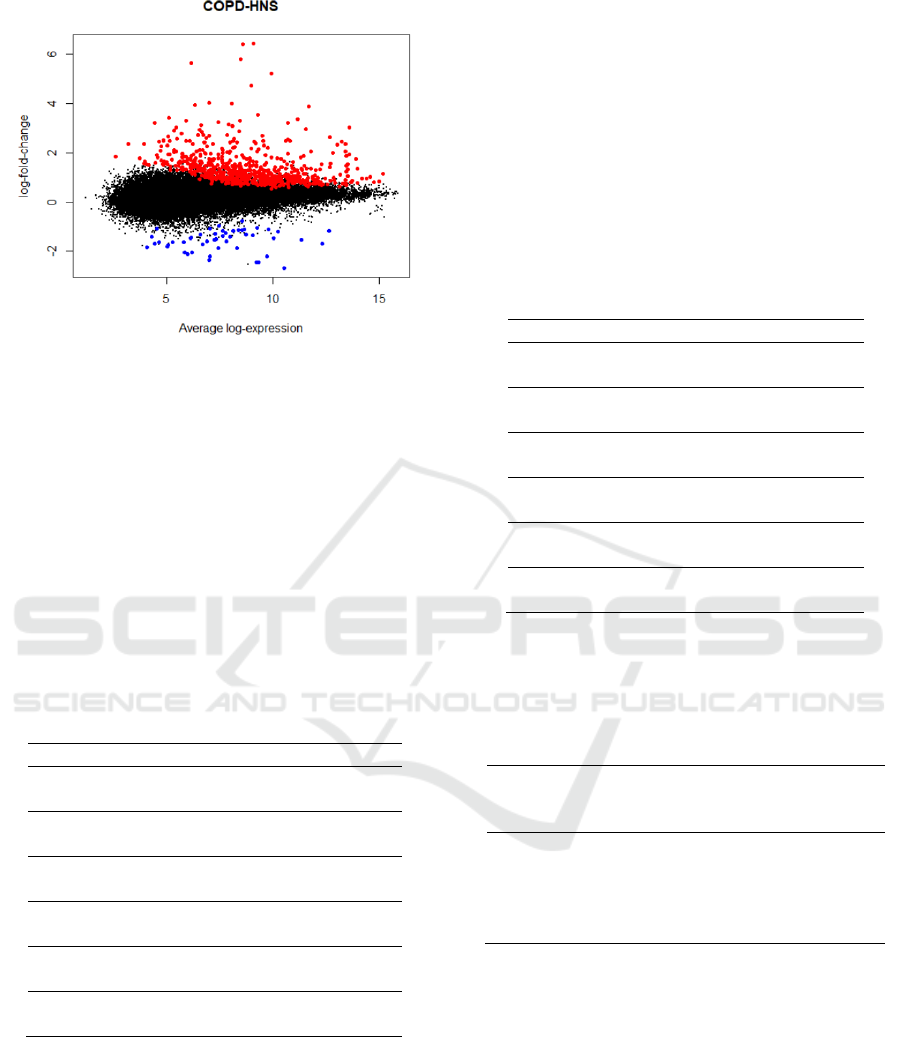
Figure 2: Mean difference (MD) plot displays log2 fold
change versus average log2 expression values for all the
54,675 probes. Highlighted genes are significantly
differentially expressed in COPD compared to healthy
non-smoker (red = upregulated, blue = downregulated).
3.1 Comparison of Machine Learning
Algorithm and Regression Analysis
Table 2 shows the accuracy and AUC score of the
machine learning models of SVM, naïve bayes,
random forest, GBM, and regression model of
elastic net regression and multiclass LR with and
without applying SMOTE to deal with class
imbalance.
Table 2: Accuracy and AUC for different models.
Classifier Accuracy (%) AUC (%)
SVM 68 73
+SMOTE 68 85
Naïve Bayes 48 70
+SMOTE 64 76
Random Forest 48 60
+SMOTE 64 81
GBM 64 81
+SMOTE 56 70
Elastic Net 64 71
+SMOTE 76 89
Multiclass LR 72 82
+SMOTE 80 90
Based on repeated 10-fold cross-validations 10
times, all the performance increased in the models
with SMOTE compared to those without SMOTE
except for GBM. This indicated that SMOTE is
effective when dealing with class imbalance.
The best performance is obtained by multiclass
LR with SMOTE with the highest overall accuracy
score and AUC of 80% and 90%, respectively. This
model also has the highest sensitivity and specificity
value of 0.80 and 0.89, respectively, as shown in
Table 3. This high sensitivity and specificity in the
model indicate that the model can be used to
correctly classify subjects that belong to a certain
class as well as a subject that did not belong to the
class.
The second-best model based on the evaluation
metrics is elastic net regression which obtained a
slightly different of accuracy and AUC score from
that of multiclass LR with 76% and 89%,
respectively.
Table 3: Average sensitivity and specificity for different
models.
Classifier Sensitivity Specificity
SVM 0.53 0.81
+SMOTE 0.70 0.82
Naïve Bayes 0.44 0.71
+SMOTE 0.67 0.80
Random Forest 0.37 0.69
+SMOTE 0.61 0.81
GBM 0.57 0.80
+SMOTE 0.50 0.76
Elastic Net 0.56 0.80
+SMOTE 0.76 0.87
Multiclass LR 0.67 0.84
+SMOTE 0.80 0.89
3.2 Comparison of Resampling
Methods
Table 4: AUC for multiclass LR with different resampling
methods.
Resampling methods
AUC of
Multiclass LR
(%)
Without resamplin
g
82.4
SMOTE from “DMwR” 90.1
SMOTE from “smotefamil
y
” 89.3
upSample 87.4
downSample 78.1
We performed different resampling methods in
multiclass LR to see the effect of those on the model
performances. We employed two SMOTE functions
from two different packages. The difference between
SMOTE of “DMwR” and “smotefamily” packages
is that SMOTE in “DMwR” uses a combination of
SMOTE and under-sampling of the majority class
while in “smotefamily” do not. So that, in “DMwR”
we need to tune the two parameters
perc_over and
perc_under in the smote function until we get an
acceptable sample size. In this function, we set
perc_over to 200 and perc_under to 300. For
BIOINFORMATICS 2021 - 12th International Conference on Bioinformatics Models, Methods and Algorithms
152

comparison, we also performed up-sampling and
down-sampling.
By dividing 80% of the dataset as training data
and 20% as validation data, 110 out of 135 data
samples were used as training data which consist of
43 samples of healthy non-smokers, 48 samples of
healthy smokers, and 19 samples of COPD.
upSample function of “caret” package randomly
samples the dataset so that all classes have 48
samples, while
downSample randomly samples the
dataset so that all classes have 19 samples.
Table 4 shows the AUC values for multiclass LR
of different resampling methods. The AUCs of
SMOTE from both “DMwR” and “smotefamily” are
quite similar with the difference of only 0.8%.
Considering that both packages give insignificantly
different outcomes, we can randomly choose to use
one of the SMOTE functions from both packages.
As comparison, resampling the dataset using
upSample function increased the AUC performance
by 5% while
downSample decreased the
performance by 4.3%. However, the AUC
performance of upSample function is still lower than
that of SMOTE either using “DMwR” or
“smotefamily”. The models trained with SMOTE
outperformed the models without SMOTE in the
four evaluation metrics.
4 CONCLUSION
In this study, we used microarray dataset to predict
the presence of COPD by dealing with the class
imbalance at first. Prior study on this dataset have
tried to predict the presence of COPD regardless of
the existence of class imbalance.
The model we proposed can predict the presence
of COPD with an overall accuracy and AUC score
of 80% and 90% respectively, based on repeated 10-
fold cv 10-times. The outcomes indicate that by
dealing with class imbalance before performing
machine learning algorithms and regression analysis
can be used to predict the presence of COPD more
accurately. Our proposed methods also have higher
sensitivity and specificity values than that without
dealing with class imbalance. It shows that the
selected model can be used to correctly classify
subjects that belong to a certain class as well as a
subject that did not belong to the class. The
proposed method in this study can be used to assist
in determining better treatments to lower the fatality
rates caused by COPD.
In the future study, we are considering to employ
more recent and advanced resampling methods to
achieve a better performance.
REFERENCES
Anakal, S. and Sandhya, P, (2017). Clinical Decision
Support System for Chronic Obstructive Pulmonary
Disease using Machine Learning Techniques, 2017.
International Conference on Electrical, Electronics,
Communication, Computer and Optimization
Techniques (ICEECCOT).
Ballabio, D., Grisoni, F., and Todeschini, R., 2018.
Multivariate comparison of classification performance
measures. Chemometrics and Intelligent Laboratory
Systems, Vol 174:33-44.
Chawla, N.V., Bowyer, K.W., Hall, L.O., Kegelmeyer,
W.P., 2002. SMOTE: Synthetic Minority Over-
sampling Technique. Journal of Artificial Intelligence
Research 16: 321-357.
GOLD, 2017. Global strategy for the diagnosis,
management, and prevention of copd.
Hand, D.J., Till, R.J., 2001. A simple Generalisation of the
Area Under the ROC Curve for Multiple Class
Classification problems. Machine Learning 45: 171-
186.
Filzmoser, P., Liebmann, B., and Varmuza, K., 2009.
Repeated double cross validation. Journal of
Chemometrics 23:160-171.
Lopez-Campos, J.L.,Tan, W., and Soriano, J.B., 2016.
Global burden of COPD. Respirology, 21: 14-23.
Luque, A., et al., 2019. The impact of class imbalance on
classification performance metrics based on the binary
confusion matrix. Pattern Recognition Vol.91: 216-
231.
Qian, X., Ba, Y., Zhuang, Q., and Zhong, G., 2014. RNS-
Seq Technology and Its Application in Fish
Transcriptomics. OMICS 18(2): 98-110.
Sekine, Y., Katsura, H., Koh, E., Hiroshima, K., Fujisawa,
T., 2012. Early detection of COPD is important for
lung cancer surveillance. European Respiratory
Journal 39:1230-1240.
Tharwat, A., 2018. Classification Assessment Methods.
Applied Computing and Informatics.
ThermoFisher, 2001. GenechipTM human genome U133
plus 2.0 array.
https://www.thermofisher.com/order/catalog/product/9
00468
Trtica-Majnaric, L., Zekic-Susac, M., Sarlija, N., and
Vitale, B., 2010. Prediction of influenza vaccination
outcome by neural networks and logistic regression.
Journal of Biomedical Informatics, 43(5): 774-781.
Yao, Y., Gu, Y., Yang, M., Cao, D., Wu, F, 2019. The
Gene Expression Biomarkers for Chronic Obstructive
Pulmonary Disease and Interstitial Lung Disease.
Frontiers in Genetics 10: 1154.
Machine Learning Algorithms for Predicting Chronic Obstructive Pulmonary Disease from Gene Expression Data with Class Imbalance
153
