
Object Detection and Text Recognition in Large-scale Technical
Drawings
Trang M. Nguyen
1,2
, Long Van Pham
1
, Chien Chu Nguyen
1
and Vinh Van Nguyen
1,2
1
University of Engineering and Technology, VNUH, Vietnam
2
QAI, FPT Software, Hanoi, Vietnam
Keywords:
Digital Transformation, Object Detection, Optical Character Recognition.
Abstract:
In this digital transformation era, the demand for automatic pattern extraction from printed materials has never
been higher, making it one of the most eminent problems nowadays. In this paper, we propose a new method
for pattern recognition in highly complex technical drawings. Our method is a pipeline system that includes
two phases: (1) detecting the objects that contain the patterns of interest with improvements to processing
large-scale image, and (2) performing character recognition on the objects if they are text patterns with im-
provements to post-processing task. Our experiments on nearly five thousand real technical drawings show
promising results and the capability to reduce manual labeling effort to a great extent.
1 INTRODUCTION
With the development of information technology and
the popularity of computers, more and more docu-
ments are created and stored on information systems.
However, many documents still exist in the form of
paper documents and they have not been fully digi-
tized. Texts or any meaningful objects in these forms
are often handled manually by humans, either to pro-
cess the information they contain or to re-create them
in electronic format in computer systems. As the
number of paper documents increases, manually con-
verting them into digital forms is becoming a huge
problem since it requires countless effort and time.
Therefore, automatic pattern extraction from scanned
paper documents is most desirable nowadays. Doc-
uments after being saved to computers can easily be
searched and edited. Moreover, it can be stored for a
longer period with a significantly larger volume, sav-
ing more resources and space than paper documents.
For the many benefits of digitized information,
several companies are investing in the digital trans-
formation of their existing paper documents. This is
both an opportunity and a challenge for the providers
of such digital transformation services. Most of the
problems concerning the process of text document
conversion can be thought of as an optical character
recognition (OCR) problem, which is a sub-field of
computer vision. OCR research concerns two types
of data: images and text. In particular, the input data
are images and the outputs are machine-encoded text.
OCR has a long history of development and there
are many solutions for it. However, these solutions
mostly deal with traditional OCR problems where the
inputs are typically well-structured and high quality
scanned text documents. On the other hand, text ex-
traction from large-scale images of complex docu-
ments is still far from being resolved while the de-
mand for it is rising evermore. These documents have
small text elements scattered throughout and their
layouts are not well-defined. These so-called non-
traditional OCR problems pose unique challenges, in-
cluding background/object separation, multiple scales
of object detection, coloration, text orientation, text
size diversity, font diversity, distraction objects, and
occlusions (Ye and Doermann, 2014).
In this paper, we propose a new method that can
detect and recognize selected visual objects as well as
text patterns in large-scale technical drawings. Our
contribution is:
• Solution for processing large-scale images for ob-
ject detection.
• Post-processing solution for recognizing text pat-
terns.
It is worth noting that the inputs to the system
are scanned images with complex details and a wide
range of elements at different scales. Our models are
tailored to detect specific objects of requirement, not
to digitize all available objects in the provided draw-
612
Nguyen, T., Van Pham, L., Nguyen, C. and Van Nguyen, V.
Object Detection and Text Recognition in Large-scale Technical Drawings.
DOI: 10.5220/0010314406120619
In Proceedings of the 10th International Conference on Pattern Recognition Applications and Methods (ICPRAM 2021), pages 612-619
ISBN: 978-989-758-486-2
Copyright
c
2021 by SCITEPRESS – Science and Technology Publications, Lda. All rights reserved
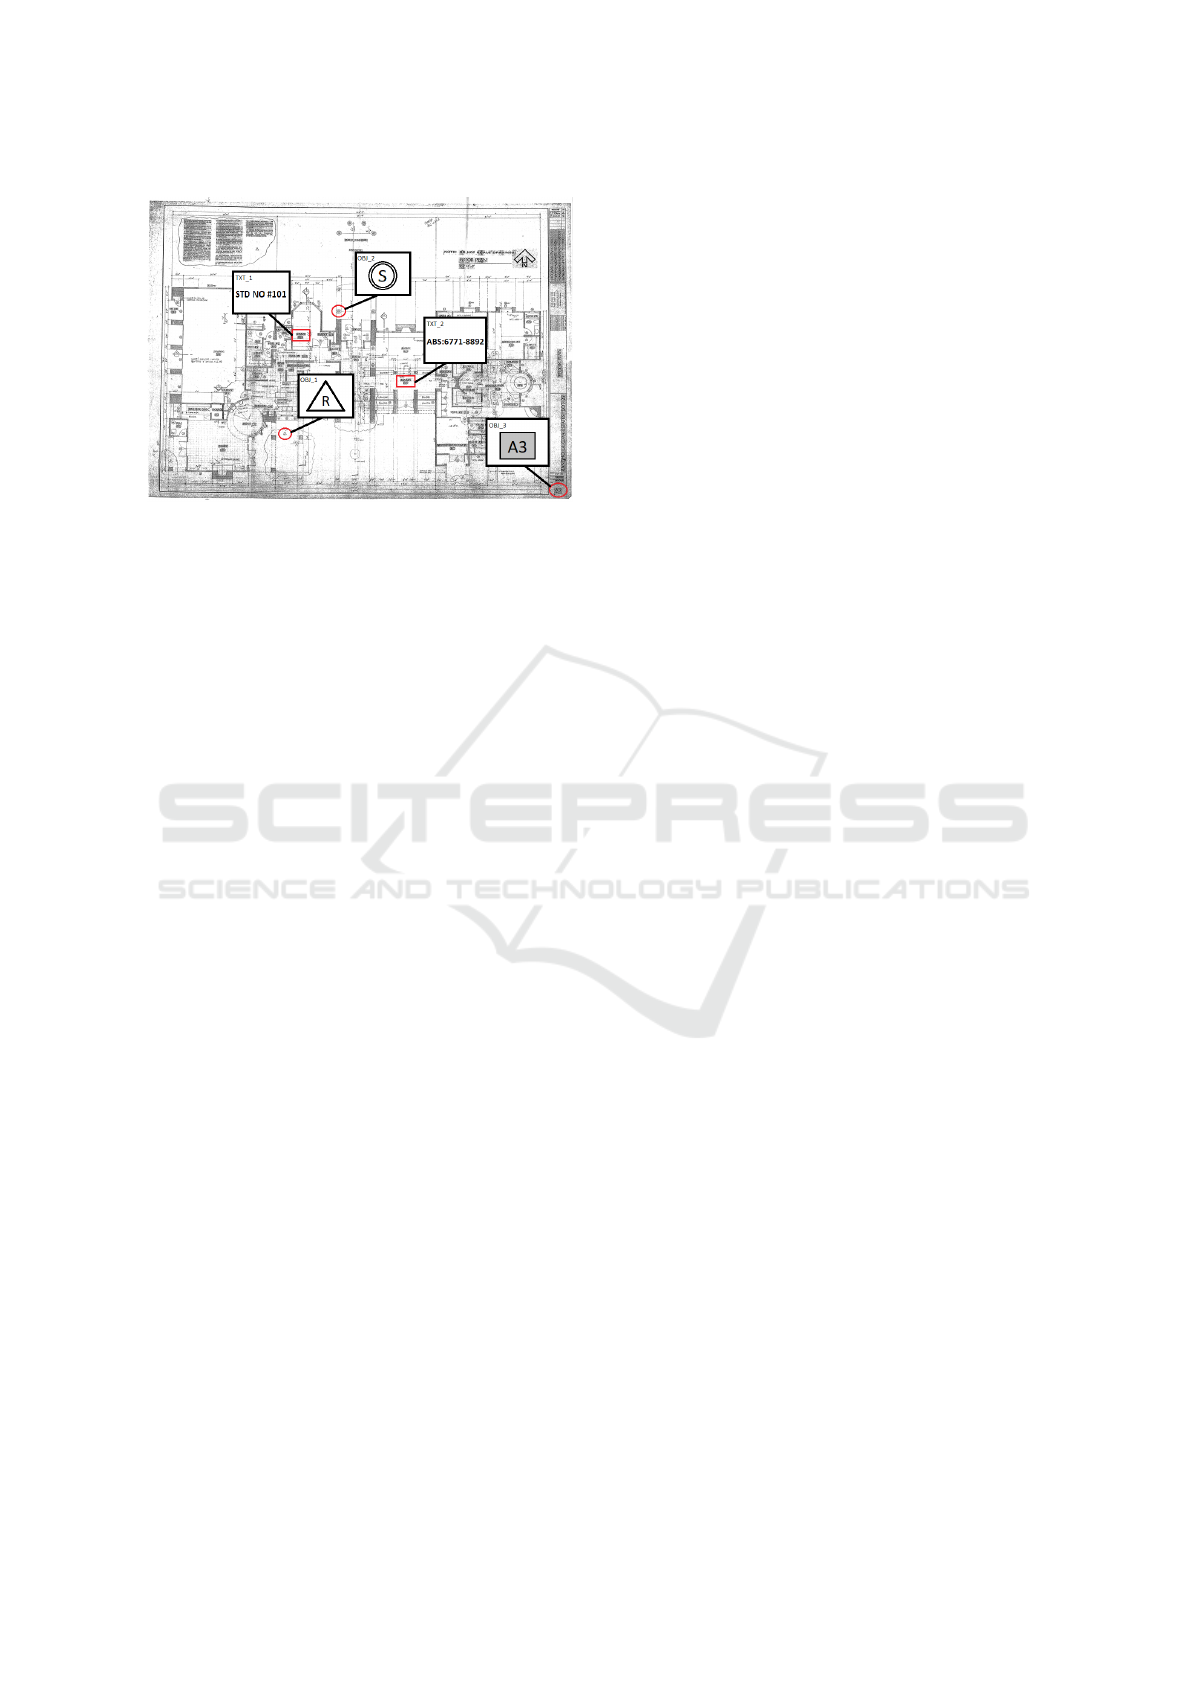
Figure 1: An example of a complex technical drawing with
several visual objects and text patterns.
ings, since only those objects and text patterns carry
the information of concern and they could be used as
search indexes for retrieving the drawings later. An
example of the data is demonstrated in Figure 1. With
that requirement, the outputs of the system are the de-
tected objects and text patterns (i.e. their locations in
the drawings and their type/class). As for the text pat-
terns, the system not only locates their positions but
also transcribes them into text, which is a typical OCR
process. Our models are trained and evaluated using a
real dataset containing nearly five thousand technical
drawings that were labeled manually by human op-
erators. On this dataset, the system shows promising
results and the capability to reduce the human label-
ing effort to a great extent. We believe the system’s
performance is scalable to a much larger dataset, and
hence, it can be applied directly in the process of dig-
itizing scanned documents.
2 RELATED WORK
Since the 1950s, when the first commercial OCR
products became available in the United States, other
OCR systems have been researched and developed
(Fujisawa, 2007). In the 1960s, IBM introduced mod-
els of optical readers for businesses. One of them
can read 200 types of fonts of printed materials. In
the 1970s, commercial OCR products flourished in
Japan, most notable is the national project including
the Kanji handwriting recognition project. The first
handwriting recognition product with touching char-
acters was introduced in 1983. By the 1990s, with
the development of hardware, operating systems and
programming languages, OCR products running on
computers had become very popular in the market.
Nowadays, with only smart mobile devices, it is pos-
sible to perform OCR on documents with high accu-
racy. Also, for large-scale applications, many cloud
service providers such as Google Vision, AWS Tex-
tract, Azure OCR, etc. offer text detection as one of
their various computer vision capabilities.
Tesseract OCR is the most well-known open-
source system developed by HP between 1984 and
1994, appearing for the first time in the “UNLV An-
nual Test of OCR Accuracy” contest in 1995 (Rice
et al., 1995) and surpassing all other commercial OCR
systems at the time. Ever since 2006, the system
has continued to be developed under the investment
of Google (Smith, 2007). Because it is open-source,
the architecture of Tesseract OCR is published. De-
velopers can use Tesseract OCR as an engine to build
their own recognition system. The accuracy of Tesser-
act OCR ranges from 90% to 99% depending on the
language being recognized. However, it can only per-
form well on clean input images and pre-defined fonts
while noisy images and custom fonts or layouts would
cause the system to be unusable.
Besides commercial off-the-shelf systems, OCR,
especially non-traditional problems (text extraction in
images with complex backgrounds and unstructured
layouts), is still an active field of research with numer-
ous novel methods proposed every year (Zhu et al.,
2016; Long et al., 2018). Currently, the prominent
trend for solving non-traditional OCR is to combine
a text detection module with a text recognition mod-
ule (Jaderberg et al., 2016; Liu et al., 2018; Borisyuk
et al., 2018; Zhan et al., 2019). In (Jaderberg et al.,
2016), the proposed system is based on a region pro-
posal mechanism for detection and deep convolu-
tional neural networks for recognition. However, their
recognition model is word-based instead of character-
based as ours. Liu et al. introduced a unified end-
to-end trainable Fast Oriented Text Spotting (FOTS)
network in (Liu et al., 2018). This network is a com-
bination of detection and recognition modules with
the computation and visual information shared among
the two complementary tasks. The Rosetta system
(Borisyuk et al., 2018) is another deployed and scal-
able OCR system, designed to process images up-
loaded daily at Facebook scale. It is also divided into
a two-staged process, where the Faster-RCNN model
(Ren et al., 2015) is used for text detection and a
sequence-to-sequence with CTC loss (Graves et al.,
2006) is used for text recognition.
3 PROPOSED METHOD
As mentioned previously, a typical OCR system con-
sists of an object detection module and a text recog-
nition module. Object detection is the process of lo-
Object Detection and Text Recognition in Large-scale Technical Drawings
613

calizing the exact position and bounding box of the
visual objects or texts that we want to extract in a big
image with complicated details. Given the difficult
nature of the problem, the object detection module
must be carefully chosen from various state-of-the-
art methods. After studying many of them, we con-
sider Faster R-CNN (Ren et al., 2015) to be the most
suitable one since it is widely used and has shown to
work well with real-life data. As for the text recogni-
tion module, we choose the character-based approach
since the texts being recognized are sequences of sep-
arate characters with little correlation (unlike mean-
ingful words). Therefore, in this module, the char-
acters are segmented then recognized independently.
The system overview is represented in Figure 2.
3.1 Object Detection with Faster
R-CNN
Faster R-CNN (Ren et al., 2015) is the improved ver-
sion of Fast R-CNN (Girshick, 2015), which is, in
turn, an advancement from the original Region-based
Convolutional Neural Network (R-CNN) (Girshick
et al., 2014). The most notable improvement of Faster
R-CNN compared to previous R-CNN models is that
both region proposal generation and object detection
are done by the same CNNs instead of using a simple
selective search algorithm as before. As a result, the
model performs much faster and more efficient than
past models.
3.1.1 Region Proposal Network
In R-CNN and Fast R-CNN, region proposals are first
generated by the selective search algorithm, then a
CNN-based network is used to classify the object and
detect the bounding box. The main difference be-
tween the two models is that R-CNN inputs the region
proposals at pixel level into CNN for detection while
Fast R-CNN inputs the region proposals at feature
map level. It can be seen from both models that the
region proposal network (RPN) (i.e. selective search)
and the detection network are decoupled. With such
design, the detection module will suffer greatly from
the cascading error made by the RPN.
In Faster R-CNN, RPN uses CNN instead of selec-
tive search, and this CNN is shared with the detection
network. First, the input image goes through convo-
lutional layers and feature maps are extracted. Then,
a sliding window is used in RPN for each location
over the feature maps. For each location, k (k = 9)
anchor boxes are used (three scales of 128, 256 and
512, and three aspect ratios of 1:1, 1:2, 2:1) for gener-
ating region proposals. A classification layer outputs
2k scores for whether there is an object or not for k
boxes. A regression layer outputs 4k numbers for the
localization of k boxes (i.e. box center coordinates,
box’s width and height). With the feature map’s size
of W × H, there are W × H × k anchors in total. The
loss function used for training is:
L (
{
p
i
}
,
{
t
i
}
) =
1
N
cls
∑
i
L
cls
(p
i
, p
∗
i
)
+ λ
1
N
reg
∑
i
p
∗
i
L
reg
(t
i
,t
∗
i
)
(1)
with the first term the binary classification loss, and
the second term the regression loss of the bounding
boxes only when there is an object detected. Thus, the
RPN pre-checks which location contains the object.
The corresponding locations are then passed to the de-
tection network for determining the class and bound-
ing box of that object. As the proposed regions can
be highly overlapped with each other, non-maximum
suppression (NMS) is used to reduce the number of
proposals.
3.1.2 Detection Network
Except for the RPN, the detection network of Faster
R-CNN is very similar to the Fast R-CNN. Region
of Interest (ROI) pooling is performed first. Then,
the pooled areas go through a CNN and two fully-
connected layers, one for classification and one for
bounding box regression. We employ Faster R-CNN
as it is proposed in (Ren et al., 2015) with the default
settings, hence, a detailed understanding of the model
can be acquired by going through their original work.
3.2 Character-based Recognition
After the text has been localized using the object
detection mechanism as described above, we use
a character-based recognition method to transcribe
them. Character-based recognition usually consists of
two main stages: character segmentation and charac-
ter recognition.
3.2.1 Character Segmentation
The character segmentation module takes in images
of the detected text areas. The task is to divide
each text image into smaller images of each character.
Since the text image has been tightly cropped so that
the boundaries are close to the text itself, to split the
characters we only need to define one vertical sepa-
ration line (one-pixel wide) for every two consecutive
characters. From these lines, we can then resolve the
ICPRAM 2021 - 10th International Conference on Pattern Recognition Applications and Methods
614
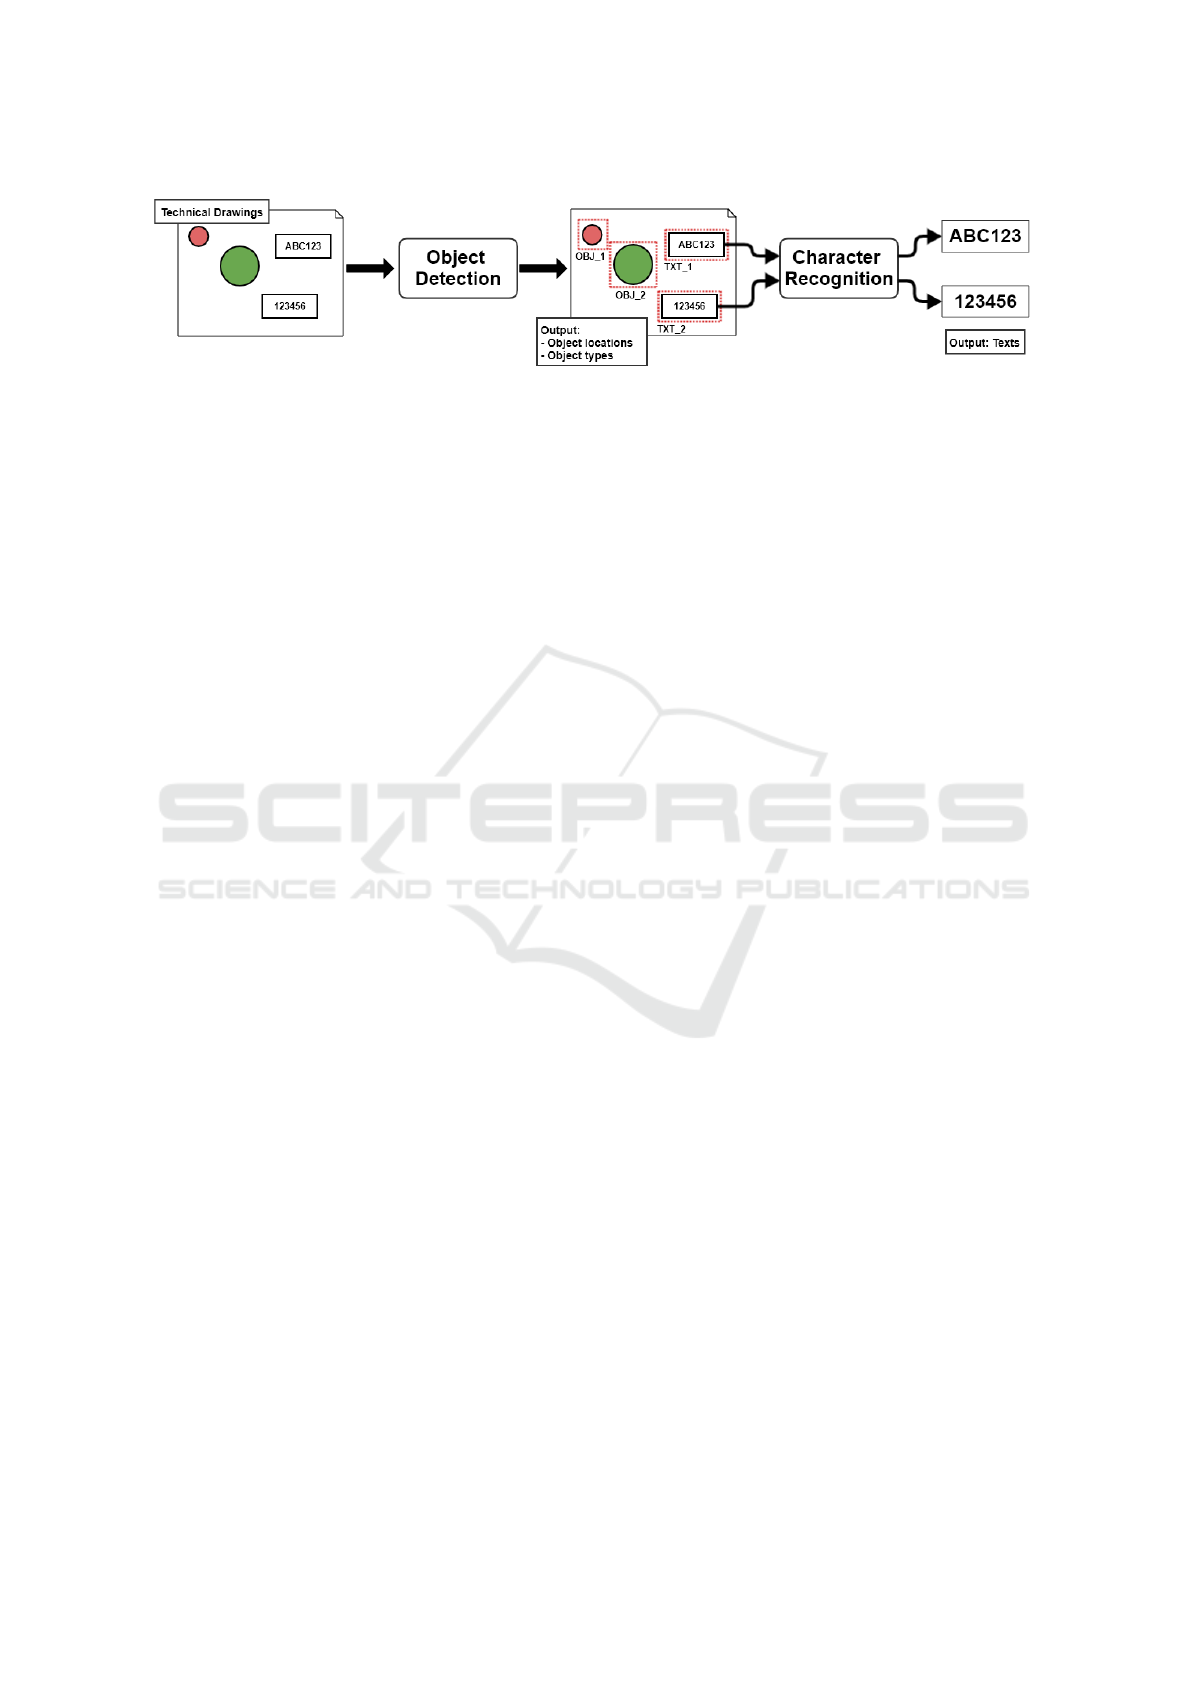
Figure 2: System overview.
text image into a set of sub-images of characters and
use these as input data for the recognition module.
Our approach to character segmentation is similar
to the idea of a binary sliding window classifier pre-
sented in (Bissacco et al., 2013). The concept of a
vertical separation line used in our work is equivalent
to the “separation point” concept used in their study.
Concretely, we consider the problem of finding sepa-
ration lines as deciding if such a line is presented in
the middle of an image singled out by a window slid-
ing through the whole text image from left to right
using a small sliding step.
It can be seen that determining whether or not an
image contains a separation line is a binary classi-
fication problem. Therefore, we propose and train
a separation line classifier for this task. Convolu-
tional neural network (CNN) (LeCun et al., 1995)
has been proven to be the most favorable solution
for image classification. Moreover, classifying text
images is relatively straightforward because of their
simplistic structure (i.e. black text on white back-
ground). Therefore, to avoid overfitting and obtain
a good training/inferencing speed without sacrificing
the performance, we construct a deep CNN with a ba-
sic architecture of three convolutional layers followed
by three fully-connected layers where the last one is
a two-unit softmax layer. The model is trained using
the cross-entropy loss function.
Because of the small sliding step, consecutive im-
ages cropped by the window are greatly overlapped.
Hence, usually, there are multiple separation lines
predicted for a single white space between two char-
acters. This effect is unwanted since we only need
one separation line for each white space. However, it
can easily be resolved in most cases since duplicated
lines in the same white space are much closer to each
other than to those from different white spaces nearby.
By observing this, we employ a simple yet effective
filtering method in which separation lines are merged
into one if they satisfy one of the two following con-
ditions:
• All the pixels in between the lines are white.
• The distance of two successive lines is within the
size of the sliding step.
After that, we can slice the original text image into
N + 1 character images according to the positions of
N separation lines.
3.2.2 Character Recognition
With the results of the character segmentation mod-
ule being images of individual characters, the task of
character recognition is to determine which character
each image represents. Thus, similar to the aforemen-
tioned segmentation problem, character recognition is
also a typical classification problem. We also apply a
deep CNN for this task, much the same as in the pre-
vious module. The model here has two convolutional
layers and then two fully-connected layers with the
number of classes defined in the softmax layer is the
size of the character vocabulary.
3.3 Post-processing
Character-based recognition requires each character
to be isolated and identified independently. By do-
ing so, we eliminate the association between charac-
ters. On one side, this is what we want because our
problem is more closely related to the problem of rec-
ognizing license plates than recognizing meaningful
words. In other terms, we do not want our model to
pick up on misleading co-adapting signals due to a
limited dataset. On the other hand, the approach also
discards any context information that might be useful
to determine which character an image actually rep-
resents when many characters are visually similar or
even almost identical (e.g. “1”, “I”, and “l”, or “0”
and “O”, etc.)
Recognizing look-alike characters is hard, even
for humans, especially when there is little to no con-
text involved. To deal with this problem, we study the
data to detect some notable patterns in the text (e.g.
certain sequences begin with 3 letters then 5 num-
bers). These patterns do not apply to all the texts,
but in many cases, they are useful to determine which
group of characters (number, letter, symbol, etc.) is
valid at a position in the sequence. Next, for each
character c in the vocabulary, we collect a set of char-
acters that are easily confused to c. This can be
Object Detection and Text Recognition in Large-scale Technical Drawings
615

achieved by obtaining the confusion matrix produced
by the character recognition model. We also notice
that many of the texts are repeating in the dataset as
they are being reused in multiple technical drawings.
Hence, we build a dictionary of known texts that have
appeared in the training dataset, called D.
Given a predicted text sequence t =
{
c
1
, ..., c
N
}
,
the post-processing algorithm substitutes each char-
acter c
i
with all possible candidate characters, defined
by P
i
= V
i
∩C
i
, with V
i
is the set of valid characters at
i and C
i
is the set of confusing character with c
i
. The
result, therefore, composes a list of candidate texts,
T = P
1
× ... × P
N
(× is the Cartesian product). Sup-
pose T
0
= T ∩ D, the resulting text is:
t
0
=
argmin
t
0
∈T
0
(edit dist (t, t
0
)) (T
0
6=
/
0)
argmin
t
0
∈T
(edit dist (t, t
0
)) (T
0
=
/
0)
(2)
The edit dist() function being used is the Levenshtein
edit distance (Levenshtein, 1966). Along with this al-
gorithm, we also use pre-defined regular expression
rules to refine the final text and eliminate any dis-
cernible mistake.
4 EXPERIMENT AND RESULTS
4.1 Dataset
Our models are trained and evaluated using a real
dataset containing 4630 technical drawings that were
labeled manually by human operators. Specifically,
we split the dataset into 4266 training files and 364
testing files. The image sizes and orientations vary
drastically from drawing to drawing, most images
have their larger dimension (i.e. width or height)
ranging from 5000 to 50, 000 pixels. On the contrary,
the average size of the visual objects is just about
50 × 50 pixels, and the average height of the text pat-
terns is about 20 pixels.
Since our goal is to make the system production-
ready, the dataset we collected is drawn from the same
population as the targeted dataset which potentially
contains hundreds of millions of unlabeled documents
needed to be digitized. Therefore, we are confident
that the results obtained from this sampled dataset re-
flect the true performance of the system when it is
scaled up to handle a much larger dataset. Figure 3
shows the data distribution of two text pattern types
(“TXT 1” and “TXT 2”) and three visual object types
(“OBJ 1”, “OBJ 2”, and “OBJ 3”). These are the
specific types of information the system needs to ex-
tract from the technical drawings. Since the collected
training data of 4266 files is relatively small, we use
31%
7%
30%
17%
15%
TXT_1
TXT_2
OBJ_1
OBJ_2
OBJ_3
Figure 3: Data distribution of two text pattern types and
three object types.
data augmentation methods to increase the size of the
training datasets for both object detection and charac-
ter recognition, which will be further explained next.
4.1.1 Data Generation for Object Detection
Firstly, we cut out all the objects and text patterns in
the training files and call them samples. Then, we use
a sliding window with the size of 1200×2400 to slide
over each image; the stride is 1000 pixels. This will
result in a series of 1200 × 2400 small images cut out
by the sliding window at each position. For each of
the small images, we consider two cases:
• If it contains any object or text pattern, we
do nothing and move it directly to the training
dataset.
• Else, we randomly select a maximum of 7 sam-
ples, rescale them with a ratio ranging from 0.8
to 1.5 in both width and height, and then paste
them in random positions in the small image so
that they do not overlap each other. Finally, some
noise is added and this small image is also moved
to the training dataset.
4.1.2 Data Generation for Character
Recognition
The character-based recognition module contains two
deep learning models: a separation line classifier and
a character classifier; both require ground truth data
for training. For the separation line classifier, the
training data are two distinct sets of images: the ones
that contain the separation line in the middle and the
ones that do not. To obtain them, we must pick a sep-
aration line for every pair of consecutive characters in
the text pattern images. Of course, this task can be
done entirely by human operators. However, to re-
duce the time and effort of manually labeling all the
data, we train an initial version of the classifier us-
ing a dataset generated by a simple separation line de-
tection algorithm based on recognizable white spaces
between characters. At this stage, no human labeling
ICPRAM 2021 - 10th International Conference on Pattern Recognition Applications and Methods
616

effort is needed. This model can handle most cases
but it is not robust to noise. Nonetheless, it can act as
the first labeling operator and only requires humans
to review and curate any wrong prediction. This can
decrease the manual labeling effort greatly. The la-
beled data after being curated becomes the final train-
ing dataset of the model.
After the separation lines are labeled for training
the segmentation model, the training dataset for char-
acter recognition can be attained by cutting out the
character images based on the separation lines and
sorting them into corresponding classes. However,
since some characters appear in the text patterns far
more (or less) often than others, the training dataset
collected in this way has a very unbalanced distribu-
tion, and this could result in a bad model. To alleviate
the problem, we apply two data augmentation meth-
ods in combination as follows:
1. We expand the data size of infrequent characters
by collecting images of them in all the available
texts throughout the documents, in contrast with
only using the character images cut out from the
text patterns of interest. The general idea we em-
ploy here is similar to the data generation process
for character segmentation; we first build a weak
character classifier to roughly sort the character
images into their corresponding classes, and then
we curate the dataset manually.
2. We also use multiple image processing techniques
to transform the original images, such as adding
various noise patterns, rescaling, rotating, and
skewing the images, etc. to obtain even more
training samples.
After applying all these techniques, we can balance
the number of training images for all character classes
and increase the size of the training data tenfold.
4.2 Evaluation Metrics
4.2.1 Object Detection
We use intersection over union (IoU) and F1 score
to evaluate the model. IoU measures the overlap be-
tween two bounding boxes, one is the ground truth
bounding box and the other is the predicted one. In
this work, we define the IoU threshold to be 0.5 to
classify whether a predicted bounding box is positive
(IoU ≥ 0.5) or negative (IoU < 0.5). F1 score mea-
sures a test’s accuracy, and it is the harmonic mean of
precision and recall:
F1 = 2 ×
Precision × Recall
Precision + Recall
(3)
where Precision is the number of correct positive re-
sults divided by the number of all positive results re-
turned by the classifier:
Precision =
T P
T P + FP
(4)
and Recall is the number of correct positive results
divided by the number of all relevant samples:
Recall =
T P
T P + FN
(5)
with T P is true positive, FP is false positive, FN is
false negative.
4.2.2 Character Recognition
To evaluate the output of the character recognition
module and also the entire system for text pattern
types, we employ the exact match (EM) accuracy
metric, where the text is considered correctly out-
putted if and only if it matches exactly with the
ground truth text pattern:
EM =
1
N
N
∑
i=1
I (p
i
= g
i
) (6)
where N is the total number of text patterns detected
by object detection module; p
i
and g
i
are the ith pre-
dicted and ground truth text, respectively.
4.3 Results
Our models are implemented using TensorFlow. For
the object detection model, we keep all the default set-
tings of the proposed Faster R-CNN (Ren et al., 2015)
while we re-implement it. On the other hand, both
the character segmentation and recognition model are
built from scratch with all the parameters randomly
constructed with the Glorot normal initializer (Glo-
rot and Bengio, 2010). We use Adam optimization
(Kingma and Ba, 2014) with mini-batch gradient de-
scent; the initial learning rate is set to 0.001.
After training all the models, the system is evalu-
ated on the test dataset which contains 364 technical
drawings. Figure 4 shows two types of results. Ob-
ject detection accuracy represents the F1 accuracy of
the object detection module on each type of objects,
it ranges from 78% to 97%; the average object detec-
tion accuracy is 88.8%. The other type of result is the
overall accuracy of the whole system, which includes
the results outputted from the character recognition
module. As can be seen from the chart, the overall
system always has lower accuracy than the object de-
tection module alone since the character recognition
module cannot process correctly any objects that are
Object Detection and Text Recognition in Large-scale Technical Drawings
617
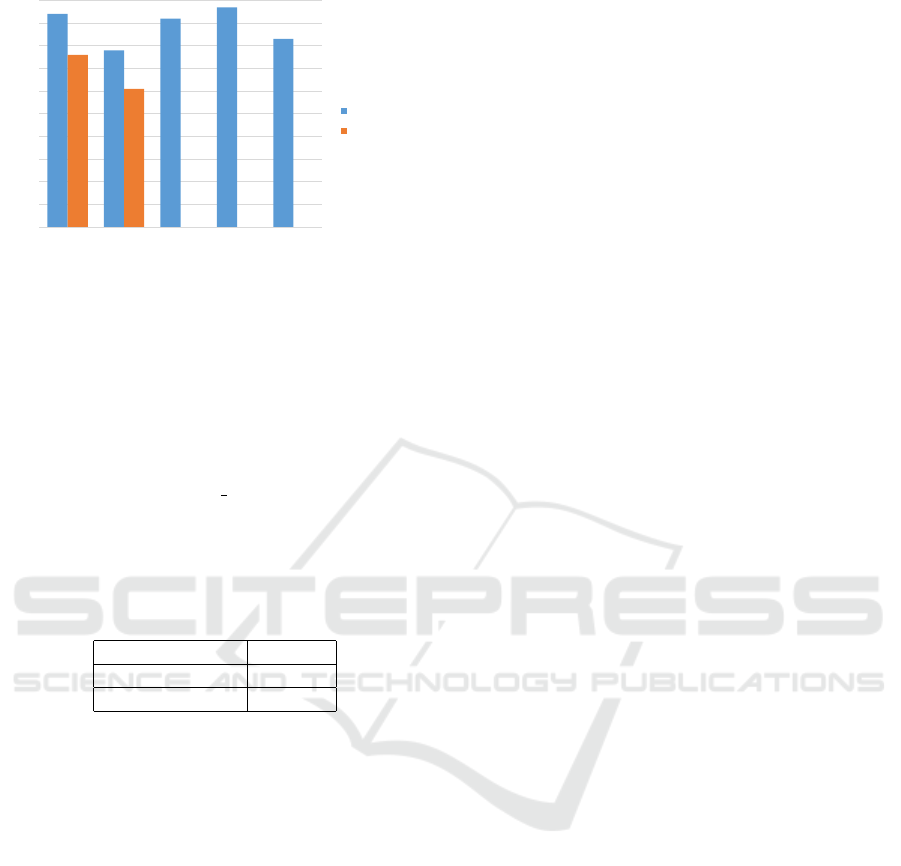
94%
78%
92%
97%
83%
76%
61%
0%
10%
20%
30%
40%
50%
60%
70%
80%
90%
100%
TXT_1 TXT_2 OBJ_1 OBJ_2 OBJ_3
Object detection
Overall
Figure 4: Object detection and Overall accuracy evaluated
on the test dataset.
wrongly detected. This is called a cascading error
problem, meaning that the subsequent modules in a
pipeline system have to suffer the errors made by the
previous modules. In spite of that, after taking into ac-
count the results from character recognition, the over-
all system still achieves 81.8% accuracy on average,
which is remarkable considering the difficult nature
of the problem. The “TXT 2” class has significantly
fewer training examples other classes (as can be seen
in Figure 3), which results in it being the least accu-
rately recognized class.
Table 1: The exact match (EM) accuracy of the system with
and without the Post-process module.
EM (%)
No Post-process 61.0
Overall 68.5
In section 2.4, we proposed a post-processing al-
gorithm that is based on the characteristics of the text
patterns. We also evaluate the efficacy of this mod-
ule in terms of its contribution to the overall accu-
racy, the results are shown in Table 1. The increase
of 7.5% when using the post-processing module has
proven that by thoroughly analyzing the text patterns
and employing just a simple algorithm based on that,
we can effectively improve the performance of the
overall system. Moreover, this post-processing algo-
rithm is also generic and can be applied to other types
of text patterns that have similar features to ours,
which mostly contain uncorrelated characters that do
not form a meaningful text.
5 CONCLUSIONS
Given the problem of automatic pattern recognition
from large-scale technical drawings, we introduced a
pipeline system which consists of two modules: ob-
ject detection and character recognition. The exper-
iments done on nearly five thousand real technical
drawings demonstrate the effectiveness of our system
in terms of performance and the capability to scale
up for a much larger dataset. We also show the im-
portance of data augmentation in the training process
and the efficacy of the post-process in the inference
phase. Since the system is designed in a pipeline man-
ner, it suffers from cascading errors which can affect
the overall performance. Therefore, in the future, we
will improve our system even further by turning it into
an end-to-end system where multiple phases can be
integrated into a single model.
ACKNOWLEDGEMENTS
This research was supported by QAI, FPT Software,
Vietnam. We thank our colleagues from QAI who
provided insight and expertise that greatly assisted the
research. We also thank the anonymous reviewers for
providing helpful comments on earlier drafts of the
manuscript.
REFERENCES
Bissacco, A., Cummins, M., Netzer, Y., and Neven, H.
(2013). Photoocr: Reading text in uncontrolled condi-
tions. In Proceedings of the IEEE International Con-
ference on Computer Vision, pages 785–792.
Borisyuk, F., Gordo, A., and Sivakumar, V. (2018). Rosetta:
Large scale system for text detection and recognition
in images. In Proceedings of the 24th ACM SIGKDD
International Conference on Knowledge Discovery &
Data Mining, pages 71–79. ACM.
Fujisawa, H. (2007). A view on the past and future of
character and document recognition. In Ninth Interna-
tional Conference on Document Analysis and Recog-
nition (ICDAR 2007), volume 1, pages 3–7. IEEE.
Girshick, R. (2015). Fast r-cnn. In Proceedings of the IEEE
international conference on computer vision, pages
1440–1448.
Girshick, R., Donahue, J., Darrell, T., and Malik, J. (2014).
Rich feature hierarchies for accurate object detec-
tion and semantic segmentation. In Proceedings of
the IEEE conference on computer vision and pattern
recognition, pages 580–587.
Glorot, X. and Bengio, Y. (2010). Understanding the diffi-
culty of training deep feedforward neural networks.
In Proceedings of the thirteenth international con-
ference on artificial intelligence and statistics, pages
249–256.
Graves, A., Fern
´
andez, S., Gomez, F., and Schmidhu-
ber, J. (2006). Connectionist temporal classification:
labelling unsegmented sequence data with recurrent
neural networks. In Proceedings of the 23rd interna-
ICPRAM 2021 - 10th International Conference on Pattern Recognition Applications and Methods
618

tional conference on Machine learning, pages 369–
376. ACM.
Jaderberg, M., Simonyan, K., Vedaldi, A., and Zisserman,
A. (2016). Reading text in the wild with convolutional
neural networks. International Journal of Computer
Vision, 116(1):1–20.
Kingma, D. P. and Ba, J. (2014). Adam: A
method for stochastic optimization. arXiv preprint
arXiv:1412.6980.
LeCun, Y., Bengio, Y., et al. (1995). Convolutional net-
works for images, speech, and time series. The
handbook of brain theory and neural networks,
3361(10):1995.
Levenshtein, V. I. (1966). Binary codes capable of cor-
recting deletions, insertions, and reversals. In Soviet
physics doklady, volume 10, pages 707–710.
Liu, X., Liang, D., Yan, S., Chen, D., Qiao, Y., and Yan, J.
(2018). Fots: Fast oriented text spotting with a unified
network. In Proceedings of the IEEE conference on
computer vision and pattern recognition, pages 5676–
5685.
Long, S., He, X., and Ya, C. (2018). Scene text detection
and recognition: The deep learning era. arXiv preprint
arXiv:1811.04256.
Ren, S., He, K., Girshick, R., and Sun, J. (2015). Faster
r-cnn: Towards real-time object detection with region
proposal networks. In Advances in neural information
processing systems, pages 91–99.
Rice, S. V., Jenkins, F. R., and Nartker, T. A. (1995). The
fourth annual test of ocr accuracy. Technical report,
Technical Report 95.
Smith, R. (2007). An overview of the tesseract ocr engine.
In Ninth International Conference on Document Anal-
ysis and Recognition (ICDAR 2007), volume 2, pages
629–633. IEEE.
Ye, Q. and Doermann, D. (2014). Text detection and
recognition in imagery: A survey. IEEE transac-
tions on pattern analysis and machine intelligence,
37(7):1480–1500.
Zhan, F., Xue, C., and Lu, S. (2019). Ga-dan: Geometry-
aware domain adaptation network for scene text de-
tection and recognition. In Proceedings of the IEEE
International Conference on Computer Vision, pages
9105–9115.
Zhu, Y., Yao, C., and Bai, X. (2016). Scene text detection
and recognition: Recent advances and future trends.
Frontiers of Computer Science, 10(1):19–36.
Object Detection and Text Recognition in Large-scale Technical Drawings
619
