
I-ODA, Real-world Multi-modal Longitudinal Data for Ophthalmic
Applications
Nooshin Mojab
1
, Vahid Noroozi
1
, Abdullah Aleem
2
, Manoj P. Nallabothula
2
, Joseph Baker
2
,
Dimitri T. Azar
2
, Mark Rosenblatt
2
, R. V. Paul Chan
2
, Darvin Yi
2
, Philip S. Yu
1
and Joelle A. Hallak
2
1
Department of Computer Science, University of Illinois at Chicago, Chicago, IL, U.S.A.
2
Department of Ophthalmology and Visual Sciences, University of Illinois at Chicago, Chicago, IL, U.S.A.
Keywords:
Medical Imaging Data, Medical Applications, Real-world Clinical Data, Longitudinal Multi-modal Data.
Abstract:
Data from clinical real-world settings is characterized by variability in quality, machine-type, setting, and
source. One of the primary goals of medical computer vision is to develop and validate artificial intelligence
(AI) based algorithms on real-world data enabling clinical translations. However, despite the exponential
growth in AI based applications in healthcare, specifically in ophthalmology, translations to clinical settings
remain challenging. Limited access to adequate and diverse real-world data inhibits the development and
validation of translatable algorithms. In this paper, we present a new multi-modal longitudinal ophthalmic
imaging dataset, the Illinois Ophthalmic Database Atlas (I-ODA), with the goal of advancing state-of-the-art
computer vision applications in ophthalmology, and improving upon the translatable capacity of AI based
applications across different clinical settings. We present the infrastructure employed to collect, annotate, and
anonymize images from multiple sources, demonstrating the complexity of real-world retrospective data and
its limitations. I-ODA includes 12 imaging modalities with a total of 3, 668, 649 ophthalmic images of 33, 876
individuals from the Department of Ophthalmology and Visual Sciences at the Illinois Eye and Ear Infirmary
of the University of Illinois Chicago (UIC) over the course of 12 years.
1 INTRODUCTION
The past decade has witnessed dramatic growth in
the development of artificial intelligence (AI) appli-
cations in healthcare, specifically in ophthalmology
(Schmidt-Erfurth et al., 2018; Lu et al., 2018; Ting
et al., 2019; Grewal et al., 2018). With the promis-
ing success of deep learning models in computer vi-
sion, the field of medical imaging analysis has grown
immensely towards the development of deep learning
based applications serving multiple purposes. Several
research studies have employed deep learning algo-
rithms to address various problems in ophthalmology
from detection to progression predictions (Burlina
et al., 2017; Burlina et al., 2018; Varadarajan et al.,
2018; Gargeya and Leng, 2017; Gulshan et al., 2016;
Medeiros et al., 2019; Thompson et al., 2019; Fu
et al., 2018). Despite the high performance of these
models, their translation to real-world clinical settings
is still an ongoing problem. Our goal is to address
three core research problems in ophthalmic computer
vision applications: (i) advance medical computer vi-
sion and machine learning-based applications in oph-
thalmology; (ii) provide an infrastructure to enhance
generalizations and the translational capacity of AI
applications across different clinical settings; and (iii)
understand disease progression trends across various
ophthalmic diseases, and address algorithm bias. One
of the main limitations with AI applications in health-
care is the lack of adequate and diverse longitudinal
patient data to allow for successful translational appli-
cations. The current publicly available datasets that
are mostly used to develop AI algorithms for oph-
thalmic applications (Fumero et al., 2011; Almazroa
et al., 2018; Sivaswamy et al., 2014; Decenci
`
ere et al.,
2014) have three main limitations: (i) limited number
of patients and imaging data, where most of the data
come from artificial settings such as multi-center clin-
ical trials, (ii) lack of longitudinal imaging data from
various modalities, and (iii) the potential risk of bias
emanating from the lack of diversity in patient data.
Building a research-oriented medical imaging
databank from real-world settings could potentially
improve generalizations and clinical translations.
However, there are several challenges in building real-
world imaging and clinical datasets including: (i) lim-
566
Mojab, N., Noroozi, V., Aleem, A., Nallabothula, M., Baker, J., Azar, D., Rosenblatt, M., Chan, R., Yi, D., Yu, P. and Hallak, J.
I-ODA, Real-world Multi-modal Longitudinal Data for Ophthalmic Applications.
DOI: 10.5220/0010311405660574
In Proceedings of the 14th International Joint Conference on Biomedical Engineering Systems and Technologies (BIOSTEC 2021) - Volume 5: HEALTHINF, pages 566-574
ISBN: 978-989-758-490-9
Copyright
c
2021 by SCITEPRESS – Science and Technology Publications, Lda. All rights reserved
ResNet
.
.
.
SQL
Device
gfd4xc.j2k
ImageFiles
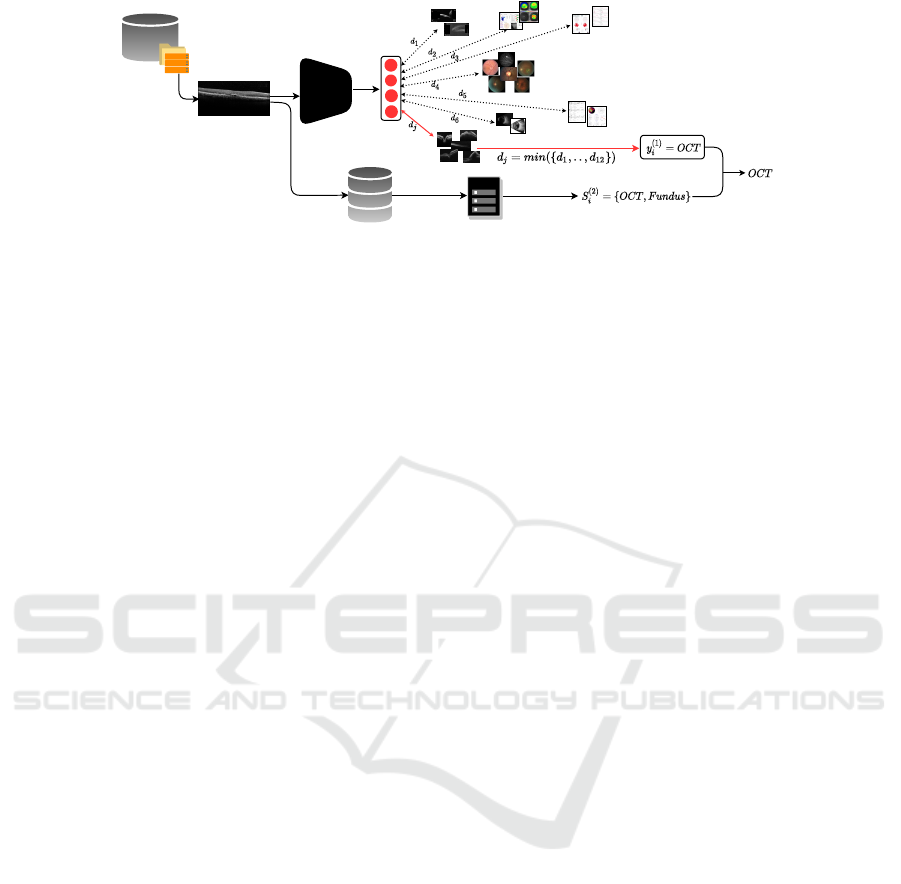
Figure 1: Illustration of the overall pipeline network for modality tagging. The raw images are fed to a ResNet network and
the modality tag is achieved by comparing the input image features with prototype images, which are further validated by
device information.
ited access to original raw data due to Health Insur-
ance Portability and Accountability Act (HIPAA), pa-
tient privacy, and ambiguity in data ownership, (ii)
data sources across multiple heterogeneous settings
with insufficient information on the data description,
collection process and integration, (iii) lack of ground
truth labels and standardization, and (iv) complex
anonymization process with strict data sharing regu-
lations.
In this paper, we introduce a longitudinal
multi-domain and multi-modal imaging dataset for
ophthalmic applications, the Illinois Ophthalmic
Database Applications (I-ODA). We propose an in-
frastructure to collect, preprocess, annotate, and
anonymize image data from multiple sources. The
dataset release is pending legal approval.
Our dataset is characterized by four main key
points: (1) more than 3.5 million image instances
clustered into a diverse set of practical image modali-
ties for ophthalmic applications, (2) longitudinal data
that includes patients receiving continuous care at
one academic medical center, (3) a mixture of data
from multiple imaging devices representing a multi-
domain data, and (4) a broad disease spectrum across
multiple ophthalmic diseases. The unique properties
of our dataset capture different characteristics of a
real-world clinical setting that can serve multiple pur-
poses for AI based ophthalmic applications. I-ODA
can provide an ideal infrastructure for validation stud-
ies and translations to patient care settings enabling
breakthroughs in medical computer vision.
2 DATABASE AND ATLAS
COMPONENTS
The Institutional Review Board (IRB) of the Univer-
sity of Illinois at Chicago approved the creation of the
I-ODA databank. Each project that utilizes the I-ODA
dataset will undergo additional review by the IRB to
ensure patient privacy and protocol adherence. The
research to build the I-ODA dataset was conducted in
accordance with the requirements of the Health Insur-
ance Portability and Accountability Act (HIPAA) and
tenets of the Declaration of Helsinki.
The I-ODA dataset includes imaging, diagnoses,
and clinical data from the Department of Ophthalmol-
ogy and Visual Sciences at the Illinois Eye and Ear In-
firmary of the University of Illinois at Chicago (UIC)
over the course of 12 years. The original data re-
sides across three main sources: (i) an in-house server
maintaining ∼ 4.5 million raw images belonging to
∼ 45K patients, (ii) a SQL database consisting of pa-
tient metadata and their corresponding imaging ses-
sions, and (iii) the University of Illinois Hospital and
Health Sciences System (UIH) billing system that in-
cludes ophthalmic and non-ophthalmic diagnoses, de-
mographics, and interventions (clinical procedures).
The raw image files are organized in a hierar-
chical structure sorted by Medical Record Numbers
(MRNs), corresponding exam sessions, and image
files residing on the in-house server that is connected
to an image management system. The image files are
generated by multiple imaging devices in the form
of either a raw image of the eye or an analysis re-
port. All the image files are originally stored in
. j2k(JPEG2000) file format with a broad range of
image resolutions. During each visit, patients can
undergo multiple imaging test sessions for each eye.
Based on a preliminary diagnosis identified by an
ophthalmologist, photos representing different struc-
tures can be taken from multiple angles in each imag-
ing test session. We refer to these images as ”im-
age modalities” which can be generated from differ-
ent devices. For example, a patient may require Fun-
dus imaging, a photo of the posterior part of the eye,
or Optical Coherence Tomography (OCT) imaging,
which can represent high-resolution cross-sectional
images of the retina. Fundus photos or OCT images
are referred to as two types of imaging modalities.
The modality of the image and the number of images
I-ODA, Real-world Multi-modal Longitudinal Data for Ophthalmic Applications
567
Diagnosis
PK
diag_id
diag_description
code_system
source
patient_id
Intervention
PK
interv_id
interv_type
treatment_code
code_system
patient_id
Image Modality
PK
modality_id
modality_name
Image File
PK
file_id
patient_id
session_id
file_name
eye_side
exam_date
modality_id
dev_id
diag_id
interv_id
Patient Demographic
PK
patient_id
age
gender
race
Image Device
PK
dev_id
dev_type
dev_name
dev_description
UIH
Patient Id=1
Session Id=1
Session Id=10
1_1_oct1.png
1_1_oct24.png
.
.
.
.
.
.
1_10_fundus1.png
1_10_fundus7.png
.
.
.
SQL
Pre-processing
Pre-processing
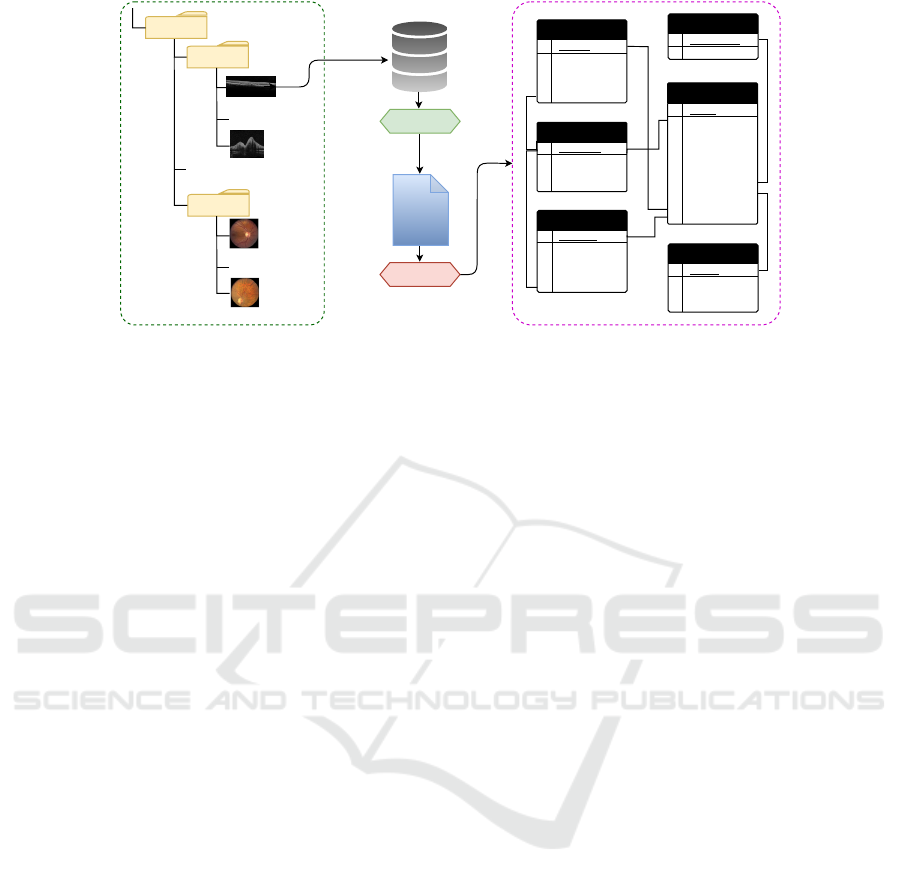
Figure 2: Illustration of the pipeline network for disease annotation and integration of the three data sources, image file
hierarchy (depicted in green bounding box), SQL data that includes patient metadata, billing data that includes diagnoses and
interventions. The final data schema is presented as a relational database constituting of 6 tables (depicted in a pink bounding
box) on the right side of the figure. Each image (depicted in red) is annotated with its corresponding image modality, diagnosis,
and interventions (depicted in green).
taken per exam session could vary for each patient de-
pending on the preliminary diagnosis. All image files
are assigned with random file names that do not reveal
the modality of the images they belong to, i.e. OCT
or Fundus.
Our SQL Server database consists of a collection
of comprehensive information including but not lim-
ited to, patient demographics and their corresponding
exam sessions, images taken in each session, and the
imaging device generating the image files. However,
to the best of our knowledge, there is no descriptive
information available on the structure of each table.
Moreover, there is no constraint defined for the at-
tributes constituting each table or the relation among
the tables. This may result in invalid, missing, and du-
plicate data records. The billing data contains infor-
mation on ophthalmic and non-ophthalmic diagnoses,
procedures and interventions, and demographics. As
with any billing data, it may also contain invalid or
errors in data records.
Given the complexity of retrospective data, we
formulated the creation of I-ODA into three main
phases: (1) Modality tagging, where we tagged each
image with its respective modality employing deep
learning and imaging devices. (2) Disease annota-
tion, where we annotated each image with its corre-
sponding patient metadata, diagnosis, and interven-
tion. (3) Anonymization, where we de-identified the
whole dataset by mainly employing clustering meth-
ods, to remove any identifiable information adhering
to HIPAA regulations.
3 MODALITY TAGGING
In this section, we describe the method used to tag
all the image files with their respective modality. Due
to the lack of any explicit information regarding the
modality of image files, we first drafted a set of po-
tential image modalities. Next, we yielded a set of
prototype images per image modality. Lastly, given
the set of modalities and prototypes, we tagged each
image with its proper modality.
3.1 Image Modality Selection
For the purpose of this paper, image modalities are de-
fined as the most common imaging types used in oph-
thalmology. The selected set must encompass all rep-
resentative modalities relevant to ophthalmic imaging
applications and its diagnostic usage. There are more
than 15 different imaging devices in use at the Illi-
nois Eye and Ear Infirmary at UIC, where each is
responsible for generating certain image modalities.
However, this assumption might be violated in a few
cases. Moreover, the set of image modalities gener-
ated by each imaging device is not necessarily exclu-
sive. For example, two different modalities, Fundus
and OCT, can be generated by three different devices.
As the imaging devices do not necessarily generate
one modality of images, they cannot be solely used
for selecting the relevant modalities but can be fur-
ther utilized as auxiliary information to narrow down
the potential candidates. Therefore, we first drafted
a set of all potential image modalities generated by
each device by extracting the imaging device infor-
mation from our SQL database. Next, to keep the
HEALTHINF 2021 - 14th International Conference on Health Informatics
568

specificity level of each modality relevant to its diag-
nostic use in ophthalmology, we merged the relevant
ones to enable a practical collection of image modali-
ties with a reasonable amount of instances per modal-
ity. To achieve this goal, we selected a random sub-
set of images per imaging device extracted from the
SQL database. Given the preliminary set of modal-
ities, we combed through the images in each subset
and selected a set of relevant modalities per subset.
We further reviewed the overall obtained modalities
from each subset to potentially merge the relevant
ones into one group. For instance, images illustrating
analysis reports containing OCT and Fundus images,
one image modality referred to as ”OCT Report” was
chosen to represent both of these images. This step
was repeated multiple times to achieve the final set of
the most common and practical modalities which was
further reviewed by ophthalmologists. The final list
contains 12 image modalities.
3.2 Prototype Image Selection
Given the image modalities obtained from the previ-
ous step, the next step was to collect a set of prototype
images for each group of modality. Images belonging
to each modality can vary in terms of color, shape,
and resolution but they are all to be considered as var-
ious members of the same modality. For instance, all
varieties of Fundus images including square or circu-
lar shaped or black and white or colored should be
tagged as one image modality named Fundus. Thus,
selected prototype images for each group of modality
must form a representative set of the whole spectrum
of images belonging to that imaging modality.
To achieve this goal, we first drafted a set of possi-
ble imaging devices that can generate each of the im-
age modalities obtained from the previous step. We
then selected a random subset of images from each
of the devices for each modality group. This resulted
in a preliminary collection of prototype images that
were selected randomly for each of the 12 modali-
ties. To further refine the preliminary collection of
prototypes for each group of the modalities, we em-
ployed a similarity-based classification method which
will be elaborated on further in the following section.
For the purpose of refinement of the prototype im-
ages, we employed the similarity-based method to tag
a randomly selected subset of data from all groups of
modalities by assigning the modality of their nearest
neighbor from the prototype images in terms of eu-
clidean distance. We then manually reviewed the re-
sults and analyzed the miss-classified ones according
to the characteristic of the members of each modal-
ity group. If the miss-classification was due to the
absence of that particular image variation in its cor-
responding set of image prototypes, that image varia-
tion was added to its corresponding prototype set. We
repeated this step multiple times each time augment-
ing the set of prototypes if necessary until we reached
a negligible error for each modality. This experiment
resulted in a final collection of 253 prototype images
across 12 image modalities.
3.3 Tagging
The proposed tagging pipeline takes the raw image
with undefined modality as input and achieves the
modality tag in two sequential steps. (1) The first tag
is achieved by employing a similarity-based classifi-
cation method. (2) The obtained tag is verified by
exploiting imaging devices. The overall pipeline net-
work is illustrated in Fig. 1.
3.3.1 Similarity-based Classification
Suppose we have a dataset with N image instances
and a set of M modalities. Our goal was to tag each
of the images in the dataset with one of the M given
modalities. We first employed a pretrained Convo-
lutional Neural Network, ResNet-50, to extract the
features for each image in the dataset and the set of
prototype images. Suppose the dataset is denoted as
D = {x
1
, ..., x
N
} where x
i
∈ R
k
represents the feature
vector and k is its dimensionality. Given the M image
modalities, we defined the set of prototype images as
V = {v
(p)
|p = 1, .., M} where v
(p)
= {y
(p)
1
, ..., y
(p)
I
p
},
y
(p)
I
p
∈ R
k
. v
(p)
represents the set of image prototypes
for the modality group p and I
p
denotes the number
of instances in modality group p. We aimed to tag the
images from the set D by assigning its nearest neigh-
bor from the set V in terms of euclidean distance
j
p
= argmin
j
p
kx
i
− y
(p)
j
k, y
(p)
j
∈ V , j = 1, ..., I
p
, p =
1, ..., M. To further ensure the reasonability of the
obtained minimum distance for the input image, we
chose a threshold for each modality group by inves-
tigating the reasonable distance range among its im-
age members. If the minimum distance achieved by
a euclidean measure matched the threshold, we as-
signed the tag for the input image x
i
by extracting the
corresponding modality p associated with the index
j
p
in V denoted as y
(1)
i
= V [I
p−1
+ j]. We then ap-
plied the similarity-based method by comparing the
images in D and the prototype images in V corre-
sponding to all the 12 image modalities and assign-
ing its nearest neighbor from V . The final set of
modality tags achieved from this step is denoted as
Y
(1)
= {y
(1)
i
|i = 1, ..., N}.
I-ODA, Real-world Multi-modal Longitudinal Data for Ophthalmic Applications
569

3.3.2 Modality Candidate Set
To validate the modality tag achieved from the first
step, we narrowed down the possible set of modal-
ity tags for each image by utilizing its corresponding
imaging device. We considered three subsets of data
according to their corresponding imaging devices and
the range of image modalities generated by each de-
vice, (i) images associated with devices that are re-
sponsible for generating only one type of imaging
modality, (ii) images associated with devices that gen-
erate a specific range of imaging modalities, usually
two, and (iii) images associated with devices that their
range of potential generated image modalities is not
clear.
Given these three groups of subsets, we assigned
each image in each subset to its possible set of modal-
ity tags according to its corresponding imaging device
extracted from the SQL database. The first group of
images which constituted ∼ 12% of the data, were
tagged with the one image modality generated by its
corresponding imaging device. The second group
which constituted ∼ 78% of the data, was assigned
with a set of potential modality tags according to
their corresponding device. The third group of im-
ages which constituted less than 1% of the data was
assigned with an unknown tag. The set of modality
tags obtained from each of these three groups of im-
ages is denoted as Y
(2)
= {S
(2)
i
|i = 1, ..., N} where
S
(2)
i
represents the set of potential image modalities
for the input image x
i
.
Given the label sets Y
(1)
and Y
(2)
, the final tag is
assigned to each image if y
(1)
i
∈ S
(2)
i
for i = 1, ..., N.
Otherwise, it is assigned as unknown for further man-
ual review and investigation.
4 DISEASE ANNOTATION
In this section, we describe our method for labeling
each image with its corresponding patient metadata,
diagnoses, and interventions utilizing our SQL server
database and UIH billing data.
4.1 Metadata
The SQL server database maintains a collection
of comprehensive information on each individual’s
metadata. The data is stored across multiple SQL ta-
bles. To the best of our knowledge, there is no de-
scriptive information on the contents of tables or the
integration among the data in different tables. There-
fore, we manually reviewed the set of attributes and
the content in each table and isolated four tables for
the purpose of creating our imaging dataset I-ODA,
including patient, file, exam, and device. In each ta-
ble, we only kept the attributes relevant to the creation
of the I-ODA dataset and disregarded the rest.
Due to manual entry from the imaging device in-
terface and lack of defined constraints on tables, the
data stored in the SQL tables are prone to noise and
errors. Therefore, we first applied a sequence of pre-
processing steps to filter out the invalid data records.
The main preprocessing steps included filtering out
invalid MRNs, duplicate MRNs with different data
records, missing data records across the relevant ta-
bles and mismatched information across SQL data
records and image file hierarchy. The patient and
file table originally contained 44, 460 patients and
4, 477, 634 image files, respectively. Applying the
preproccessing steps resulted in removing ∼ 8% of
the data. Further, we integrated the data from these
four tables into one file using their common attributes.
4.2 Diagnosis and Intervention
The University of Illinois Hospital and Health Sci-
ences System (UIH) billing system contains informa-
tion regarding diagnosis and interventions. The sys-
tem is equipped with a billing report and a dashboard
interface allowing to retrieve hospital charges given
the patient MRN for a specific date range. Given
the valid patient MRNs obtained from the previous
section, we extracted the corresponding charges from
the billing reports to retrieve all ophthalmic and non-
ophthalmic diagnoses and interventions for each pa-
tient. The interventions are referred to as any surgical
or invasive outpatient or hospital procedure.
First, we matched the format of MRNs in the
billing system to the format of the data used in the
SQL database. Next, similar to the previous sec-
tion, we applied series of preprocessing steps that re-
sulted in removing ∼ 12% of the data. Then we in-
tegrated the billing data with the metadata file ob-
tained from the SQL database in the previous sec-
tion. This file was further validated for any invalid
or mismatched data records which resulted in exclud-
ing another ∼ 6% of the data. The final file contained
33, 876 patient and 3, 668, 649 image files which were
annotated with their corresponding metadata, diag-
noses, and interventions.
At last, we constructed a relational database inte-
grating the data from all the data sources, image files,
metadata, and diagnoses. The tables are connected
through a primary key (PK) and a foreign key con-
straints defined for each table. Each table consists of
a set of relevant attributes demonstrating its associ-
HEALTHINF 2021 - 14th International Conference on Health Informatics
570
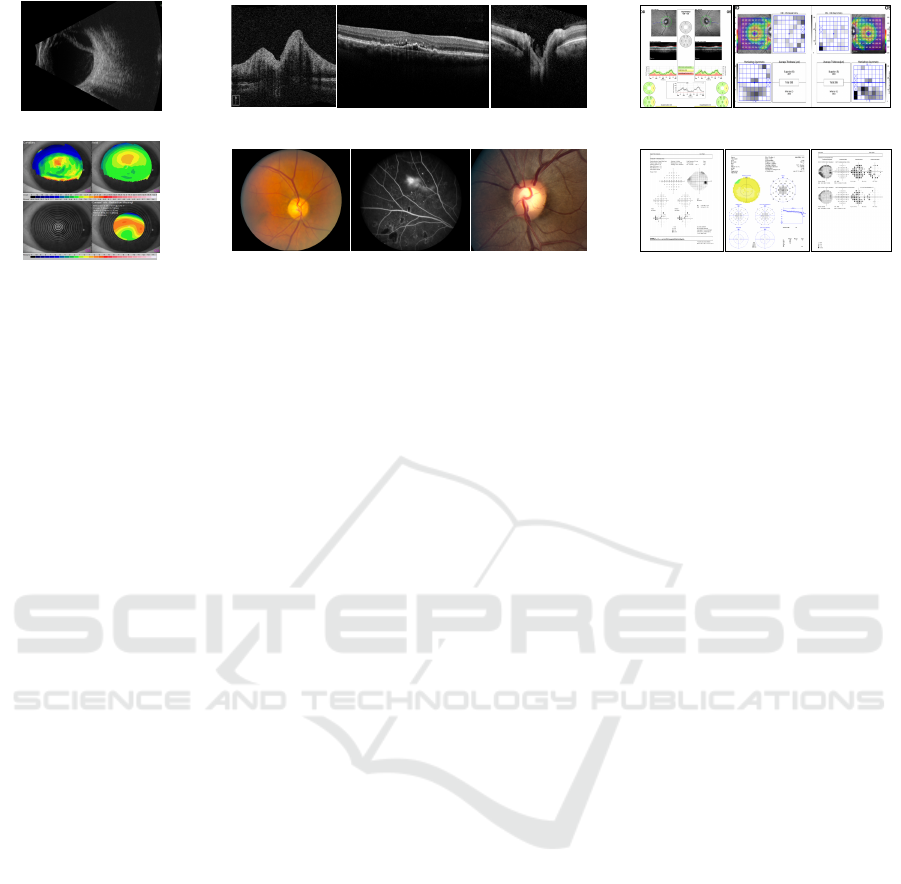
(a) B-Scan.
(b) OCT.
HVF
(c) OCT Report.
(d) Corneal Topography.
(e) Fundus.
Corneal
(f) HVF.
Figure 3: A snapshot of samples from 6 major image modalities in I-ODA dataset.
ated metadata information. The schematic of the data
schema representing the relational database and data
integration is illustrated in Fig. 2.
5 ANONYMIZATION
Data anonymization is the process where patient iden-
tifiers are irreversibly removed for patient privacy
protection, prohibiting any direct or indirect identi-
fication. According to the HIPAA regulations, sensi-
tive patient information should be protected by being
properly anonymized before being used for any re-
search purposes. Data anonymization in the context
of our work would result in a complete anonymized
dataset across both data components, image files, and
the associated metadata.
5.1 Image Anonymization
The image members in each of the 12 modality group
in our dataset can vary in terms of style, resolution,
and location of identifiable information that needs
to be masked out. The extensive range of vari-
ability among images poses a major challenge on
anonymization for such a large amount of data. To
address this challenge, we employed a K-means clus-
tering method to derive a set of categories for each of
the 12 modalities where the images in each category
are the most similar ones in terms of style, resolution,
and location of identifiable information. To choose
the initial number of clusters for each modality group,
we first randomly selected a subsample of 200 im-
ages from each modality and manually reviewed and
analyzed the selected subsamples. We further ap-
plied a set of various imaging filters, including spa-
tial/geometric, resolution, appearance, and color, to
achieve a more fine-grained categorization for each
of the categories obtained from the initial clustering.
The set of filters were chosen to be relevant to the type
of images belonging to each modality.
Next, we divided the obtained categories into two
groups based on the consistency level of the loca-
tion of identifiable information in each category. For
the first group of categories having consistent pat-
terns in terms of location of identifiable information
across their image members, we generated a location-
based masking filter specific to each category to mask
out the part of the image that contained the identifi-
able information. For the second group of categories
where the location of identifiable information varied
across images, we combed through the data and man-
ually removed the sensitive information. Eventually,
the data was reviewed by two people to anonymize
any missed data to ensure complete anonymization.
The fine-grained categories were created merely for
the purpose of anonymization. After accomplishing
the anonymization process for all the image files, the
categories were disregarded and only the 12 major
modalities were kept.
5.2 Metadata Anonymization
To de-identify the metadata, first, we extracted the set
of sensitive attributes including the patient MRN, first
and last name, date of birth, and exam session date.
The patient first and last names were removed, and the
MRN was replaced by a randomly generated number.
To keep the longitudinal nature of the date of birth
and exam session dates attributes, the patient’s date
of birth was replaced by patient’s age and the date
of exam session was replaced by subtracting the date
of birth from the date of exam session. To integrate
the anonymized metadata with the anonymized image
files, the patient and exam session directories in the
hierarchical structure of image files were renamed to
the anonymized patient ids and exam session ids re-
spectively.
I-ODA, Real-world Multi-modal Longitudinal Data for Ophthalmic Applications
571
6 DATASET
6.1 Data Statistics
As of now, the I-ODA dataset
1
contains 3, 668, 649
images and 230, 923 exam sessions across 12 im-
age modalities of 33, 876 individuals from the De-
partment of Ophthalmology and Visual Sciences at
the Illinois Eye and Ear Infirmary of UIC for eye
care. The set of image modalities includes Optical
Coherence Tomography (OCT), OCT Report, Fun-
dus, Humphrey visual field (HVF), Ultrasound, Ul-
trasound Report, B-Scans, Corneal Topography, Ex-
ternal image (slit lamp), Intraocular Lens master cal-
culation report (IOL), Optical Response Analyzer re-
port, and ERG report. The I-ODA dataset is com-
posed of two main data components integrated effec-
tively to represent a structured ophthalmic imaging
dataset, as shown in Fig. 2: (1) Anonymized image
files that are tagged with their corresponding modal-
ity and are converted to . png format and stored in
a hierarchical structure. The highest level in a hier-
archy represents a patient directory followed by its
corresponding exam session and finally the imaging
files that reside on the lowest level of the hierar-
chy. The patient and exam session directories corre-
spond to the anonymized patient ids, and session ids
from the metadata and image file names are named
as ”patientId sessionId modality” format. (2) A re-
lational database that constitutes of 6 tables repre-
senting patient demographics, image files, diagnoses,
interventions, imaging devices, and image modali-
ties integrated through primary and foreign key con-
straints. As Fig. 2 suggests, the corresponding pa-
tient metadata, diagnosis, and intervention (depicted
in green in the ”Image File” table) for each image file
(depicted in red in image file hierarchy on the left)
can be easily retrieved from the tables in our relational
database.
6.2 Data Characteristics
Our dataset captures different characteristics of a real-
world clinical setting allowing for versatile computer
vision applications in ophthalmology. Modality and
Domain: The I-ODA dataset comprises 12 different
modalities representing a comprehensive collection
of practical image modalities relevant to ophthalmic
imaging applications. Among the 12 image modali-
ties, 6 modalities, Fundus, OCT Report, OCT, HVF,
B-Scan, Corneal Topography, constitute 98% of the
1
For questions related to the I-ODA dataset and for any col-
laboration interests please contact the author, Joelle Hal-
lak.
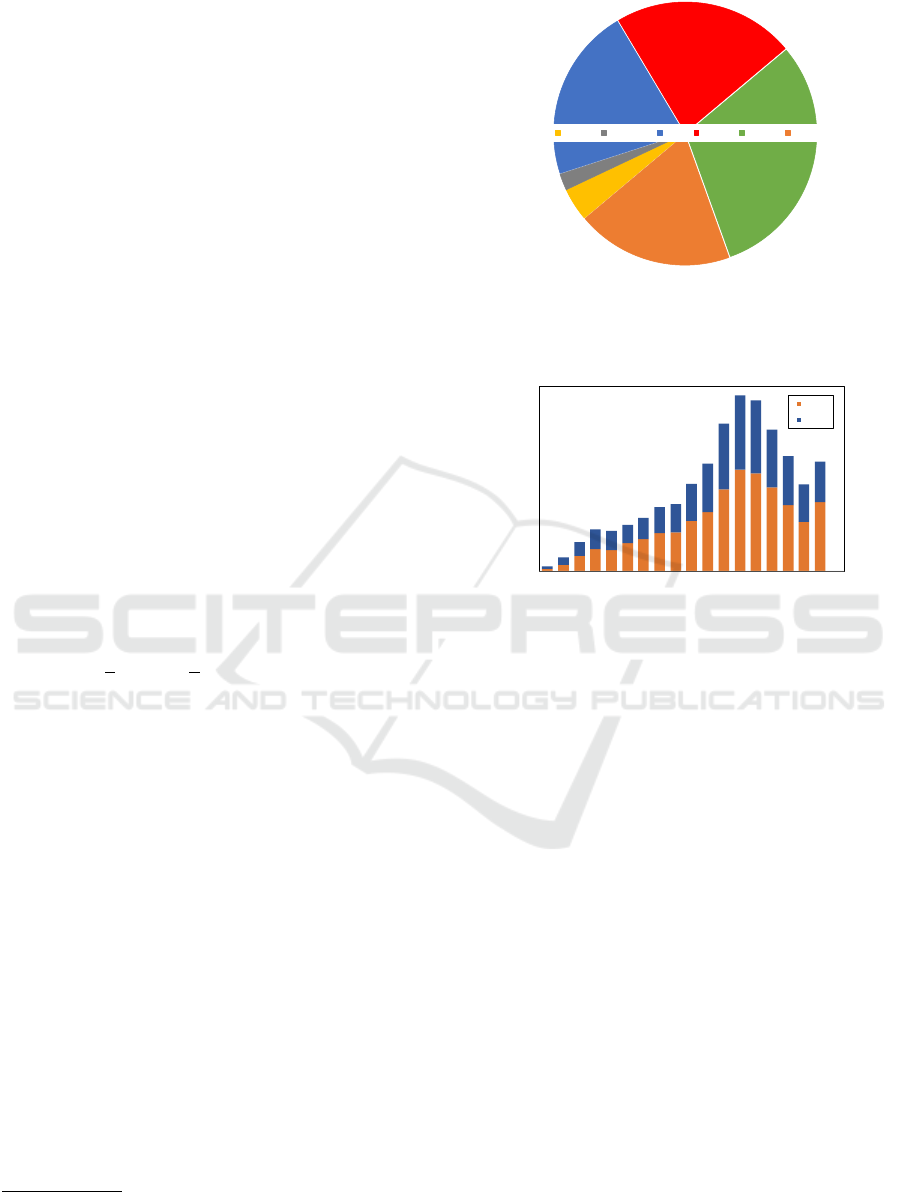
2%
4%
21%
22%
30%
19%
B-Scan
Corneal T OCT OCT R Fundus HVF
Figure 4: A snapshot of I-ODA dataset illustrating the
number of imaging exam sessions for the 6 major modal-
ities Fundus, OCT Report (OCT R), OCT, HVF, B-Scan,
Corneal Topography (Corneal T).
0
500
1000
1500
2000
2500
3000
0-4
5-9
10-14
15-19
20-24
25-29
30-34
35-39
40-44
45-49
50-54
55-59
60-64
65-69
70-74
75-79
80-84
85 +
Female
Male
Figure 5: Illustration of the gender/age population distribu-
tion in I-ODA.
imaging exam sessions. A snapshot of samples from
these 6 modalities is illustrated in Fig. 3. As can be
seen from the Fig. 3, each image modality encom-
passes a spectrum of different varieties of its image
members.
Ophthalmic disease imaging can include multiple
sessions with different modalities per patient visit.
This would result in a rich collection of longitudi-
nal imaging sessions across different image modali-
ties for ophthalmic applications. A summary of the
I-ODA dataset showing the 6 major image modalities
and the number of exam sessions per modality is il-
lustrated in Fig. 4.
As can be seen from Fig. 4, Fundus, OCT/OCT
reports, and HVF are the most commonly used imag-
ing modalities in our I-ODA dataset. These modali-
ties are also among the most commonly used in imag-
ing tests for ophthalmic blinding conditions such as
glaucoma, Age-related macular degeneration (AMD),
and diabetic retinopathy (DR). The availability of a
vast number of imaging sessions across these imag-
ing modalities, allows us to study the disease pattern
from multiple sources of data leveraging the comple-
mentary information across different views.
Moreover, the data in I-ODA is composed of more
than 15 imaging devices forming a multi-domain
HEALTHINF 2021 - 14th International Conference on Health Informatics
572
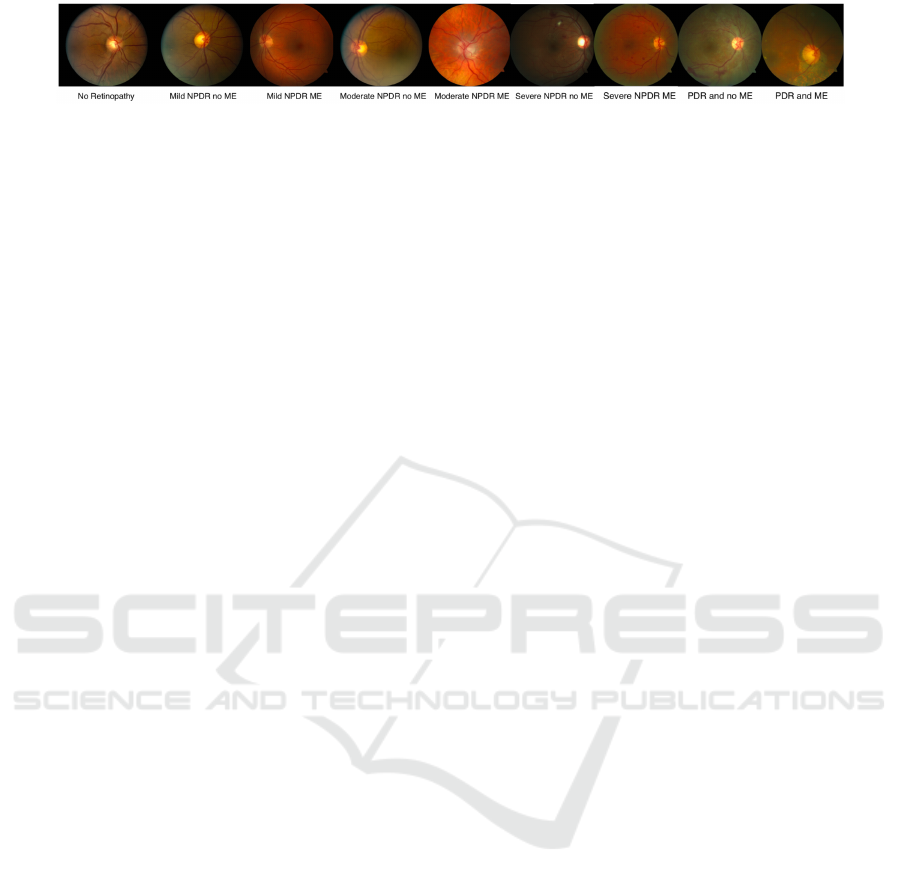
Figure 6: Illustration of the disease spectrum of DR with Fundus photos taken at different stages. NPDR represents Non-
proliferative Diabetic Retinopathy, ME represents Macular Edema, and PDR represents Proliferative Diabetic Retinopathy.
dataset, where domain in here is defined as the
imaging device. This important property reflects the
true nature of a real-world dataset, which includes a
mixture of data distributions from different domains.
Given that clinical care often involves complex multi-
domain data, I-ODA could provide a benchmark
for validation studies and improve generalizations
for translations of AI-based models across different
clinical settings.
Patient Population: I-ODA contains a rich collec-
tion of imaging data and metadata from a diverse set
of patients with various demographic backgrounds in-
cluding, ethnicity, race, age distribution, and location.
A cross-tabulation analysis of patient gender and age
from I-ODA is depicted in Fig. 5.
As Fig. 5 suggests, the patient population is
characterized by a comparable distribution between
females and males across a wide age range. This will
allow the development and validation of AI based
algorithms that are a true representation of the patient
population.
Longitudinal Disease Spectrum: The lack of dis-
ease severity levels that do not represent the wide
spectrum of patient diagnoses in real-world clinical
settings can carry a risk of spectrum bias. I-ODA con-
tains a comprehensive collection of imaging data be-
longing to patient visits from one academic institution
across multiple time points for various ophthalmic
diseases. Fig. 6 represents the severity spectrum of
Fundus photos taken at different stages of one of the
ophthalmic diseases, diabetic retinopathy (DR).
The longitudinal disease spectrum not only mit-
igates the risk of spectrum bias but also allows us
to study the progression trends across different oph-
thalmic diseases. Additionally, access to imaging data
for a broad range of ophthalmic diseases improves our
understanding of different diseases in correlation with
each other along with studying each disease in iso-
lation. Moreover, having both ophthalmic and non-
ophthalmic diagnoses in the I-ODA dataset, allows us
to study potential correlations among these diseases,
to identify common biological and epidemiological
mechanisms.
6.3 Application
To demonstrate the applicability and accuracy of
our dataset, we exploited different characteristics of
I-ODA to address various problems in ophthalmic
imaging application.
First, we employed I-ODA to formulate the prob-
lem of glaucoma detection into a multi-task frame-
work composed of prediction and segmentation mod-
ules with the goal of achieving interpretability and
alleviating shortage of segmented data (Mojab et al.,
2019). We showed that our proposed method outper-
forms the strongest baseline on cup segmentation task
by 2.6% by utilizing the availability of adequate data
from I-ODA for the prediction task.
In our second work, we utilized I-ODA dataset
to demonstrate the importance of real-world data
for generalizations to clinical settings (Mojab et al.,
2020). We formulated our problem into transfer
learning framework employing self-supervised learn-
ing for learning visual representations. We showed
the result of our work for the task of glaucoma de-
tection by training the model on real-world data and
evaluate it on a standardized data and vice versa. Our
experiment showed that without training with com-
plex multi-domain real-world data, the deep learning
models do not generalize well to clinical settings. We
also showed that by training our proposed method on
real-world data (I-ODA), we can achieve 16% rela-
tive improvement on a standardized dataset over su-
pervised baselines.
7 DISCUSSION
In this paper, we introduced a new ophthalmic imag-
ing dataset for AI applications in ophthalmology
with an infrastructure for collection, annotation, and
anonymization of the data. The proposed dataset con-
tains a diverse collection of image modalities belong-
ing to patients who received continuous care at the
Department of Ophthalmology and Visual Sciences at
the Illinois Eye and Ear Infirmary at UIC. I-ODA is a
longitudinal healthcare dataset that includes a large
variety of ophthalmic modalities, domains, and pa-
tients. These unique properties provide an ideal in-
I-ODA, Real-world Multi-modal Longitudinal Data for Ophthalmic Applications
573

frastructure for: (i) advancements in machine learn-
ing algorithms for multi-view and multi-domain oph-
thalmic applications, (ii) improvements in generaliz-
ability and translations into clinical settings, and (iii)
enhanced understanding of variations in ophthalmic
disease prognosis.
As a research databank with a unique infrastruc-
ture, I-ODA will continue to grow in imaging and pa-
tient metadata. While the limitations in annotations
are understandable, machine learning applications de-
veloped on data from I-ODA will allow new discov-
eries in computer vision, specifically in the medical
imaging field, and in new applications for classifi-
cation and progression of ophthalmic diseases. Ad-
ditionally, I-ODA can also serve with multiple ef-
forts in validating current algorithms that have shown
promise in more controlled datasets with less diverse
domains and patient population.
ACKNOWLEDGEMENT
This work is supported in part by NSF under grants
III-1763325, III-1909323, SaTC-1930941, BrightFo-
cus Foundation Grant M2019155, and Core Grant for
Vision Research (2P30 EY001792 41), Department
of Ophthalmology and Visual Sciences, University of
Illinois at Chicago.
REFERENCES
Almazroa, A., Alodhayb, S., Osman, E., Ramadan, E.,
Hummadi, M., Dlaim, M., Alkatee, M., Raahemi-
far, K., and Lakshminarayanan, V. (2018). Reti-
nal fundus images for glaucoma analysis: the riga
dataset. In Medical Imaging 2018: Imaging Informat-
ics for Healthcare, Research, and Applications, vol-
ume 10579, page 105790B. International Society for
Optics and Photonics.
Burlina, P. M., Joshi, N., Pacheco, K. D., Freund, D. E.,
Kong, J., and Bressler, N. M. (2018). Use of deep
learning for detailed severity characterization and es-
timation of 5-year risk among patients with age-
related macular degeneration. JAMA ophthalmology,
136(12):1359–1366.
Burlina, P. M., Joshi, N., Pekala, M., Pacheco, K. D., Fre-
und, D. E., and Bressler, N. M. (2017). Automated
grading of age-related macular degeneration from
color fundus images using deep convolutional neural
networks. JAMA ophthalmology, 135(11):1170–1176.
Decenci
`
ere, E., Zhang, X., Cazuguel, G., Lay, B., Coch-
ener, B., Trone, C., Gain, P., Ordonez, R., Massin, P.,
Erginay, A., et al. (2014). Feedback on a publicly dis-
tributed image database: the messidor database. Im-
age Analysis & Stereology, 33(3):231–234.
Fu, H., Cheng, J., Xu, Y., Zhang, C., Wong, D. W. K., Liu,
J., and Cao, X. (2018). Disc-aware ensemble network
for glaucoma screening from fundus image. IEEE
transactions on medical imaging, 37(11):2493–2501.
Fumero, F., Alay
´
on, S., Sanchez, J. L., Sigut, J., and
Gonzalez-Hernandez, M. (2011). Rim-one: An open
retinal image database for optic nerve evaluation.
In 2011 24th international symposium on computer-
based medical systems (CBMS), pages 1–6. IEEE.
Gargeya, R. and Leng, T. (2017). Automated identification
of diabetic retinopathy using deep learning. Ophthal-
mology, 124(7):962–969.
Grewal, P. S., Oloumi, F., Rubin, U., and Tennant, M. T.
(2018). Deep learning in ophthalmology: a review.
Canadian Journal of Ophthalmology, 53(4):309–313.
Gulshan, V., Peng, L., Coram, M., Stumpe, M. C., Wu,
D., Narayanaswamy, A., Venugopalan, S., Widner, K.,
Madams, T., Cuadros, J., et al. (2016). Development
and validation of a deep learning algorithm for de-
tection of diabetic retinopathy in retinal fundus pho-
tographs. Jama, 316(22):2402–2410.
Lu, W., Tong, Y., Yu, Y., Xing, Y., Chen, C., and Shen, Y.
(2018). Applications of artificial intelligence in oph-
thalmology: general overview. Journal of ophthalmol-
ogy, 2018.
Medeiros, F. A., Jammal, A. A., and Thompson, A. C.
(2019). From machine to machine: an oct-trained
deep learning algorithm for objective quantification of
glaucomatous damage in fundus photographs. Oph-
thalmology, 126(4):513–521.
Mojab, N., Noroozi, V., Yi, D., Nallabothula, M. P., Aleem,
A., Yu, P. S., and Hallak, J. A. (2020). Real-world
multi-domain data applications for generalizations to
clinical settings. arXiv preprint arXiv:2007.12672.
Mojab, N., Noroozi, V., Yu, P., and Hallak, J. (2019). Deep
multi-task learning for interpretable glaucoma detec-
tion. In 2019 IEEE 20th International Conference on
Information Reuse and Integration for Data Science
(IRI), pages 167–174. IEEE.
Schmidt-Erfurth, U., Sadeghipour, A., Gerendas, B. S.,
Waldstein, S. M., and Bogunovi
´
c, H. (2018). Artifi-
cial intelligence in retina. Progress in retinal and eye
research, 67:1–29.
Sivaswamy, J., Krishnadas, S., Joshi, G. D., Jain, M., and
Tabish, A. U. S. (2014). Drishti-gs: Retinal image
dataset for optic nerve head (onh) segmentation. In
2014 IEEE 11th international symposium on biomed-
ical imaging (ISBI), pages 53–56. IEEE.
Thompson, A. C., Jammal, A. A., and Medeiros, F. A.
(2019). A deep learning algorithm to quantify neu-
roretinal rim loss from optic disc photographs. Amer-
ican journal of ophthalmology, 201:9–18.
Ting, D. S. W., Pasquale, L. R., Peng, L., Campbell, J. P.,
Lee, A. Y., Raman, R., Tan, G. S. W., Schmetterer, L.,
Keane, P. A., and Wong, T. Y. (2019). Artificial intel-
ligence and deep learning in ophthalmology. British
Journal of Ophthalmology, 103(2):167–175.
Varadarajan, A. V., Poplin, R., Blumer, K., Angermueller,
C., Ledsam, J., Chopra, R., Keane, P. A., Corrado,
G. S., Peng, L., and Webster, D. R. (2018). Deep
learning for predicting refractive error from retinal
fundus images. Investigative ophthalmology & visual
science, 59(7):2861–2868.
HEALTHINF 2021 - 14th International Conference on Health Informatics
574
