
Automatic Segmentation of Mammary Tissue using Computer
Simulations of Breast Phantoms and Deep-learning Techniques
Lucca R. Peregrino
1
, Jordy V. Gomes
1
, Tha
´
ıs G. do R
ˆ
ego
1
, Yuri de A. M. Barbosa
1 a
,
Telmo de M. e Silva Filho
2 b
, Andrew D. A. Maidment
3
and Bruno Barufaldi
3,∗ c
1
Center of Informatics, Federal University of Para
´
ıba, Jo
˜
ao Pessoa, Brazil
2
Department of Statistics, Federal University of Para
´
ıba, Jo
˜
ao Pessoa, Brazil
3
Department of Radiology, University of Pennsylvania, 3640 Hamilton Walk, Philadelphia PA, U.S.A.
Keywords:
Phantoms, Tomosynthesis, Deep Learning, U-Net, Segmentation.
Abstract:
Digital breast tomosynthesis (DBT) has rapidly emerged for screening mammography to improve cancer de-
tection. Segmentation of dense tissue plays an important role in breast imaging applications to estimate cancer
risk. However, the current segmentation methods do not guarantee an ideal ground-truth in clinical practice.
Computer simulations provide ground-truth that enables the development of convolutional neural network
(CNN) applications designed for image segmentation. This study aims to train a CNN model to segment
dense tissue in DBT images simulated using anthropomorphic phantoms. The phantom images were simu-
lated based on clinical settings of a DBT system. A U-Net, a CNN model, was trained with 2,880 images using
a slice-wise approach. The U-Net performance was evaluated in terms of percent of density in the central slice
and volumetric breast density in the medio-lateral slices. Our results show that the U-Net can segment dense
tissue from DBT images with overall loss, accuracy, and intersection over union of 0.27, 0.93, and 0.62 in
the central slices, and 0.32, 0.92, and 0.54 in the medio-lateral slices, respectively. These preliminary results
allow us to explore the use of CNN architectures to segment dense tissue in clinical images, which is a highly
complex task in screening with DBT.
1 INTRODUCTION
Digital mammography (DM) and digital breast to-
mosynthesis (DBT) are considered the “gold stan-
dard” of care for breast cancer screening (Tice and
Feldman, 2008; Vedantham et al., 2015; Azar and El-
Said, 2013). These imaging modalities increase the
sensitivity in cancer detection and reduce the num-
ber of recall rates when compared to the traditional
screening with screen-film (Vedantham et al., 2015).
Complementary tools such as computer-aided di-
agnosis systems and convolution neural network
(CNN) applications can facilitate the early cancer lo-
cation by enhancing and detecting lesions (Cheng
et al., 2006; Azar and El-Said, 2013), which poten-
tially improve the diagnosis on mammography exams.
Anthropomorphic breast phantoms have been
widely used for research and development of mam-
a
https://orcid.org/0000-0002-7779-0288
b
https://orcid.org/0000-0003-0826-6885
c
https://orcid.org/0000-0003-3954-3611
mography imaging systems (Caldwell and Yaffe,
1990; Carton et al., 2011). These phantoms simulate
the mammary tissue accurately in terms of size, vol-
ume, and composition. Simulations of breast phan-
toms can be used as data augmentation to support
CNN architectures (Lashgari et al., 2020), assisting
the lack of data from specific populations (Barufaldi
et al., 2018a). In addition, these simulations provide
ground-truth images (i.e., ideal reference), which is
not provided in clinical practice (Tunc¸ay and Akdu-
man, 2014).
Manual or semi-automatic methods have been
developed to obtain ground-truth from images by
segmenting and thresholding different findings (Rui
et al., 2018; Chatfield et al., 2014; Valverde et al.,
2017). In medical imaging, these segmentation meth-
ods are commonly performed by experts in radi-
ology. Because of the subjectivity of inter-and/or
intra-readers, the output resulting from these meth-
ods may include variability and inaccuracy (Oliveira,
2017), while computer simulations provide the actual
ground-truth for the segmented image.
252
Peregrino, L., Gomes, J., G. do Rêgo, T., Barbosa, Y., Filho, T., Maidment, A. and Barufaldi, B.
Automatic Segmentation of Mammary Tissue using Computer Simulations of Breast Phantoms and Deep-learning Techniques.
DOI: 10.5220/0010310402520259
In Proceedings of the 14th International Joint Conference on Biomedical Engineering Systems and Technologies (BIOSTEC 2021) - Volume 4: BIOSIGNALS, pages 252-259
ISBN: 978-989-758-490-9
Copyright
c
2021 by SCITEPRESS – Science and Technology Publications, Lda. All rights reserved

The large variability of data with ground-truth
provided by computer simulations can improve the
performance of image segmentation with CNNs
(Hamarneh and Jassi, 2010; Li et al., 2009). The
ground-truth identifies each breast tissue, structures,
and findings to be used as labels for the input images
required in CNNs (Hamarneh and Jassi, 2010).
This study aims to develop a CNN model for
tissue segmentation using computer simulations of
breast phantoms. The CNN model is trained and
tested using an U-Net architecture (Ronneberger
et al., 2015). Projections are simulated using the ac-
quisition geometry of a clinical DBT system. DBT
phantom images are reconstructed using a customized
increment between reconstructed slices (0.1 mm).
The U-Net architecture is trained using a slice-wise
approach to segment glandular tissue from 2,880 DBT
reconstructed images.
2 BACKGROUND
2.1 Antropomorphic Breast Phantoms
Anthropomorphic breast phantoms have been widely
used to conduct in-silico trials (Bakic et al., 2018;
Maidment, 2014; Abadi et al., 2020). Breast char-
acteristics such as shape, size, volume, and tissue
composition should be accurately simulated in ac-
cordance with the human anatomy (Tunc¸ay and Ak-
duman, 2014). In addition, breast anatomical fea-
tures (e.g., glandular segments, Cooper’s ligaments
and blood vessels) should be realistically simulated
(Elangovan et al., 2017).
To ensure that images simulated using anthropo-
morphic breast phantoms are comparable to clinical
mammograms, validation methods that rely on hu-
man visual inspection and/or computer analyses are
required. For example, Elangovan et al. (2017)
propose a method that can rapidly produce a mul-
tiplicity of different breast appearance models using
4-alternative forced choice (4-AFC). Using 4-AFCs,
they have shown that simulated and real images were
statistically indistinguishable by expert breast read-
ers.
However, the recruitment of breast experts needed
to validate anthropomorphic phantoms can be a chal-
lenging task, and in-silico trials have been designed
as attempt to simulate human readings. Badano et
al. (2018) and Bakic et al. have reproduced read-
ing interpretations reported on large scale clinical tri-
als designed for pre-market approval of novel imaging
technologies (Badano et al., 2018; Bakic et al., 2018).
These previous publications reported a successful use
of mathematical models to simulate virtual readers
and design virtual anthropomorphic phantoms.
In breast imaging, computer simulations usually
require the use of breast phantoms (Bakic et al., 2018;
Maidment, 2014; Abadi et al., 2020). In this study,
computer simulations of breast phantoms were used
to design a novel CNN application for image segmen-
tation using an U-Net architecture.
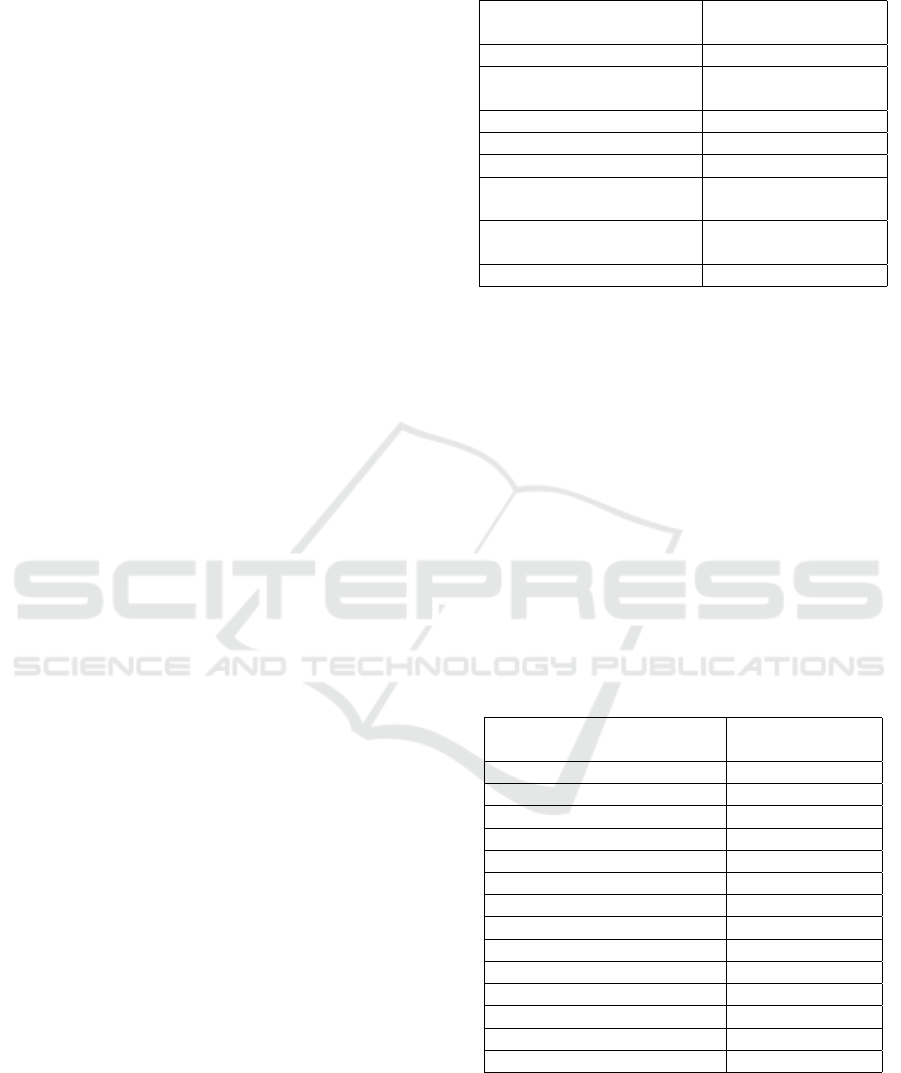
2.2 U-Net Architecture
CNNs are often used for image classification and seg-
mentation (Rui et al., 2018; Chatfield et al., 2014;
Valverde et al., 2017). The U-Net architecture is
a CNN that was developed for biomedical image
segmentation (Ronneberger et al., 2015). The ul-
timate goal of the U-Net architecture (Figure 1)
is the segmentation and localization of desired ob-
jects/structures highlighted in the input images (Paul,
2018). The major benefit of the U-Net is that there
is no need to use a large number of images for train-
ing and testing (Ronneberger et al., 2015). Thus, U-
Net can be useful for segmentation of medical images,
due to the fact that the segmented ground-truth is not
available in clinical practice. Besides that, U-Net uses
a reduced amount of training parameters compared to
other CNN’s, such as SegNet (Badrinarayanan et al.,
2017).
The U-Net architecture consists of contraction
(encoder) and expansion (decoder) paths. A set of two
convolutions (3×3 kernel) and one maxpooling (2×2
kernel) with ReLU activation are performed in each
encoder layer. Similarly, each decoder layer starts
with an upsampling and a 2×2 convolution, followed
by two 3×3 convolutions with ReLU activation. The
encoder provides filtered information (feature maps)
acquired during the contraction path to be interpreted
by the decoder. The decoder concatenates the out-
put of transposed convolution layers with the feature
maps acquired from the encoder at each layer. Finally,
an activation function is used to predict classes of the
input images based on previous knowledge (training
phase) obtained from ground-truth images (Academy,
2019).
The U-Net architecture has been used in sev-
eral medical applications (Norman et al., 2018; Sev-
astopolsky, 2017). For example, Tong et al. (2018)
developed an improved U-Net architecture to segment
pulmonary nodules from CT images. The authors
concluded that the accuracy of nodule segmentation
is comparable or superior to the manual segmentation.
A different U-Net application, developed by Norman
et al. (2018), has shown an improved segmentation of
cartilage and meniscus from knees using clinical MRI
Automatic Segmentation of Mammary Tissue using Computer Simulations of Breast Phantoms and Deep-learning Techniques
253
images. Similarly, the precision of the automatic seg-
mentation demonstrated to be comparable to the man-
ual segmentation of experts.
In breast imaging, Zhang et al. (2020) developed a
transfer learning application that uses U-Net and Seg-
Net architectures to segment whole-breasts from MRI
scans. The authors modified and adapted both archi-
tectures using slice-wise approaches and obtained av-
erage dice coefficient results of 0.87 (independent test
data set). Although the authors presented compelling
results, they emphasized that recruiting experts was
challenging because of the limited and expensive time
from radiologists to manually segment breasts from
MRI scans. In addition, the authors could not obtain
the manual segmentation (ground-truth) of the entire
image dataset.
Several software have been developed to segment
breast glandular tissue and estimate volumetric breast
density or breast dense area, such as Volpara et al.
(2014) and LIBRA et al. (2012). These software
use image processing techniques (e.g., edge detection,
support-vector machine, etc.) to segment breast tissue
in clinical images, unlike the methods proposed in the
current study.
Our proposed method is based on computer sim-
ulations that do not require manual segmentation of
breast tissue.
3 MATERIALS AND METHODS
3.1 Computer Simulations
The OpenVCT framework (Barufaldi et al., 2018b)
was used to simulate anthropomorphic breast phan-
toms (Zhang et al., 2008; Pokrajac et al., 2012). The
breast phantoms are composed by voxel-materials (la-
bels) that represent various tissue types and air (Bar-
ufaldi et al., 2018a). The tissue types are simulated
using an octree-based recursive partitioning method
(Pokrajac et al., 2012). In this method, seed points
are randomly selected within the phantom interior and
used to simulate glandular and adipose tissue bounded
by fibrous Cooper’s ligaments (Figure 2). These tis-
sue types are simulated to mimic the breast anatomy.
We combined and simulated all phantom param-
eters described in Table 1 (n=96). These param-
eters were selected based on previous publications
(Bakic et al., 2018; Barufaldi et al., 2019). Fi-
nally, a breast tissue compression was simulated using
a GPU-accelerated mesh software (Barufaldi et al.,
2018a). The compression was performed using a
medio-lateral (ML) view.
Table 1: Summary of the breast phantom parameters.
Anthropomorphic
Breast Phantoms
Parameters
Number of Phantoms (#) 96
Distribution of dense
compartments (%)
{1.0; 15.0;
25.0; 50.0}
Breast volume (mL) 700
Breast thickness (mm) 63.3
Voxel size (mm) {0.1; 0.2}
Number of
compartments (#)
{425; 850;
1275; 1700}
Compartment shape
{(0.1; 1.0; 1.0; 2.0),
(0.01; 1.0; 1.0; 4.0)}
Ligament thickness (mm) [0.1;0.18]
The 3D breast phantoms were “sliced” through
the entire volume in the sagittal orientation (Figure
2, left). In total, 633 2D slices (784×2053 pixels)
were acquired per phantom (ML view). The phan-
tom slices contain label maps at each 0.1 mm thick
of compressed breast (Figure 2, right). Each label
represents a different x-ray mass attenuation (Hubbell
and Seltzer, 1995) used to simulate DBT projections
(Feng and Sechopoulos, 2012). For each phantom, a
set of 15 x-ray projections was simulated using the
acquisition geometry of a clinical DBT system (Ta-
ble 2). The x-ray projections were simulated using a
GPU-enabled x-ray tracing algorithm (Siddon, 1985).
The exposure acquisition settings follow the auto-
matic exposure control from the DBT system (Feng
and Sechopoulos, 2012).
Table 2: Summary of the DBT acquisition parameters.
DBT System (model)
Selenia
Dimensions
X-Ray Imaging
Anode Material Tungsten
Filter Material Aluminum
Filter Thickness (mm) 0.7
Angular Range (
◦
) [±7.5,±15,±25]
Number of Projections (#) 15
Tube Motion Continuous
Detector
Detection Material a-Se
Detector Element Size(mm) 0.140 × 0.140
Number of Elements (#) 2048 × 1664
Detector Size (mm) 286.72 × 232.96
Source-Image Dis.(mm) 700.0
Rec. Voxel Size (mm) 0.1
A commercial reconstruction software (Briona
Std., Real-Time Tomography, Vilanova PA) was used
to reconstruct and to process each set of DBT pro-
jections (Chui et al., 2012). This software allows us
to reconstruct DBT images using customized recon-
struction voxel size. In this study, the DBT images
BIOSIGNALS 2021 - 14th International Conference on Bio-inspired Systems and Signal Processing
254
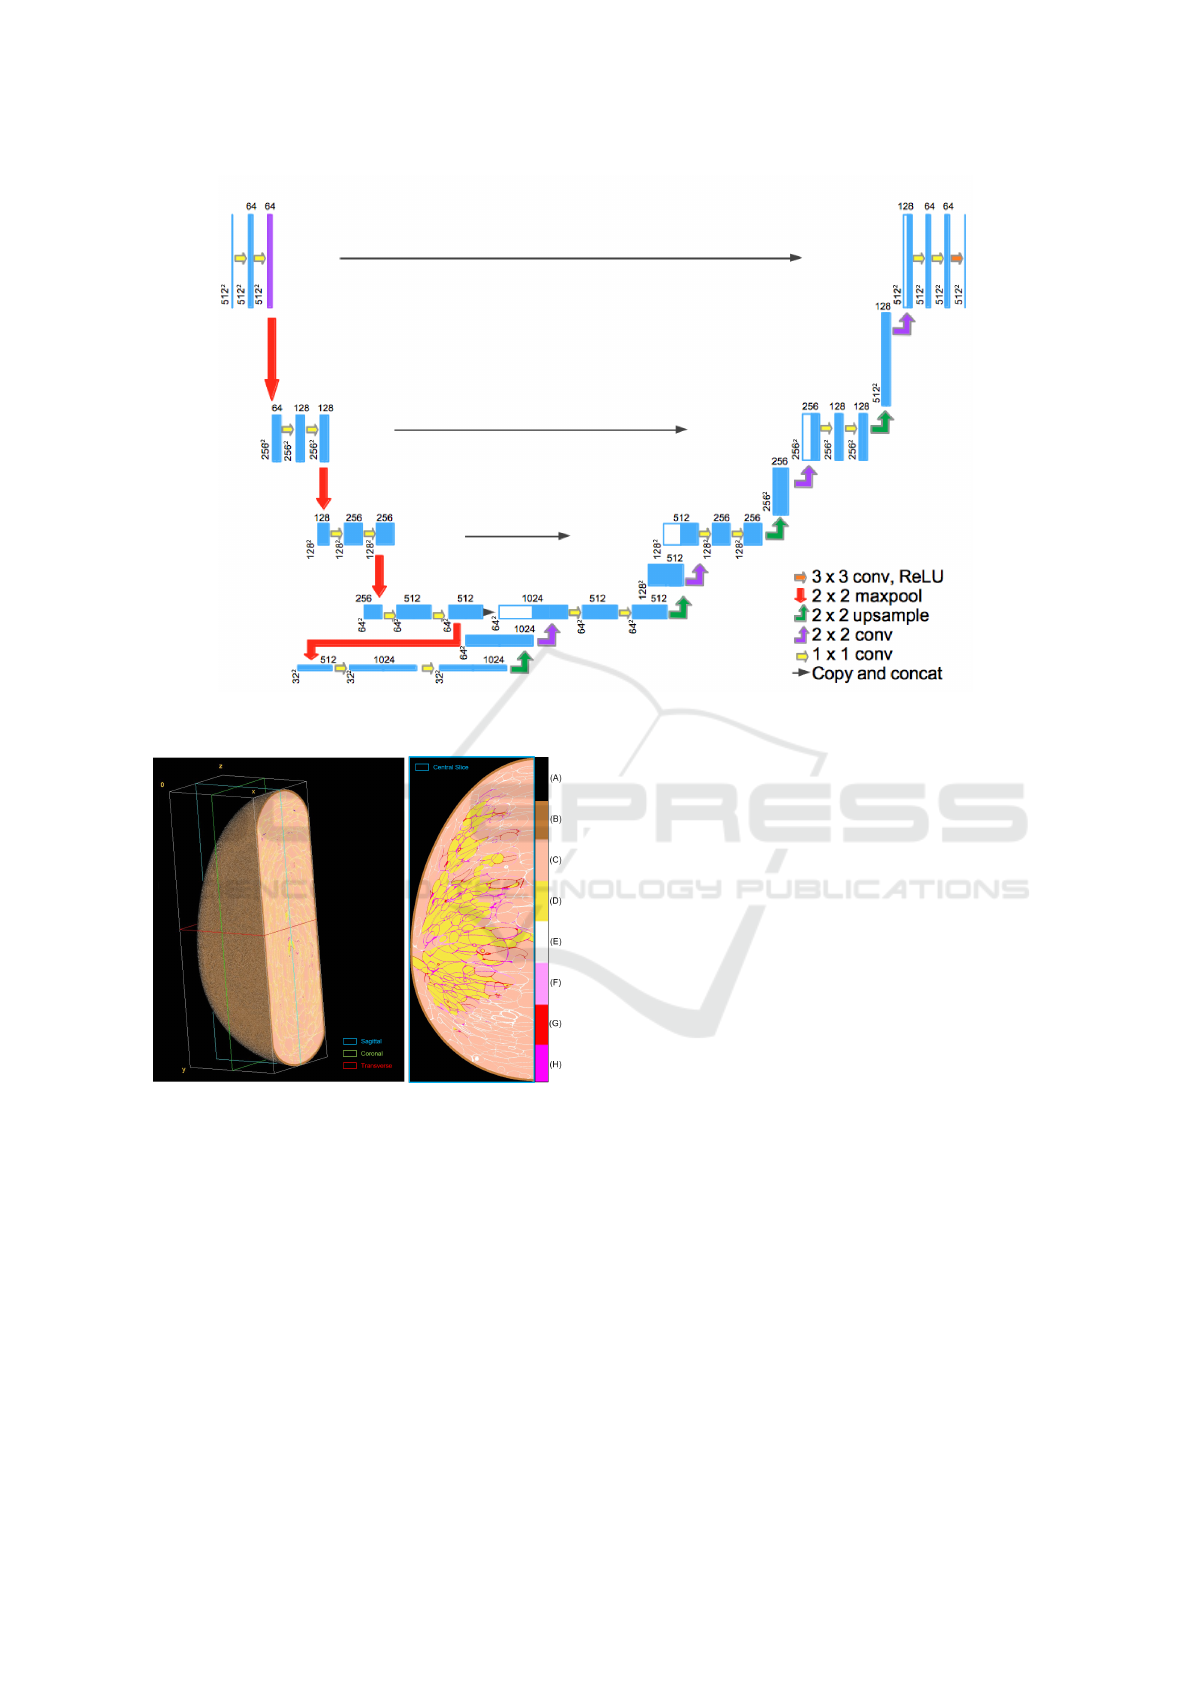
Figure 1: U-Net architecture used in this study. This architecture shows the ”u” structure resulting from the encoder and
decoder paths.
Figure 2: (Left) Volume view of compressed anthropomor-
phic breast phantom and (right) central slice (ML breast
view). The colormap represents the labels used to iden-
tify each voxel-material: (A) air, (B) skin, (C) adipose, (D)
glandular, (E-H) Cooper’s ligaments.
were reconstructed using 0.1 mm increments in depth.
In total, 633 reconstructed DBT images (1664×2048
pixels) were acquired per phantom.
3.2 Pre-processing Images
The reconstructed DBT images and correspondent la-
bel maps (ground-truth) were used as input for the
training and test stages of the U-Net architecture.
However, differences between the dimensions of the
input images will result in an ineffective CNN model.
Pre-processing techniques were required to match the
ground-truth to the respective reconstructed DBT im-
age.
The acquisition geometry (Table 2) was used to lo-
cate each label on the ground-truth and the respective
pixel value in the DBT image. Next, a cropping op-
eration was applied to each DBT image to eliminate
excessive background information from the DBT im-
ages (Figure 3, left and middle). Finally, the glandular
tissue label was thresholded and segmented from the
ground-truth to obtain binary masks used for training
the CNN model (Figure 3, right). After these pre-
processing steps, the reconstructed DBT image, label
map, and binary mask are matched (778×2,036 pix-
els). Finally, both input images, DBT reconstructed
image and binary mask, were normalized using the
maximum value in bits (2
14
and 2
8
, respectively), re-
sulting in images with pixel values in a [0, 1] interval.
The input images were resized to 512×512 pixels to
optimize the CNN model and reduce computational
burden.
3.3 Training the Model
To train the segmentation model, we modified the
original U-Net parameters (Zhixuhao, 2016; Ron-
neberger et al., 2015) using the programming lan-
guage Python. The optimization of the U-Net param-
eters, as well as training and testing were performed
Automatic Segmentation of Mammary Tissue using Computer Simulations of Breast Phantoms and Deep-learning Techniques
255
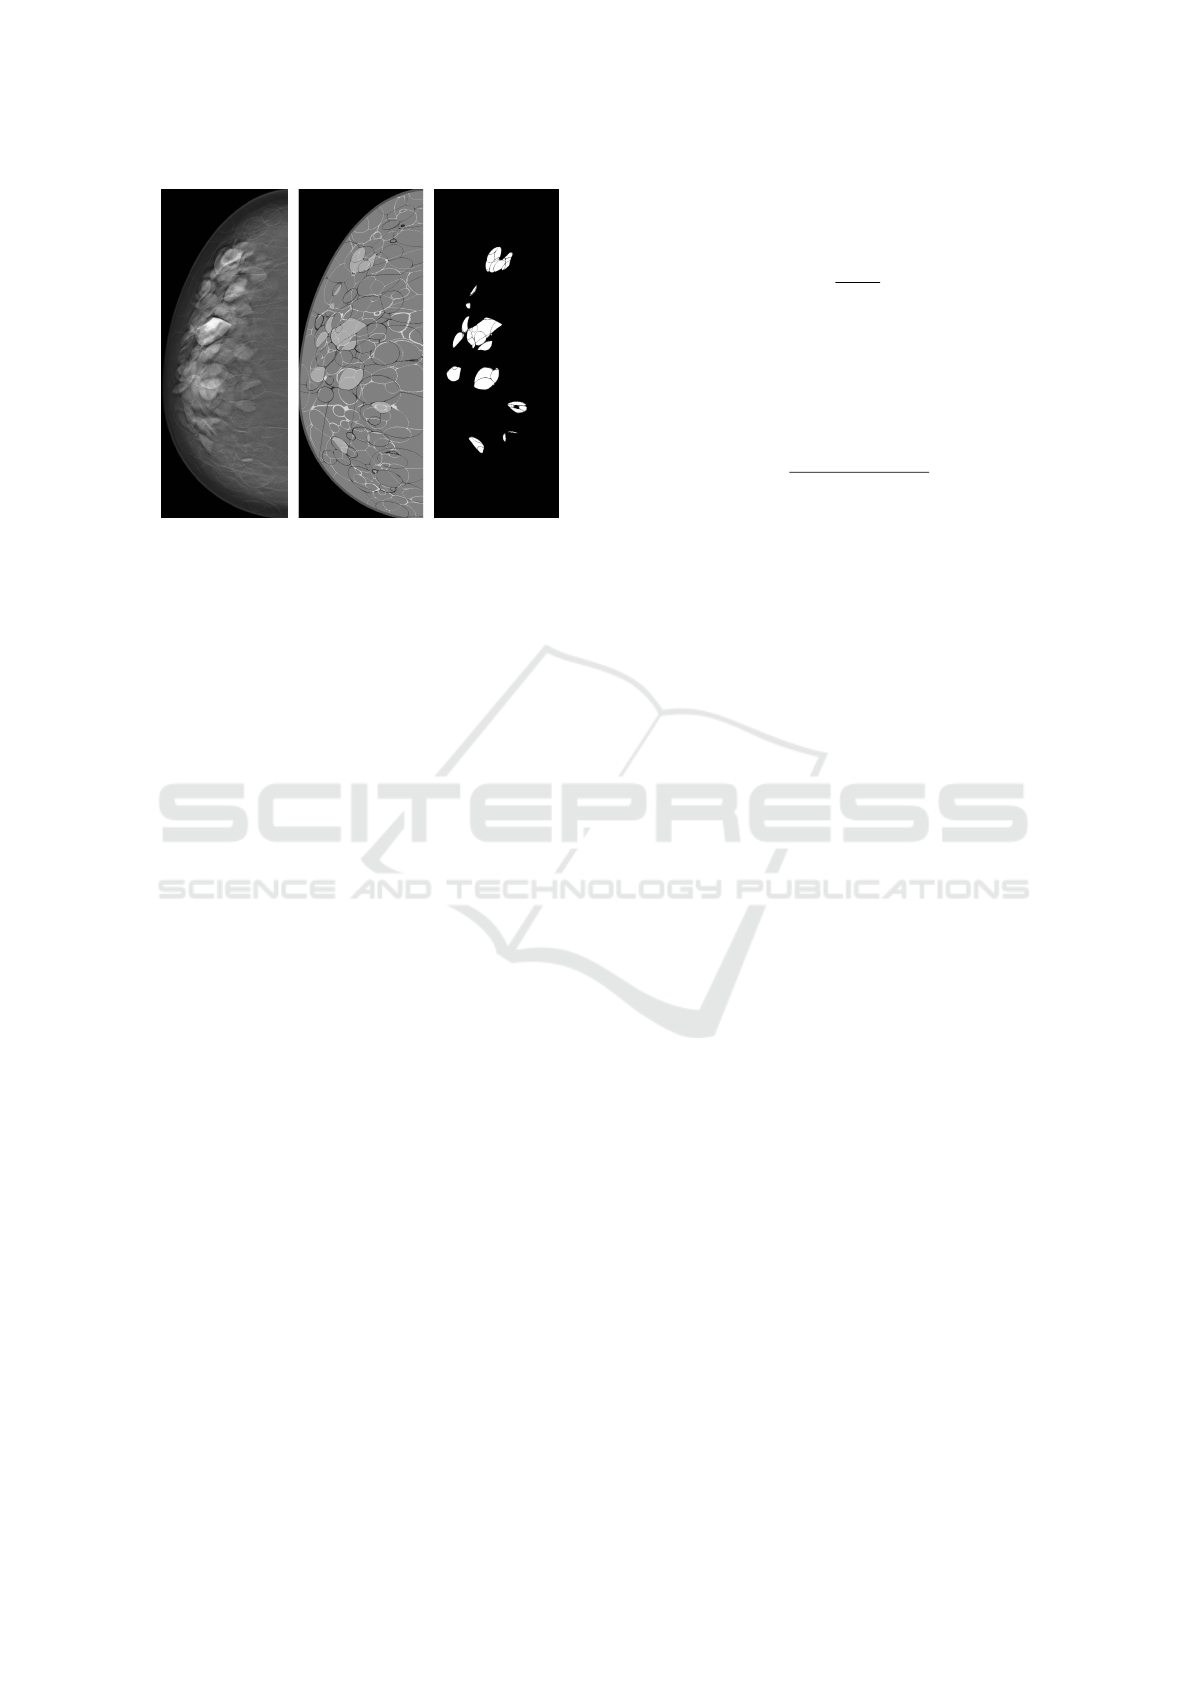
Figure 3: (Left) central slice of reconstructed DBT image,
(middle) label map, and (right) binary mask after matching
and cropping operations.
using a workstation equipped with Intel(R) Xeon(R)
CPU, 16GB RAM, and single graphics card NVIDIA
Quadro P5000.
In total, 45 pairs of images (reconstructed
DBT image and mask) acquired from 64 phantoms
(n=2,880 pairs) were used to train the U-Net model.
The image pairs were selected using 45 pairs of phan-
tom central slices, which contain regions with the
most amount of glandular tissue.
Our U-Net model (Figure 1) was trained using 120
epochs, batch size 4, and image size 512×512. The
weights of the training model were updated after each
iteration (n=720). These parameters were selected
and constrained based on memory used to train the
architecture models. The number of epochs was op-
timized based on loss and accuracy. It is important
to mention that the training models are saved every
epoch. The training model did not improve signifi-
cantly after 120 epoch.
3.4 Evaluation Metrics
The binary crossentropy, accuracy, and intersection
over union were used to evaluate the performance of
the segmentation models. These metrics are defined
as:
Binary Crossentropy (Loss) is a loss function
that calculates the difference between predicted labels
( ˆy) and true labels (y). The loss is computed following
Equation (1):
Loss(y, ˆy) = −(y · log(ˆy) + (1 − y) · log(1 − ˆy)) (1)
Accuracy (Acc) is a metric commonly used for
predictive models, calculating the proportion of cor-
rect predictions (CP) over the total instances. In our
approach, each pixel is an instance (Total). The for-
malism of accuracy is defined in accordance with
Equation (2):
Acc =
CP
Total
(2)
Intersection over Union (IoU) is a metric that
computes the segmented area ( ˆy) that corresponds to
the area of the mask (y), dividing what is in common
between them (intersection) by the whole (union).
Equation (3) shows the IoU calculation:
IoU =
area(ˆy)∩ area(y)
area(ˆy)∪ area(y)
(3)
Pearson’s correlation coefficient (ρ) was calcu-
lated to evaluate the linear correlation between the
evaluated metrics and the percentage of glandular tis-
sue (PD%) in the phantom images. PD% is calculated
by using the ratio of glandular labels and non-air la-
bels (e.g., Figure 2).
The observed values were categorized by slice po-
sition through the phantom volume and volumetric
breast density (VBD).
4 EXPERIMENTAL ANALYSES
Two experiments were performed to test our segmen-
tation model. For both experiments, we used 32
unique breast phantoms. For each experiment, we
varied the slice location as input images. Similarly to
the training stage, only the central slice images were
used as input for the first experiment. For the sec-
ond experiment, the entire phantom volume divided in
slices was used as input images. The phantom slices
and DBT reconstructed images close to the phantom
skin (about 1 cm in each extremity) were excluded
from the experimental analyses due to the lack of
glandular tissue for segmentation.
4.1 Using Central Slices
The experiment using only the central slices resulted
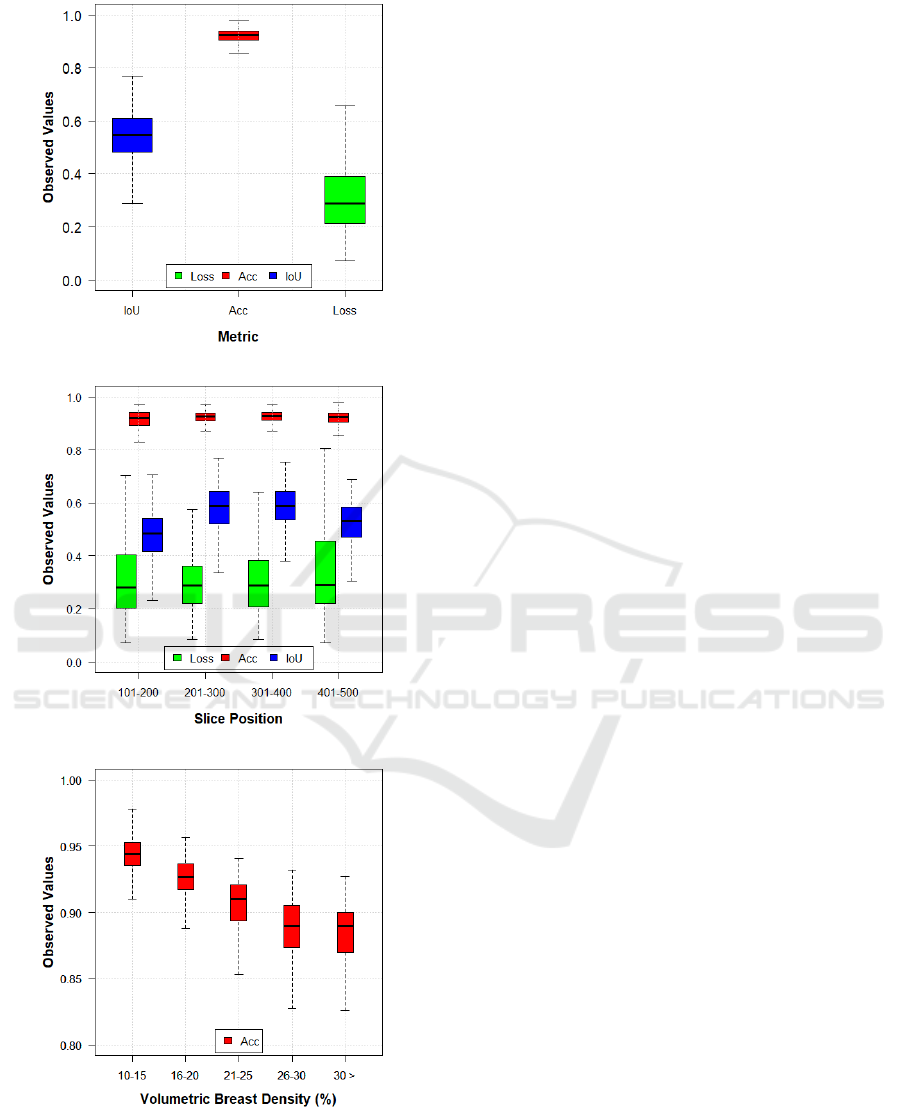
in a mean Loss, Acc and IoU of 0.27, 0.93, and 0.62,
respectively. Figures 4-6 show three examples from
our model segmentation using input images that con-
tain regions with different amounts of glandular tissue
(i.e., PD%). Note that the accuracy of the U-Net seg-
mentation varies with PD%.
The correlations between PD% and Loss, Acc,
and IoU were ρ=0.77, ρ=-0.85, and ρ=0.60, respec-
tively. This correlation analysis shows moderate
to high positive correlation between PD%, IoU and
Loss, and high negative correlation with Acc. That
BIOSIGNALS 2021 - 14th International Conference on Bio-inspired Systems and Signal Processing
256
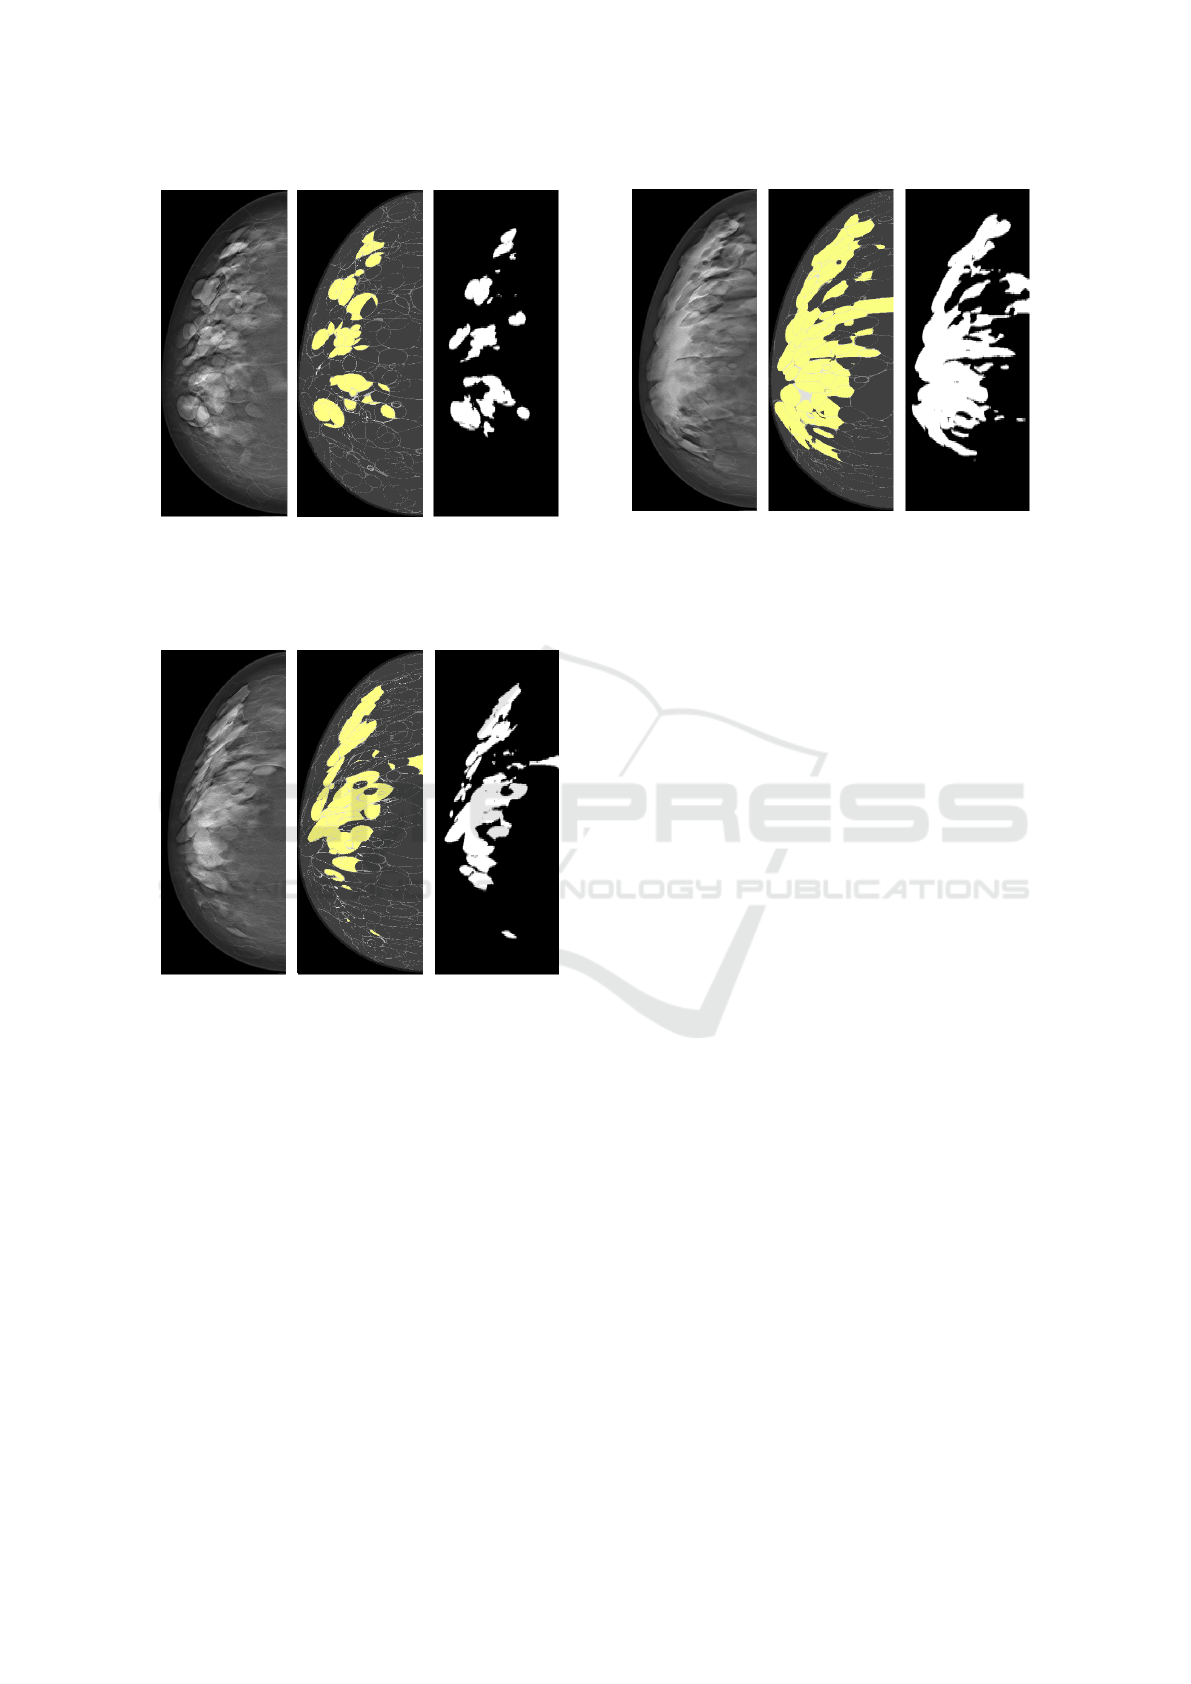
Figure 4: (Left) central slice of reconstructed DBT image,
(middle) label map with glandular tissue highlighted in yel-
low (PD%=12%), and (right) binary segmentation. The seg-
mentation metrics for this input image were 0.18, 0.95, and
0.56 for Loss, Acc, and IoU, respectively.
Figure 5: (Left) central slice of reconstructed DBT image,
(middle) label map with glandular tissue highlighted in yel-
low (PD%=20%), and (right) binary segmentation. The seg-
mentation metrics for this input image were 0.19, 0.94, and
0.63 for Loss, Acc, and IoU, respectively.
said, these preliminary results indicate that the accu-
racy of the U-Net segmentation reduces significantly
with PD% (p-value<0.001).
4.2 Using Medio-lateral Slices
We also evaluated the U-Net segmentation using all
phantom slices that contain glandular labels (ML
slices). In total, over 480 ML slices per phantom were
selected for this experiment. The U-Net segmentation
resulted in overall performance with mean Loss, Acc,
and IoU of 0.32, 0.92, and 0.54, respectively (Fig-
ure 7a). Note that there was a slight reduction in the
Acc and IoU metrics compared to the previous exper-
iment.
Figure 6: (Left) central slice of reconstructed DBT image,
(middle) label map with glandular tissue highlighted in yel-
low (PD%=34%), and (right) binary segmentation. The seg-
mentation metrics for this input image were 0.31, 0.91, and
0.70 for Loss, Acc, and IoU, respectively.
Figure 7b shows the results of the metrics catego-
rized by slice position through the entire phantom vol-
ume. The slice position also affects the U-Net perfor-
mance, since our CNN was trained using only central
slices. The relative difference in IoU between slice
positions can reach up to 20%. These differences can
also be seen in the Loss. However, these are prelimi-
nary results and a more detailed statistical analysis is
required to evaluate the U-Net performance in depth.
Finally, Figure 7c shows the Acc results catego-
rized by VBD. These boxplots show changes in U-
Net performance throughout the glandular volume of
breast phantoms. Note that the overall U-Net per-
formance tends to reduce with denser phantoms (i.e.,
higher VBD). Again, these are preliminary results and
a more detailed statistical analysis is required to sup-
port this observation.
5 CONCLUSIONS
These preliminary results show that our U-Net im-
plementation can segment glandular tissue from DBT
images with high accuracy. The computer simulations
are supervised, thus a known ground-truth is available
as input images for the U-Net training. Although our
results were based on simulations, our U-Net imple-
mentation can be potentially extended to clinical ap-
plications if a reasonable ground-truth data set is pro-
vided.
This U-Net application allows us to evaluate the
impact of 2D breast parameters (PD%) using particu-
lar slices and 3D breast parameters (VBD) using sets
of slices as input images. For future work, we will
provide a more complete statistical analysis of our
Automatic Segmentation of Mammary Tissue using Computer Simulations of Breast Phantoms and Deep-learning Techniques
257
(a)
(b)
(c)
Figure 7: Boxplots of metrics evaluated using reconstructed
slices obtained from 10.1-50.0 mm of phantom thickness
(0.1 mm increment). (a) Observed values categorized by
metrics, (b) as a function of slice position, and (c) as a func-
tion of VBD. Note that there is a difference in y-scale in (c),
compared to (a) and (b).
dataset and further explore the use of 3D CNNs for
volume segmentation.
ACKNOWLEDGEMENTS
Funding for the research is provided by the following
grants: BWF IRSA 1016451, DoD W81XWH-18-1-
0082, and AAPM 2020 Research Seed Grant.
REFERENCES
Abadi, E., Segars, W. P., Tsui, B. M., Kinahan, P. E.,
Bottenus, N., Frangi, A. F., Maidment, A., Lo, J.,
and Samei, E. (2020). Virtual clinical trials in med-
ical imaging: a review. Journal of Medical Imaging,
7(4):042805.
Academy, D. S. (2019). Deep learning book.
Azar, A. T. and El-Said, S. A. (2013). Probabilistic neural
network for breast cancer classification. Neural Com-
puting and Applications, 23(6):1737–1751.
Badano, A., Graff, C. G., Badal, A., Sharma, D., Zeng,
R., Samuelson, F. W., Glick, S. J., and Myers, K. J.
(2018). Evaluation of digital breast tomosynthesis
as replacement of full-field digital mammography us-
ing an in silico imaging trial. JAMA network open,
1(7):e185474–e185474.
Badrinarayanan, V., Kendall, A., and Cipolla, R. (2017).
Segnet: A deep convolutional encoder-decoder ar-
chitecture for image segmentation. IEEE transac-
tions on pattern analysis and machine intelligence,
39(12):2481–2495.
Bakic, P. R., Barufaldi, B., Higginbotham, D., Weinstein,
S. P., Avanaki, A. N., Espig, K. S., Xthona, A., Kimpe,
T. R. L., and Maidment, A. D. A. (2018). Virtual
clinical trial of lesion detection in digital mammog-
raphy and digital breast tomosynthesis. In Lo, J. Y.,
Schmidt, T. G., and Chen, G.-H., editors, Medical
Imaging 2018: Physics of Medical Imaging, volume
10573, pages 30 – 42. International Society for Optics
and Photonics, SPIE.
Barufaldi, B., Bakic, P., and Maidment, A. (2019).
Multiple-reader, multiple-case ROC analysis for de-
termining the limit of calcification detection in to-
mosynthesis . In Schmidt, T. G., Chen, G.-H., and
Bosmans, H., editors, Medical Imaging 2019: Physics
of Medical Imaging, volume 10948, pages 157 – 163.
International Society for Optics and Photonics, SPIE.
Barufaldi, B., Bakic, P. R., Pokrajac, D. D., Lago, M. A.,
and Maidment, A. D. (2018a). Developing popula-
tions of software breast phantoms for virtual clinical
trials. In 14th International Workshop on Breast Imag-
ing (IWBI 2018), volume 10718, page 107181U. Inter-
national Society for Optics and Photonics.
Barufaldi, B., Higginbotham, D., Bakic, P. R., and Maid-
ment, A. D. A. (2018b). OpenVCT: a GPU-
accelerated virtual clinical trial pipeline for mammog-
raphy and digital breast tomosynthesis. In Lo, J. Y.,
BIOSIGNALS 2021 - 14th International Conference on Bio-inspired Systems and Signal Processing
258

Schmidt, T. G., and Chen, G.-H., editors, Medical
Imaging 2018: Physics of Medical Imaging, volume
10573, pages 1333 – 1340. International Society for
Optics and Photonics, SPIE.
Caldwell, C. B. and Yaffe, M. J. (1990). Development of an
anthropomorphic breast phantom. Medical physics,
17(2):273–280.
Carton, A.-K., Bakic, P., Ullberg, C., Derand, H., and Maid-
ment, A. D. (2011). Development of a physical 3d
anthropomorphic breast phantom. Medical physics,
38(2):891–896.
Chatfield, K., Simonyan, K., Vedaldi, A., and Zisserman,
A. (2014). Return of the devil in the details: Delving
deep into convolutional nets. CoRR, abs/1405.3531.
Cheng, H.-D., Shi, X., Min, R., Hu, L., Cai, X., and Du, H.
(2006). Approaches for automated detection and clas-
sification of masses in mammograms. Pattern recog-
nition, 39(4):646–668.
Chui, J. H., Pokrajac, D. D., Maidment, A. D. A., and Ba-
kic, P. R. (2012). Roadmap for efficient paralleliza-
tion of breast anatomy simulation. In Pelc, N. J.,
Nishikawa, R. M., and Whiting, B. R., editors, Med-
ical Imaging 2012: Physics of Medical Imaging, vol-
ume 8313, pages 1369 – 1378. International Society
for Optics and Photonics, SPIE.
Elangovan, P., Mackenzie, A., Dance, D. R., Young, K. C.,
Cooke, V., Wilkinson, L., Given-Wilson, R. M., Wal-
lis, M. G., and Wells, K. (2017). Design and validation
of realistic breast models for use in multiple alterna-
tive forced choice virtual clinical trials. Physics in
Medicine & Biology, 62(7):2778.
Feng, S. S. J. and Sechopoulos, I. (2012). Clinical digital
breast tomosynthesis system: dosimetric characteriza-
tion. Radiology, 263(1):35–42.
Hamarneh, G. and Jassi, P. (2010). Vascusynth: Simu-
lating vascular trees for generating volumetric image
data with ground-truth segmentation and tree anal-
ysis. Computerized medical imaging and graphics,
34(8):605–616.
Hubbell, J. H. and Seltzer, S. M. (1995). Tables of x-
ray mass attenuation coefficients and mass energy-
absorption coefficients 1 kev to 20 mev for elements
z= 1 to 92 and 48 additional substances of dosimetric
interest. Technical report, National Inst. of Standards
and Technology-PL, Gaithersburg, MD (United . . . .
Lashgari, E., Liang, D., and Maoz, U. (2020). Data aug-
mentation for deep-learning-based electroencephalog-
raphy. Journal of Neuroscience Methods, page
108885.
Li, C. M., Segars, W. P., Tourassi, G. D., Boone, J. M., and
Dobbins III, J. T. (2009). Methodology for generat-
ing a 3d computerized breast phantom from empirical
data. Medical physics, 36(7):3122–3131.
Maidment, A. D. (2014). Virtual clinical trials for the as-
sessment of novel breast screening modalities. In
International Workshop on Digital Mammography,
pages 1–8. Springer.
Norman, B., Pedoia, V., and Majumdar, S. (2018). Use of
2d u-net convolutional neural networks for automated
cartilage and meniscus segmentation of knee mr imag-
ing data to determine relaxometry and morphometry.
Radiology, 288(1):177–185.
Oliveira, W. d. S. (2017). Consenso de segmentac¸
˜
oes de
imagens usando classificac¸
˜
ao de padr
˜
oes. PhD thesis,
Universidade Federal de Pernambuco.
Paul, S. (2018). Learn how to train u-net on your
dataset. https://medium.com/coinmonks/learn-how-
to-train-u-net-on-your-dataset-8e3f89fbd623.
Pokrajac, D. D., Maidment, A. D., and Bakic, P. R. (2012).
Optimized generation of high resolution breast an-
thropomorphic software phantoms. Medical physics,
39(4):2290–2302.
Ronneberger, O., Fischer, P., and Brox, T. (2015). U-net:
Convolutional networks for biomedical image seg-
mentation. In International Conference on Medical
image computing and computer-assisted intervention,
pages 234–241. Springer.
Rui, T., Zou, J., Zhou, Y., Fei, J., and Yang, C. (2018).
Convolutional neural network feature maps selection
based on lda. Multimedia Tools and Applications,
77(9):10635–10649.
Sevastopolsky, A. (2017). Optic disc and cup segmentation
methods for glaucoma detection with modification of
u-net convolutional neural network. Pattern Recogni-
tion and Image Analysis, 27(3):618–624.
Siddon, R. L. (1985). Fast calculation of the exact radio-
logical path for a three-dimensional ct array. Medical
physics, 12(2):252–255.
Tice, J. and Feldman, M. (2008). Full-field digital mam-
mography compared with screen-film mammography
in the detection of breast cancer: Rays of light through
dmist or more fog? Breast cancer research and treat-
ment, 107:157–65.
Tunc¸ay, A. H. and Akduman, I. (2014). Realistic microwave
breast models through t1-weighted 3-d mri data. IEEE
Transactions on Biomedical Engineering, 62(2):688–
698.
Valverde, S., Cabezas, M., Roura, E., Gonz
´
alez-Vill
`
a,
S., Pareto, D., Vilanova, J. C., Rami
´
o-Torrent
`
a, L.,
Rovira, A., Oliver, A., and Llad
´
o, X. (2017). Improv-
ing automated multiple sclerosis lesion segmentation
with a cascaded 3d convolutional neural network ap-
proach. CoRR, abs/1702.04869.
Vedantham, S., Karellas, A., Vijayaraghavan, G. R., and
Kopans, D. B. (2015). Digital breast tomosynthesis:
State of the art. Radiology, 277(3):663–684. PMID:
26599926.
Zhang, C., Bakic, P., and Maidment, A. (2008). Develop-
ment of an anthropomorphic breast software phantom
based on region growing algorithm - art. no. 69180v.
Proc SPIE, 6918.
Zhixuhao (2016). Implementation of deep
learning framework – unet, using keras.
https://github.com/zhixuhao/unet.
Automatic Segmentation of Mammary Tissue using Computer Simulations of Breast Phantoms and Deep-learning Techniques
259
