
Exploring Motion Boundaries in an End-to-End Network for
Vision-based Parkinson’s Severity Assessment
Amirhossein Dadashzadeh
1
, Alan Whone
2,3
, Michal Rolinski
2,3
and Majid Mirmehdi
1
1
Department of Computer Science, University of Bristol, Bristol, U.K.
2
Department of Neurology, Southmead Hospital, Bristol, U.K.
3
Translational Health Sciences, University of Bristol, Bristol, U.K.
Keywords:
Parkinsons, Temporal Motion Boundaries, Quality of Motion Assessment, Deep Learning.
Abstract:
Evaluating neurological disorders such as Parkinsons disease (PD) is a challenging task that requires the as-
sessment of several motor and non-motor functions. In this paper, we present an end-to-end deep learning
framework to measure PD severity in two important components, hand movement and gait, of the Unified
Parkinsons Disease Rating Scale (UPDRS). Our method leverages on an Inflated 3D CNN trained by a tempo-
ral segment framework to learn spatial and long temporal structure in video data. We also deploy a temporal
attention mechanism to boost the performance of our model. Further, motion boundaries are explored as an
extra input modality to assist in obfuscating the effects of camera motion for better movement assessment. We
ablate the effects of different data modalities on the accuracy of the proposed network and compare with other
popular architectures. We evaluate our proposed method on a dataset of 25 PD patients, obtaining 72.3% and
77.1% top-1 accuracy on hand movement and gait tasks respectively.
1 INTRODUCTION
Parkinsons disease (PD) is the second most common
neurodegenerative disorder after Alzheimers demen-
tia (Sam
`
a et al., 2012). The characteristic motor
features include slowness of movement (bradykine-
sia), stiffness (rigidity), tremor and postural instabil-
ity (Zhao et al., 2008). These symptoms affect pa-
tients in performing everyday tasks and impact the
quality of their life. Regular clinical assessment and
close monitoring of the signs and symptoms of PD
are required to tailor symptomatic treatments and op-
timize disease control. Further, accurate quantifica-
tion of disease progression is vital in the trials of any
drugs or interventions that are designed to improve or
modify the course of the condition.
Assessment of motor symptoms in PD patients is
usually performed in clinical settings to evaluate the
degree of rigidity and bradykinesia. Typically, the pa-
tient is asked to perform an elaborate series of spe-
cific physical tasks – such as opening and closing
their hand in a rapid succession, i.e. gripping and
letting go, walking at usual pace for several metres.
and so on, whilst being assessed by a PD physician
or specifically-trained nurse who makes an evalua-
tion. In formal settings, such as drug trials or research
studies, the clinical assessment is usually scored, em-
ploying a global recognized scale, the Unified Parkin-
son’s Disease Rating Scale (UPDRS) (Goetz et al.,
2008), where motor evaluation consists of 33 separate
examiner-defined tests. Generally, clinicians quantify
the severity of each action with a score ranging from 0
(normal) to 4 (most severe). However, such a process
of assessment and scoring is highly subjective and ne-
cessitates the expense of an available rater. Therefore,
automating the PD assessment process may assist in
eliminating these shortcomings (Cunningham et al.,
2012).
In this paper, we present a simple, novel, end-
to-end approach to evaluate the severity of PD mo-
tor state in clinical neuroscientific studies from only
video data, based on the UPDRS scale. To suppress
the influence of arbitrary camera motions, commonly
found in real-world video data, we deploy motion
boundary features (Dalal et al., 2006) computed via
optical flow. We use such features along with other in-
put modalities (i.e. RGB and optical flow) in a multi-
stream, deep learning configuration to enhance the ro-
bustness of our model. We adapt the I3D CNN (Con-
volutional Neural Network) (Carreira and Zisserman,
2017) to directly learn spatial and temporal features
from RGB, Flow, and Motion Boundaries at a low
Dadashzadeh, A., Whone, A., Rolinski, M. and Mirmehdi, M.
Exploring Motion Boundaries in an End-to-End Network for Vision-based Parkinson’s Severity Assessment.
DOI: 10.5220/0010309200890097
In Proceedings of the 10th International Conference on Pattern Recognition Applications and Methods (ICPRAM 2021), pages 89-97
ISBN: 978-989-758-486-2
Copyright
c
2021 by SCITEPRESS – Science and Technology Publications, Lda. All rights reserved
89
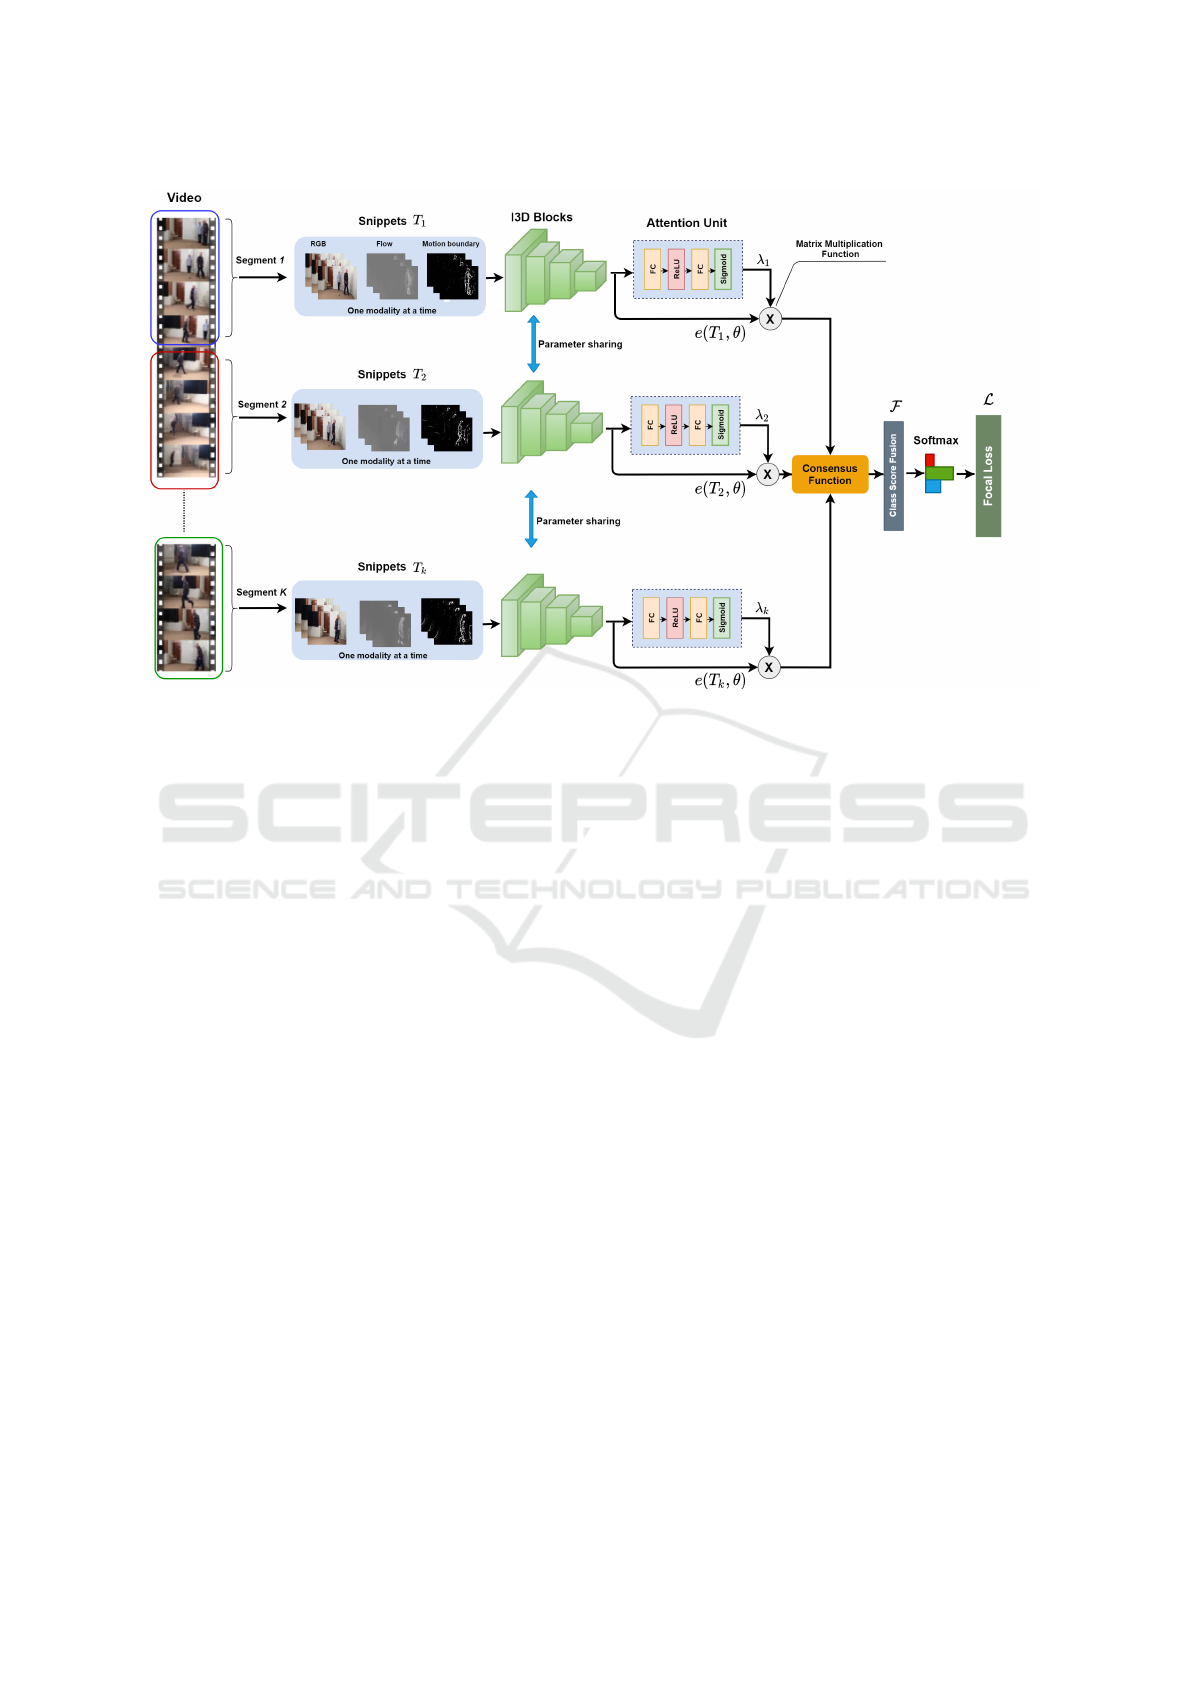
Figure 1: Architecture of the proposed method for PD severity assessment task. The whole model can be trained in an
end-to-end manner by only one loss function. The main steps are as follows: (i) Extracting spatial and temporal feature
representations from K video snippets using a single I3D network that shares all of its weights with the other branches.
(ii) Computing an attention weight for each video snippet by an attention unit. (iii) Weighting each feature vector by its
corresponding attention weight before being forwarded to the consensus function, (iv) Using a Softmax layer to output class
score predictions. Note that at every training and testing process, the network takes one input modality amongst RGB, optical
flow and motion boundaries.
computational cost. We also model long-range tem-
poral structure in the patient’s action since assessing
only a few moments of an action could result in dif-
ferent scores by a rater, e.g. rapid hand opening and
closing sequences may be very similar in part, but in
one case the hand may fail to keep up a consistent am-
plitude and speed of movement towards the end of the
sequence due to fatiguing (as occurs in PD) or may
start badly at the start of the sequence but get better as
the action evolves. To this end, we adopt a sparse tem-
poral sampling strategy (as proposed in (Wang et al.,
2016)) to train our network. This allows for stacks
of a few consecutive frames from different segments
of the input video to be processed by the 3D CNN
independently at inference time and their final scores
averaged only at the end (see Figure 1).
Inspired by the success of ‘attention’, now com-
monly used in deep learning networks, e.g. for human
action recognition (Pei et al., 2017; Long et al., 2018),
we engage attention units which assign individual at-
tention weights over each feature vector. This en-
ables a more reliable model as it allows our network
to focus more heavily on the critical segments of a
video which may contain absolute classification in-
formation. This is motivated by the fact that, in some
cases, clinicians are able to pass judgement on a pa-
tient based on momentary actions, e.g. an interruption
or hesitation during the hand movement task.
We use a dataset collected from 25 clinically di-
agnosed PD patients who underwent UPDRS assess-
ments of their motor function after withholding symp-
tom improving dopaminergic medication overnight,
focusing on the rapid hand opening and closing and
gait components. We train and test our model via a
subject-level N-fold cross validation scheme to evalu-
ate its performance and compare against other popular
deep learning architectures – in particular to demon-
strate the importance of the use of motion boundaries.
To the best of our knowledge, ours is the first work to
propose an end-to-end deep learning framework for
automatic PD severity assessment based on UPDRS
scores from non-skeleton-based data.
In summary, our main contributions are as fol-
lows: (i) we leverage recent advances from deep
learning techniques in human action recognition and
combine them with a temporal attention-based ap-
proach to find a practical design choice for video-
based PD severity prediction, (ii) in order to reduce
the camera motion effect and increase accuracy, we
propose to use motion boundaries as an extra input
ICPRAM 2021 - 10th International Conference on Pattern Recognition Applications and Methods
90

in our multi-stream configuration, (iii) we quantita-
tively compare different architectures and different in-
put modalities, and include ablation studies to deter-
mine the influence of attention and each modality for
two PD motor function tasks.
Next, in Section 2, we describe related works
briefly. In Section 3, our proposed methodology is
outlined. Experiments and comparative results are
presented in Section 4, and finally we conclude the
paper in Section 5.
2 RELATED WORKS
Recently, challenges in PD have been addressed
through machine learning techniques, mostly employ-
ing wearable sensors, such as (Jeon et al., 2017;
Pereira et al., 2019; Abdulhay et al., 2018; Hobert
et al., 2019). For example, (Jeon et al., 2017) per-
formed a comparative study of various machine learn-
ing algorithms, such as decision trees, support vector
machines, discriminant analysis, random forests, and
k-nearest-neighbor on data from a wrist-worn wear-
able device to classify hand tremor severity. Evalu-
ated on 85 patients, the highest accuracy obtained was
85.6% by a decision tree classifier.
Studies that have applied deep learning tech-
niques, such as CNNs and RNNs (Recurrent Neural
Networks), to PD severity automatically from wear-
able sensor data include (Zhao et al., 2018; Xia et al.,
2019; El Maachi et al., 2020; Hssayeni et al., 2019;
Sigcha et al., 2020). For example, (Zhao et al., 2018)
developed a two-stream deep learning architecture,
including a 5-layer CNN and a 2-layer LSTM (Long
Short-Term Memory) network to capture the spatial
and temporal features of gait data. Their model was
trained and tested on three public Vertical Ground Re-
action Force datasets collected by foot sensors from
93 patients with idiopathic PD and 73 healthy con-
trols. A maximum accuracy of 98.8% was reported
for classification of PD patients with different sever-
ity.
However, the use of force sensors, wearables and
other on-body sensors have many limitations. They
are mostly inconvenient, and sometimes very difficult,
to attach to patients, but more importantly, they do
not provide the spectrum of rich information a visual
sensor can present. Moreover, a camera system in the
clinic is passive and not so intrusive as an attached
sensor that can produce discomfort and unease.
With the rise and wide availability of depth-based
sensors (e.g. the Kinect), which reduces the burden of
capturing 3D joints, they have been adopted in many
health-related applications, such as (Hall et al., 2016;
Li et al., 2018b; Khokhlova et al., 2019). For exam-
ple, (Khokhlova et al., 2019) used Kinect V2 skele-
tons to collect a dataset of normal and pathological
gait examples from 27 subjects. Shoe-sole padding
was placed into the right shoe of each person to simu-
late gait problems. They obtained dynamic features of
lower limbs in their dataset to analyse the symmetry
of gait and then applied these features in an LSTM-
based model to learn the difference between normal
and abnormal gait. An average accuracy of 78.5%
was achieved by cross-validation on 10 different vali-
dation partitions.
We are interested in assessing PD severity with re-
course to only RGB (and RGB-derived) data which is
an easily available modality. Works such as (Li et al.,
2018a; Pintea et al., 2018; Chang et al., 2019), gen-
erate RGB video features from deep learning-based
pose estimation networks. For example, (Pintea et al.,
2018) estimated the frequency of hand tremors in
Parkinsons patients by applying Convolutional Pose
Machines (CPM) (Wei et al., 2016) and Kalman fil-
tering to detect and track hand motion, and then sub-
tracting the original hand locations from their smooth
trajectory to estimate the tremor frequency. (Li et al.,
2018a) used movement trajectory characteristics (e.g.
kinematic, frequency) extracted using CPM to train
random forests to assess the severity of Parkinsonism
in leg agility and toe tapping tasks. (Chang et al.,
2019) used OpenPose (Cao et al., 2018) to extract
frame-level feature keypoints from finger taps and
hand tremor tasks. They encoded these into a single
task-level feature vector by using 15 statistical func-
tions, such as max, min, mean, median, standard de-
viation, Fisher vectors, and so on. This single task-
level feature vector was then fed into a feedforward
neural network to classify each subject into normal
and abnormal classes for each hand at the individual
task level. The key limitations of these pose-based
methods are that they rely on hand-crafted feature ex-
traction and pre-processing steps which limits their
models’ representational capability.
To obtain good visual representations, especially
rich in temporal features, is a challenging task and
has received considerable attention in recent years
(Simonyan and Zisserman, 2014; Wang et al., 2016;
Carreira and Zisserman, 2017; Feichtenhofer et al.,
2019). In an early work, (Simonyan and Zisserman,
2014) designed a two-stream CNN to model spatial
and temporal features from RGB and optical flow, re-
spectively. These were then fused to generate the fi-
nal classification scores. The Temporal Segment Net-
work of (Wang et al., 2016) further improved the re-
sults of the two-stream CNN at a reasonable compu-
tational cost by modelling long-range temporal struc-
Exploring Motion Boundaries in an End-to-End Network for Vision-based Parkinson’s Severity Assessment
91

tures and proposing a temporal sampling strategy for
training CNNs on video data. By inflating the Ima-
geNet pre-trained 2D kernels into 3D, (Carreira and
Zisserman, 2017) directly learned spatial and tempo-
ral features from RGB, significantly enhancing the
state of the art on action recognition at the time. Their
Inflated 3D ConvNet (I3D) remains a popular network
of choice. Feichtenhofer et al. introduced the Slow-
Fast architecture (Feichtenhofer et al., 2019), which
uses a slow pathway to capture spatial content of a
video, and a fast pathway to capture motion at fine
temporal resolution. Our proposed multi-stream ar-
chitecture applies an I3D backbone, based on a tem-
poral segment strategy, and we will also consider the
SlowFast approach for our comparative analysis.
3 PROPOSED APPROACH
Our aim is to learn an end-to-end, deep learning
model for movement disorder severity assessment in
Parkinson’s patients, without resort to joint data or
elaborate annotations. Given a video from a patient
in the clinic performing a UPDRS test task, such as
hand opening and closing, our model exploits the mo-
tion information in the scene to predict a score de-
pending on how well the task was carried out. Our
only annotation is the UPDRS score for the test, as
determined by an expert clinical neuroscience rater.
Figure 1 illustrates an overview of our network and
approach. In the following, we explain the details of
our method and its training procedure.
Network Architecture. Following (Wang et al.,
2016), we use sparse temporal sampling for our model
training. As shown in Figure 1, we first split the video
into K segments, each of which is randomly sam-
pled into a short snippet to form sparse sampling of
the whole clip into K snippets {T
i
, i = 1..K} – with
each snippet generated in three formats (RGB, Flow,
and Motion Boundaries, but not individually speci-
fied here for reasons of simplicity and brevity). Then,
similar to (Liu et al., 2018), we apply a 3D CNN as
the backbone of this framework to directly learn spa-
tial and temporal features from video snippets. To
overcome the increased parameter space and associ-
ated risks of overfitting resulting from this change,
I3D (Carreira and Zisserman, 2017) is deployed as
the 3D CNN which inflates all the 2D convolution fil-
ters used by the Inception V1 architecture (Szegedy
et al., 2015) into 3D convolutions allowing a deep 3D
ConvNet with many fewer parameters. We found this
strategy very efficient to analyse the complex motions
of our video data which are by nature relatively long.
The spatial and temporal feature maps of the last
convolutional layer of I3D for each video snippet feed
into an attention unit that consists of two fully con-
nected (FC) layers interspersed by a ReLU activation
function and a Sigmoid function to generate attention
weights λ (0.0 ≤ λ ≤ 1.0) for each video snippet. This
is based on the attention module proposed in (Nguyen
et al., 2018).
Then, in the forward pass of the system, the en-
coded, attention-weighted features are used to mod-
ulate the global average pooling and therefore com-
piled via the consensus function C(.) to produce class
score fusion F of length M over K video snippets,
F = C(.) =
Σ
K
i=1
(λ
i
e(T
i
, θ))
K
, (1)
where e(.) is the encoding function and θ are the net-
work parameters. A Softmax on F then provides the
probability distribution p of the UPDRS class scores
of the video clip, i.e.
p =
expF
i
Σ
X
j=1
expF
j
. (2)
Motion Boundaries. Previous works, such as (Si-
monyan and Zisserman, 2014; Wang et al., 2016; Car-
reira and Zisserman, 2017), have shown the impor-
tance of using optical flow in deep learning-based hu-
man action recognition. However, optical flow fields
represent the absolute motion, making the disentan-
glement of object-level and camera motions a signifi-
cant challenge (Chapel and Bouwmans, 2020). (Wang
et al., 2016) proposed to use warped flow (Wang and
Schmid, 2013) to cancel out the camera motion. How-
ever, warped flow did not results in a better perfor-
mance than normal optical flow in their work. More-
over, computing this modality can be computationally
very expensive (Wang and Schmid, 2013).
To address this problem, we need a new input
stream that better encodes the relative motion between
pixels. Thus, we use motion boundaries, initially pro-
posed in the context of human detection (Dalal et al.,
2006), to remove constant motion and therefore sup-
press the influence of camera motions.
In a similar fashion to (Dalal et al., 2006), we
compute motion boundaries simply by a derivative
operation on the optical flow components, as shown
in Figure 2. Formally, let u
x
=
∂u
∂x
and u
y
=
∂u
∂y
repre-
sent the x and y derivatives of horizontal optical flow,
and v
x
=
∂v
∂x
and v
y
=
∂v
∂y
represent the x and y deriva-
tives of vertical optical flow respectively. Then, for
any frame j,
B
j
u
= f (u
j
x
, u
j
y
), B
j
v
= f (v
j
x
, v
j
y
), (3)
ICPRAM 2021 - 10th International Conference on Pattern Recognition Applications and Methods
92
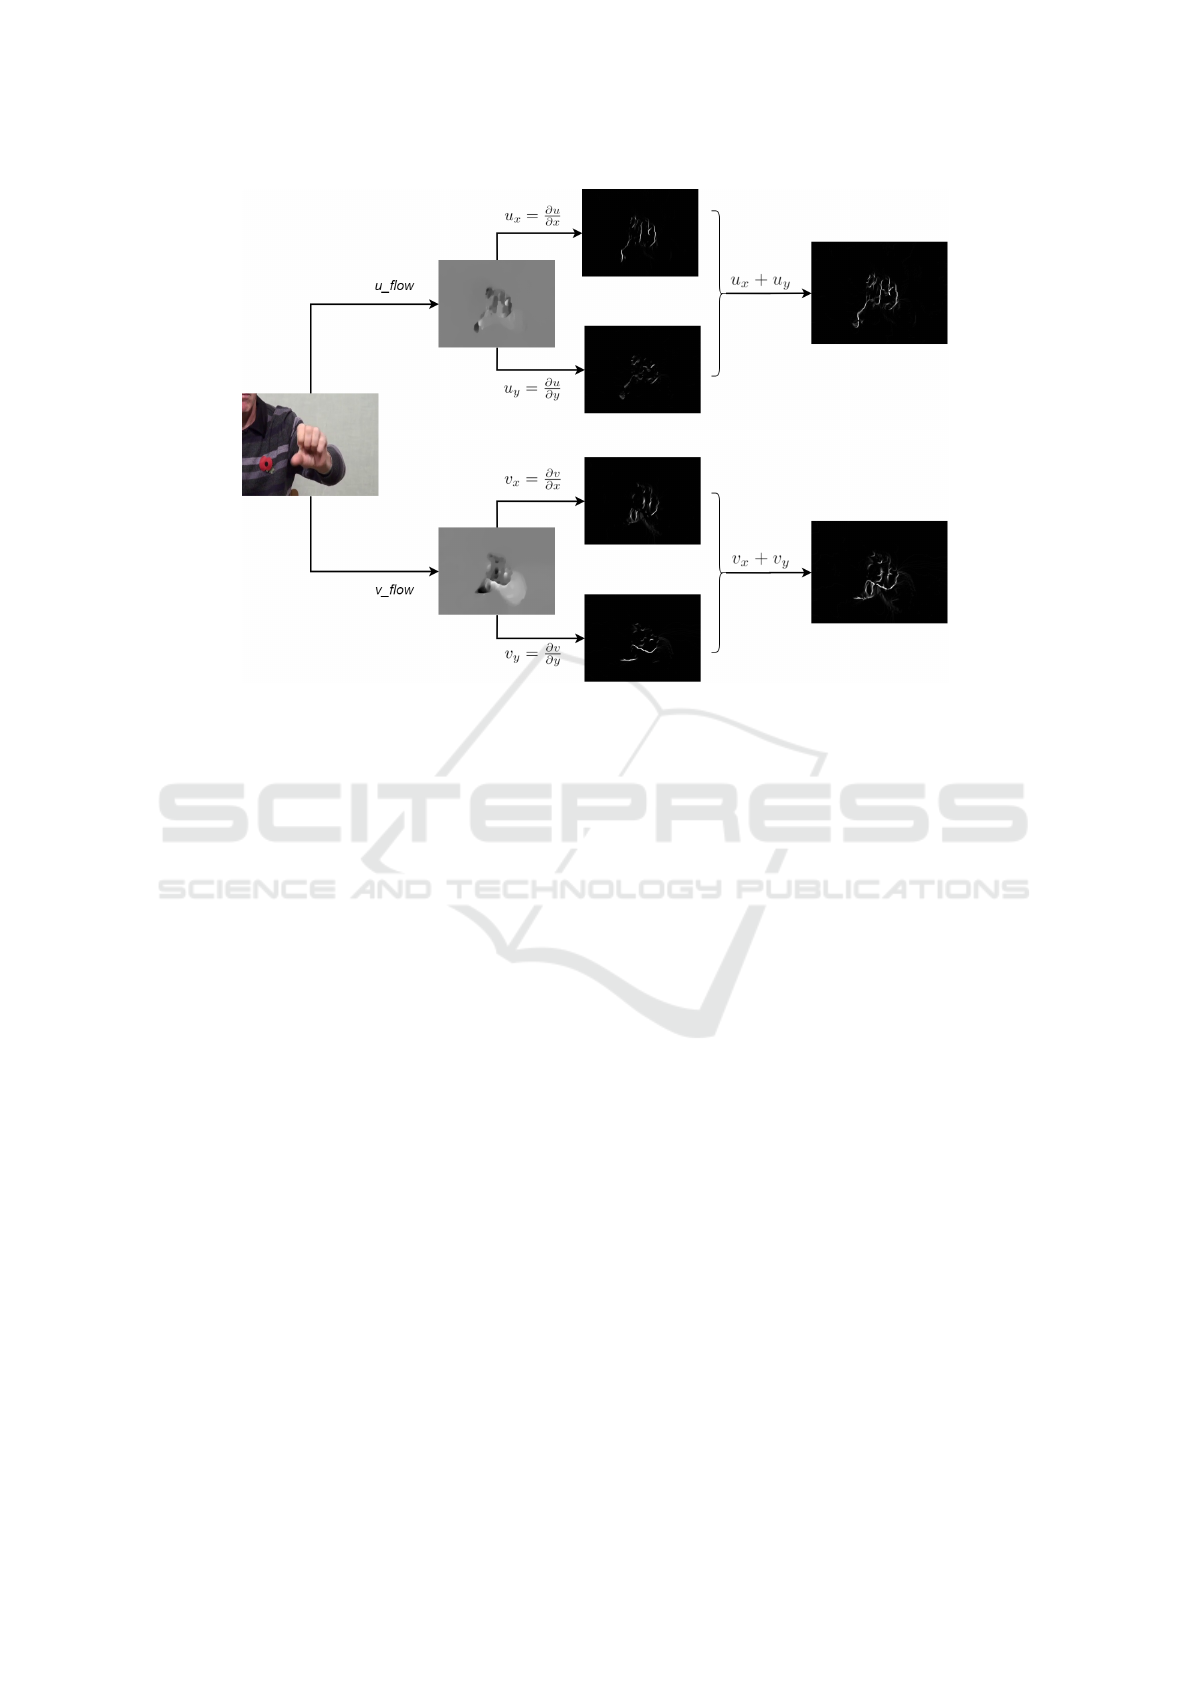
Figure 2: Motion boundary computation from optical flow components u and v. For each flow component, we compute
two motion boundaries via derivatives for the horizontal and vertical flow components. Then the final motion boundaries
are obtained by their sum. It is clear that optical flow contains constant motion in the background which is removed after
computing motion boundaries.
where B
u
represents the motion boundary in horizon-
tal optical flow u, and B
v
represents the motion bound-
ary in vertical optical flow v, and f is a summing func-
tion. It is clear that, for a video clip with N frames,
(N − 1) ∗ 2 motion boundary frames are computed.
Class Imbalance. In the PD dataset used in this
study (see details in Section 4), the number of videos
belonging to UPDRS scores 3 and 4 is significantly
lower than those belonging to the other classes.
Therefore, we have a class imbalance problem which
can lead to a model biased towards the classes with
large number of samples.
In order to mitigate this problem, we apply two
strategies. In the first, we group the scores into three
classes: score 0 for normal subjects - i.e. patients
who are at very early stage of PD and may still have
one unaffected upper limb, score 1-2 for subjects
with mild symptoms, and score 3-4 for subjects with
severe symptoms. In the second strategy, we utilize
an extended version of the normal class entropy
loss, called focal loss (Lin et al., 2017), to train our
multi-class classification task. The original focal
loss was proposed for single-class object detection in
order to down-weight easy classes and better weight
rarer classes by adding a factor to the standard cross
entropy loss.
Then, our loss function can be stated as
L(y, p) = −α(1 − p)
γ
y log p , (4)
where y is the UPDRS groundtruth label and γ adjusts
the rate at which easy samples are down-weighted.
This adds a modulating factor α(1 − p)
γ
to the cross-
entropy loss. When a sample is classified with a high
probability, i.e. p is large, the value of the modulating
factor is small and the loss for that sample is down-
weighted. In contrast, when a hard sample is misclas-
sified with low probability, the modulating factor is
large, increasing that samples contributions to the to-
tal loss. The value of α is prefixed (0 < α ≤ 1) to
balance the importance of samples belonging to dif-
ferent classes. When α = 1 and γ = 0, the focal loss
is equivalent to cross-entropy loss.
4 EXPERIMENTS
In this section, we first present our PD dataset used for
evaluating our proposed method. Then, we provide
the experimental setup and our detailed ablation study
of various aspects of our model. Finally, we compare
our model with the state of the art works in human
action recognition.
Exploring Motion Boundaries in an End-to-End Network for Vision-based Parkinson’s Severity Assessment
93
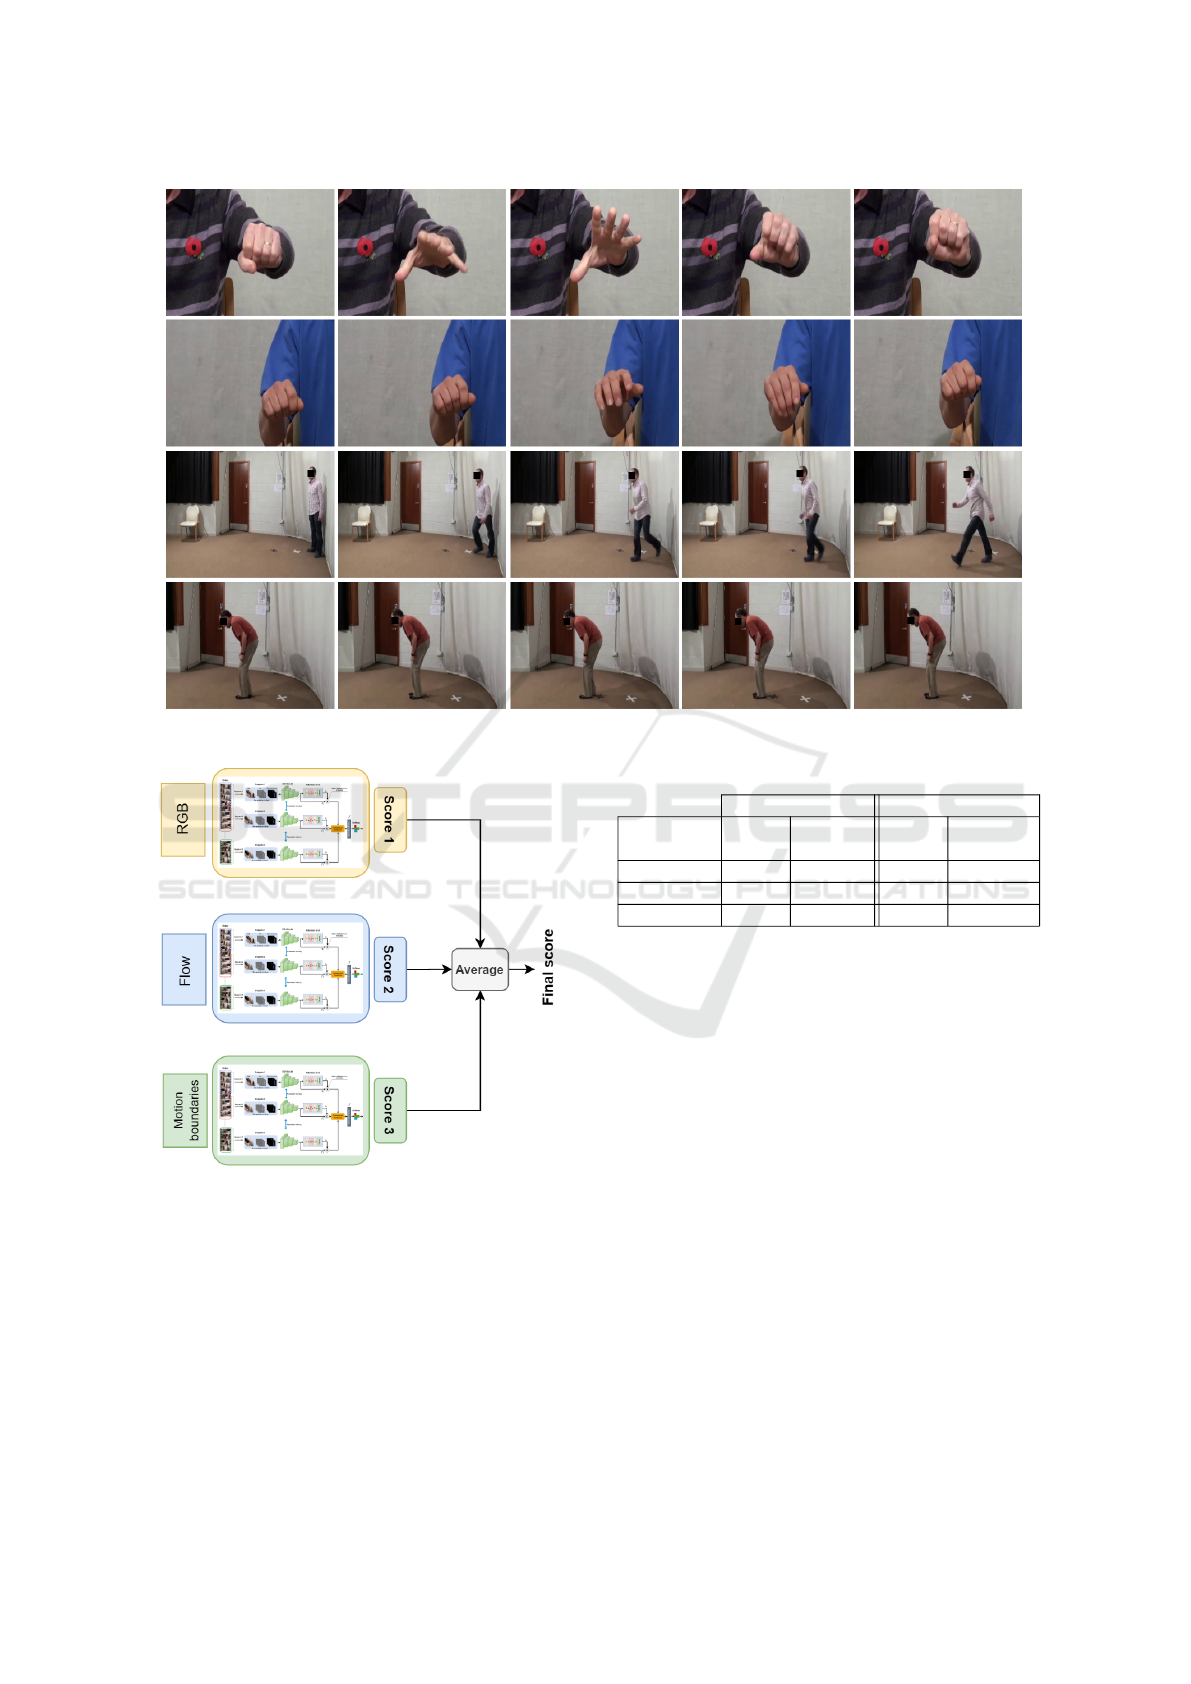
Figure 3: Sample frames from different patients at varying severity levels (top two for hand movement, lower two for gait).
Figure 4: An overview of our multi-stream configuration.
We train our model with each different input modality sep-
arately and then use a late fusion approach at test time to
average over all predicted scores.
4.1 Dataset
The Parkinson’s Disease dataset used in this study
contains video data from 25 PD patients tested lon-
gitudinally at 8 week intervals over time. Subjects
were between the ages of 41 to 72 years and per-
formed UPDRS tasks and their scores were assigned
Table 1: Details of our PD dataset.
Hand movement Gait
Score #video
#frame
min/max
#video
#frame
min/max
Normal (0) 180 131/312 171 473/980
Mild (1-2) 500 123/717 180 580/5007
Severe (3-4) 24 202/1210 3 1367/3012
by trained clinical raters. Videos were captured at
25fps at a resolution of 1920×1080, using a single
RGB camera (SONY HXR-NX3). Our dataset con-
sists of 1058 videos spanning two different UPDRS
tasks: hand movement and gait. In the first task, the
patients had to open and close their hand (each hand
separately) 10 times, as fully and as quickly as pos-
sible. The second task is gait analysis in which the
patients walked 10 metres at a comfortable pace and
then returned to their starting point. Table 1 shows
the number of videos in each of our score classes, as
well as their minimum/maximum number of frames
for each UPDRS task. Figure 3 shows sample frames
from our dataset, selected from four subjects with dif-
ferent PD severity levels performing hand movement
and gait tasks.
Implementation Details. The input videos were re-
duced to a resolution of 340 × 256 pixels. We used
Pytorch to implement our models and TV-L1 (Zach
et al., 2007) for computing optical flow fields. The
ICPRAM 2021 - 10th International Conference on Pattern Recognition Applications and Methods
94
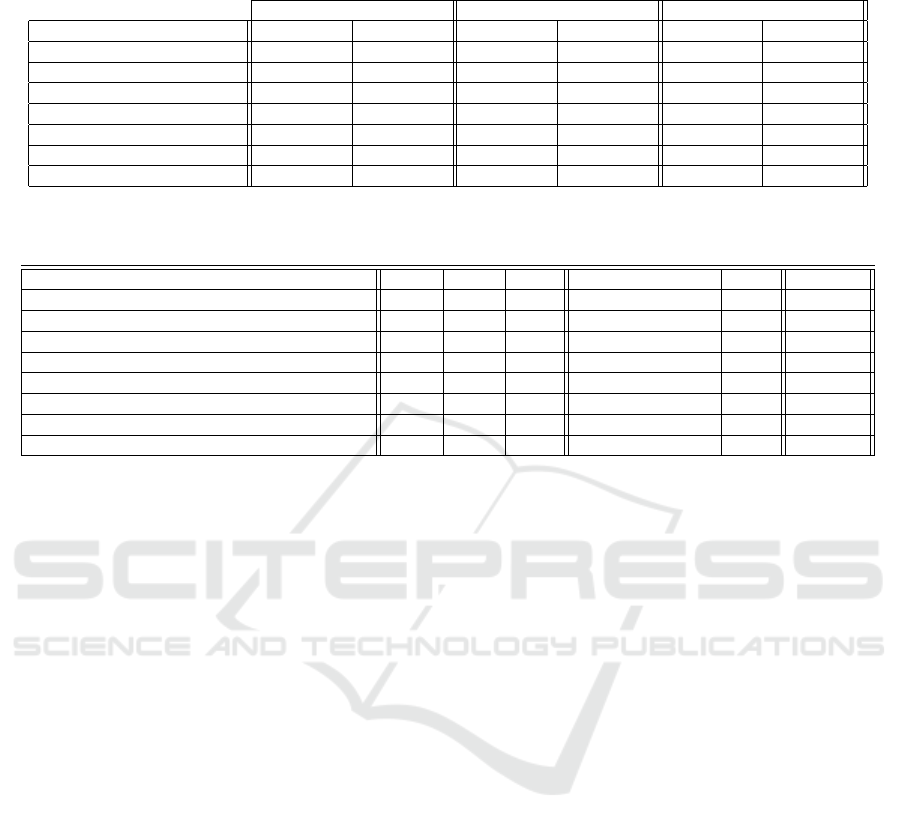
Table 2: F
1
score results of our proposed network for both hand movement and gait tasks with different input modalities, with
and without attention units. The last column shows the average results across both tasks. All results are given in %.
Hand Movement Gait Average
Input Modalities +attention −attention +attention −attention +attention −attention
RGB 68.4 65.2 74.8 73.7 71.6 69.4
Flow 71.0 68.6 76.5 74.1 73.7 71.3
Motion Boundaries 72.3 70.0 76.8 76.5 74.5 73.2
RGB + Flow 69.9 68.8 76.2 75.1 73.0 71.9
RGB + Motion Boundaries 70.4 70.1 75.4 72.3 72.9 71.2
Flow + Motion Boundaries 71.7 71.7 77.1 76.2 74.4 73.9
All Modalities 71.1 70.2 77.1 75.1 74.1 72.6
Table 3: Comparison of our method with different state-of-the-art architectures. MBs is for Motion Boundaries and all results
are given in %.
Model RGB Flow MBs Hand Movement Gait Average
Two-Stream (Simonyan and Zisserman, 2014) X X 60.3 56.7 58.5
TSN (Wang et al., 2016) X X 70.1 75.7 72.9
I3D (Carreira and Zisserman, 2017) X X 69.1 73.1 71.1
SlowFast (Feichtenhofer et al., 2019) X 67.1 66.9 67.0
TSN + SlowFast X 68.4 68.9 68.6
Proposed Method w/o Focal loss X 70.7 75.7 73.2
Proposed Method X X 71.7 77.1 74.4
Proposed Method X 72.3 76.8 74.5
focal loss (Eq. 4) parameters were set to α = 0.5 and
γ = 2 for all experiments. We applied Adam optimiza-
tion with a learning rate of 0.00001, and batch size 2
to optimize our model parameters. Dropout was ap-
plied with a ratio of 0.7 before the output layer of our
I3D network. All models were trained for 120 epochs
using one Nvidia RTX 2048TI GPU under Cuda 10.1
with cuDNN 7.6.
4.2 Experimental Setup
Training and Testing Details. Each video was split
into K = 4 equal segments along the temporal axis.
Preserving chronological order, we randomly sam-
pled 32 frames within each video segment as a snip-
pet. The length of our snippets is relatively larger than
the length of snippets used in (Wang et al., 2016).
We verified empirically that for our PD task sampling
these larger snippets can provide more application-
specific motion characteristics to our network.
Since in the training step all I3D models share
their parameters, our trained model behaves like the
original I3D network (Carreira and Zisserman, 2017)
during testing. Therefore, we did not use temporal
sampling when testing our model, allowing us to draw
fair comparison with other models who also tested
without temporal sampling, such as (Simonyan and
Zisserman, 2014; Carreira and Zisserman, 2017; Fe-
ichtenhofer et al., 2019). Specifically, during testing
we used 64 non-sampled snippets per video, each con-
taining 16 consecutive frames. The prediction scores
of all these snippets were then averaged across each or
combined modalities to get a video-level score (as il-
lustrated in Figure 4). Note, this follows the same ap-
proach as (Carreira and Zisserman, 2017) where RGB
and Flow were averaged at test time.
To avoid overfitting, we initialised our network by
pretraining on Kinetics (Kay et al., 2017), and ap-
plied augmentation for all frames within each train-
ing snippet, including scale jittering, corner cropping,
and horizontal flipping.
Evaluation Metrics. We used 5-fold cross valida-
tion for 5 batches (given our 25 patients) to yield un-
biased performance of the models and report the F
1
score over the average validation scores.
4.3 Results Including Ablation Study
Choice of Input Modalities. The results in Table
2 show comparative evaluations on different input
modalities. For the Hand Movement task, motion
boundaries alone perform best at 72.3% as they cap-
ture the characteristic motions in the task. This re-
sult improves over using RGB and Flow by ↑3.9%
and ↑1.3% respectively. When Motion Boundaries
are combined with RGB and Flow, the results improve
over using those modalities alone to 70.4% and 71.7%
respectively. For the gait task, where there is much
more pronounced dynamic movement spatiotempo-
raly, all modalities perform comparatively well, with
Exploring Motion Boundaries in an End-to-End Network for Vision-based Parkinson’s Severity Assessment
95

Flow+Motion Boundaries achieving the best perfor-
mance at 77.1%. On average, the use of Motion
Boundaries is vindicated as a significant extra modal-
ity that can contribute to, or alone generate, improved
results.
Effect of Attention. To study the influence of the
attention units, we perform all our experiments with
and without them. As seen in Table 2, in all ex-
periments for hand movement and gait tasks, our
model achieves better accuracy with the attention
units. Again, even without attention units, Motion
Boundaries play a significant role in improving the
results over other modalities.
Performance of other Architectures. Table 3 pro-
vides the F
1
percentages of other architectures
adapted to provide a UPDRS score for our applica-
tion. We used the same data augmentation strategy
with focal loss to train all models. All the network
weights were initialized with pre-trained models from
Kinetics-400, except for the SlowFast network, as one
of the properties of this model is training from scratch
without needing any pre-training. Although we ex-
amined the performance of these architectures for all
possible input modalities, we only report here their
best results, again except for the SlowFast network,
as this model is only based on RGB input. Thus, for
example for I3D (Carreira and Zisserman, 2017), its
best result is when using Flow and Motion Bound-
aries. As shown in the table, our proposed approach
performs better than these popular networks for both
hand movement and gait tasks.
Effect of Focal Loss. The importance of using our
focal loss (Eq. 4) is also shown in Table 3 where the
performance of our method when using a categorical
cross-entropy loss results in an average drop of ↓1.3%
compared to the full focal-loss based result of 74.5%.
5 CONCLUSIONS
In this paper, we proposed an end-to-end network for
the assessment of PD severity from videos for two
UPDRS tasks: hand movement and gait. Our model
builds upon an inflated 3D CNN trained by a tempo-
ral sampling strategy to exploit long-range temporal
structure at low cost. We applied an attention mech-
anism along the temporal axis to provide learned at-
tention weights for each video segment, allowing our
model to focus more on the relevant parts of each
video. We also proposed the use of motion bound-
aries as a viable input modality to suppress constant
camera motion and showed its effect on the quality of
the assessment scores quantitatively. We also evalu-
ated the performance of several popular architectures
for PD severity assessment.
One limitation of our approach is that it is unable
to handle several UPDRS tasks in one training process
in which we need to train and evaluate our model on
each task separately. In future work, we hope to han-
dle this issue through unsupervied learning and adopt-
ing multiple loss functions with an effective way to
combine them.
ACKNOWLEDGEMENTS
The authors sincerely thank for the kind donations to
the Southmead Hospital Charity and from Caroline
Belcher. Their generosity has made this research pos-
sible.
REFERENCES
Abdulhay, E., Arunkumar, N., Narasimhan, K., Vellaiap-
pan, E., and Venkatraman, V. (2018). Gait and tremor
investigation using machine learning techniques for
the diagnosis of Parkinson disease. Future Genera-
tion Computer Systems, 83:366–373.
Cao, Z., Hidalgo, G., Simon, T., Wei, S.-E., and Sheikh,
Y. (2018). OpenPose: realtime multi-person 2D pose
estimation using Part Affinity Fields. arXiv preprint
arXiv:1812.08008.
Carreira, J. and Zisserman, A. (2017). Quo vadis, action
recognition? a new model and the kinetics dataset. In
CVPR, pages 6299–6308.
Chang, C.-M., Huang, Y.-L., Chen, J.-C., and Lee, C.-C.
(2019). Improving Automatic Tremor and Movement
Motor Disorder Severity Assessment for Parkinsons
Disease with Deep Joint Training. In EMBC, pages
3408–3411. IEEE.
Chapel, M.-N. and Bouwmans, T. (2020). Moving Objects
Detection with a Moving Camera: A Comprehensive
Review. arXiv preprint arXiv:2001.05238.
Cunningham, L. M., Nugent, C. D., Moore, G., Finlay,
D. D., and Craig, D. (2012). Computer-based assess-
ment of movement difficulties in Parkinson’s disease.
Computer Methods in Biomechanics and Biomedical
Engineering, 15(10):1081–1092.
Dalal, N., Triggs, B., and Schmid, C. (2006). Human de-
tection using oriented histograms of flow and appear-
ance. In ECCV, pages 428–441. Springer.
El Maachi, I., Bilodeau, G.-A., and Bouachir, W. (2020).
Deep 1D-Convnet for accurate Parkinson disease de-
tection and severity prediction from gait. Expert Sys-
tems with Applications, 143:113075.
ICPRAM 2021 - 10th International Conference on Pattern Recognition Applications and Methods
96

Feichtenhofer, C., Fan, H., Malik, J., and He, K. (2019).
Slowfast networks for video recognition. In ICCV,
pages 6202–6211.
Goetz, C. G., Tilley, B. C., Shaftman, S. R., Stebbins,
G. T., Fahn, S., Martinez-Martin, P., Poewe, W.,
Sampaio, C., Stern, M. B., Dodel, R., et al. (2008).
Movement Disorder Society-sponsored revision of
the Unified Parkinson’s Disease Rating Scale (MDS-
UPDRS): scale presentation and clinimetric testing re-
sults. Movement Disorders: official Journal of the
Movement Disorder Society, 23(15):2129–2170.
Hall, J., Hannuna, S., Camplani, M., Mirmehdi, M., Damen,
D., Burghardt, T., Tao, L., Paiement, A., and Crad-
dock, I. (2016). Designing a video monitoring system
for AAL applications: The SPHERE case study.
Hobert, M. A., Nussbaum, S., Heger, T., Berg, D., Maet-
zler, W., and Heinzel, S. (2019). Progressive gait
deficits in Parkinsons disease: A wearable-based bian-
nual 5-year prospective study. Frontiers in Aging Neu-
roscience, 11:22.
Hssayeni, M. D., Jimenez-Shahed, J., Burack, M. A., and
Ghoraani, B. (2019). Wearable sensors for estima-
tion of Parkinsonian tremor severity during free body
movements. Sensors, 19(19):4215.
Jeon, H., Lee, W., Park, H., Lee, H. J., Kim, S. K., Kim,
H. B., Jeon, B., and Park, K. S. (2017). Automatic
classification of tremor severity in Parkinsons disease
using a wearable device. Sensors, 17(9):2067.
Kay, W., Carreira, J., Simonyan, K., Zhang, B., Hillier, C.,
Vijayanarasimhan, S., Viola, F., Green, T., Back, T.,
Natsev, P., et al. (2017). The kinetics human action
video dataset. arXiv preprint arXiv:1705.06950.
Khokhlova, M., Migniot, C., Morozov, A., Sushkova, O.,
and Dipanda, A. (2019). Normal and pathological gait
classification LSTM model. Artificial Intelligence in
Medicine, 94:54–66.
Li, M. H., Mestre, T. A., Fox, S. H., and Taati, B.
(2018a). Vision-based assessment of Parkinsonism
and levodopa-induced dyskinesia with pose estima-
tion. Journal of Neuroengineering and Rehabilitation,
15(1):97.
Li, Q., Wang, Y., Sharf, A., Cao, Y., Tu, C., Chen, B., and
Yu, S. (2018b). Classification of gait anomalies from
Kinect. The Visual Computer, 34(2):229–241.
Lin, T.-Y., Goyal, P., Girshick, R., He, K., and Doll
´
ar, P.
(2017). Focal loss for dense object detection. In ICCV,
pages 2980–2988.
Liu, K., Liu, W., Gan, C., Tan, M., and Ma, H. (2018).
T-C3D: Temporal convolutional 3D network for real-
time action recognition. In Thirty-second AAAI Con-
ference on Artificial Intelligence.
Long, X., Gan, C., De Melo, G., Wu, J., Liu, X., and Wen,
S. (2018). Attention clusters: Purely attention based
local feature integration for video classification. In
CVPR, pages 7834–7843.
Nguyen, P., Liu, T., Prasad, G., and Han, B. (2018).
Weakly supervised action localization by sparse tem-
poral pooling network. In CVPR, pages 6752–6761.
Pei, W., Baltrusaitis, T., Tax, D. M., and Morency, L.-P.
(2017). Temporal attention-gated model for robust se-
quence classification. In CVPR, pages 6730–6739.
Pereira, C. R., Pereira, D. R., Weber, S. A., Hook, C., de Al-
buquerque, V. H. C., and Papa, J. P. (2019). A sur-
vey on computer-assisted Parkinson’s disease diagno-
sis. Artificial Intelligence in Medicine, 95:48–63.
Pintea, S. L., Zheng, J., Li, X., Bank, P. J., van Hilten, J. J.,
and van Gemert, J. C. (2018). Hand-tremor frequency
estimation in videos. In ECCV.
Sam
`
a, A., P
´
erez-L
´
opez, C., Romagosa, J., Rodriguez-
Martin, D., Catal
`
a, A., Cabestany, J., Perez-Martinez,
D., and Rodr
´
ıguez-Molinero, A. (2012). Dyskinesia
and motor state detection in parkinson’s disease pa-
tients with a single movement sensor. In 2012 An-
nual International Conference of the IEEE Engineer-
ing in Medicine and Biology Society, pages 1194–
1197. IEEE.
Sigcha, L., Costa, N., Pav
´
on, I., Costa, S., Arezes, P., L
´
opez,
J. M., and De Arcas, G. (2020). Deep Learning Ap-
proaches for Detecting Freezing of Gait in Parkinsons
Disease Patients through On-Body Acceleration Sen-
sors. Sensors, 20(7):1895.
Simonyan, K. and Zisserman, A. (2014). Two-stream con-
volutional networks for action recognition in videos.
In Advances in Neural Information Processing Sys-
tems, pages 568–576.
Szegedy, C., Liu, W., Jia, Y., Sermanet, P., Reed, S.,
Anguelov, D., Erhan, D., Vanhoucke, V., and Rabi-
novich, A. (2015). Going deeper with convolutions.
In CVPR, pages 1–9.
Wang, H. and Schmid, C. (2013). Action recognition with
improved trajectories. In Proceedings of the IEEE
international conference on computer vision, pages
3551–3558.
Wang, L., Xiong, Y., Wang, Z., Qiao, Y., Lin, D., Tang, X.,
and Van Gool, L. (2016). Temporal segment networks:
Towards good practices for deep action recognition. In
ECCV, pages 20–36. Springer.
Wei, S.-E., Ramakrishna, V., Kanade, T., and Sheikh, Y.
(2016). Convolutional pose machines. In CVPR,
pages 4724–4732.
Xia, Y., Yao, Z., Ye, Q., and Cheng, N. (2019). A dual-
modal attention-enhanced deep learning network for
quantification of Parkinsons disease characteristics.
IEEE Transactions on Neural Systems and Rehabili-
tation Engineering, 28(1):42–51.
Zach, C., Pock, T., and Bischof, H. (2007). A dual-
ity based approach for realtime TV-l 1 optical flow.
In Joint Pattern Recognition Symposium, pages 214–
223. Springer.
Zhao, A., Qi, L., Li, J., Dong, J., and Yu, H. (2018). A hy-
brid spatio-temporal model for detection and severity
rating of Parkinsons disease from gait data. Neuro-
computing, 315:1–8.
Zhao, Y., Tan, L., Lau, P., Au, W., Li, S., and Luo, N.
(2008). Factors affecting health-related quality of life
amongst Asian patients with Parkinsons disease. Eu-
ropean Journal of Neurology, 15(7):737–742.
Exploring Motion Boundaries in an End-to-End Network for Vision-based Parkinson’s Severity Assessment
97
