
Emotion Recognition through Voting on Expressions in Multiple
Facial Regions
Ekanshi Agrawal
1
, Jabez Christopher
1a
and Vasan Arunachalam
2
1
Department of Computer Science and Information Systems, BITS Pilani, Hyderabad Campus, Telangana, India
2
Department of Civil Engineering, BITS Pilani, Hyderabad Campus, Telangana, India
Keywords: Facial Expression Recognition, Emotion Classification, Periocular Region, Machine Learning.
Abstract: Facial Expressions are a key part of human behavior, and a way to express oneself and communicate with
others. Multiple groups of muscles, belonging to different parts of the face, work together to form an
expression. It is quite possible that the emotions being expressed by the region around the eyes and that around
the mouth, don’t seem to agree with each other, but may agree with the overall expression when the entire
face is considered. In such a case, it would be inconsiderate to focus on a particular region of the face only.
This study evaluates expressions in three regions of the face (eyes, mouth, and the entire face) and records
the expression reported by the majority. The data consists of images labelled with intensities of Action Units
in three regions – eyes, mouth, and the entire face – for eight expressions. Six classifiers are used to determine
the expression in the images. Each classifier is trained on all three regions separately, and then tested to
determine an emotion label separately for each of the three regions of a test image. The image is finally
labelled with the emotion present in at least two (or majority) of the three regions. Average performance over
five stratified train-test splits it taken. In this regard, the Gradient Boost Classifier performs the best with an
average accuracy of 94%, followed closely by Random Forest Classifier at 92%. The results and findings of
this study will prove helpful in current situations where faces are partially visible and/or certain parts of the
face are not captured clearly.
1 INTRODUCTION
Emotional analysis is a technique used by various
researchers to develop systems that attempt to
quantify the emotion being conveyed by an audience.
It is also used to judge emotional engagement in
various situations. Judging audience feedback in
seminars and lectures generally requires the use of
facial expressions and only seldom use gestural forms
of communication. Further use of emotion
recognition comes in some systems that judge an
observer’s stance on some target topic or event
(Küçük and Can, 2020). This makes a big
contribution to advertising campaigns, political
manifestos, product testing, political alignment
testing, among other uses. These systems either take
emotional feedback through surveillance videos,
written or video feedback from the observers, or even
by analysing public social media posts concerning the
event for which the feedback is being taken. Facial
a
https://orcid.org/0000-0001-6744-9329
emotion recognition systems are being used by many
products to attend to the user’s innermost feelings,
and to use the information to improve the interaction
between the user and the product.
Any human facial expression uses multiple parts
of the face to be formed. Since muscles lie in close
proximity to each other, and are often connected,
groups of muscles move together to form even the
slightest expression. Humans are inherently wired to
be able to recognize expressions, by analysing the
various regions of the face and the possible
expressions that are being displayed. These
expressions need not be linked to just one emotion; a
good mix of emotions is often expressed. However,
in most cases there is always a highlighted emotion
that stands out as the major one. People are thus able
to not only recognize the highlighted emotion, but
also hints of other emotions. However, emotions are
a subjective topic in such a scenario, since every
human perceives expressions differently. Thus, one
1038
Agrawal, E., Christopher, J. and Arunachalam, V.
Emotion Recognition through Voting on Expressions in Multiple Facial Regions.
DOI: 10.5220/0010306810381045
In Proceedings of the 13th International Conference on Agents and Artificial Intelligence (ICAART 2021) - Volume 2, pages 1038-1045
ISBN: 978-989-758-484-8
Copyright
c
2021 by SCITEPRESS – Science and Technology Publications, Lda. All rights reserved

approach that can bring us the closest objective
answer to figuring out the emotion being expressed,
is by analysing different regions of the face separately
and then coming to a conclusion about the recognized
emotion as the emotion inferred in the majority of the
regions that were processed.
For this purpose, the regions of the face chosen in
this paper are the eyes and the mouth, along with the
entire face. Features here refer to the Action Units
from the Facial Action Coding System (FACS)
(Ekman, 1997), which are groups of muscles in the
taxonomy of the human face that move together to
form an expression. These AUs are available in the
Extended Cohn Kanade Dataset (CK+) (Lucey et. al,
2010), along with 327 facial images, labelled with the
AUs and their corresponding intensities displayed in
the face in the image. This work attempts to find a
classification system that can determine emotions in
this way, and performs well at that.
2 EARLIER STUDIES
Recent studies involve emotion recognition from only
the periocular region (Agrawal and Christopher,
2020). The use of this region of interest was driven by
the idea that emotion recognition systems currently in
use do not recognize partially visible faces, much less
extract the emotion from them. In it, all Action Units
lying in the periocular region were extracted, and run
through subset selection. The selected features were
used to train five classifiers. The classifiers were
judged on how well they accurately classified each set
of features into the corresponding emotion class. It
was observed that the Random Forest Classifier
performed the best, with a classification accuracy of
around 75%. This experiment derived some interest
in working with regions of the face separately when
it comes to emotion recognition. It is obvious that no
single region can figure out an emotion on its own
with an accuracy as close to that when multiple
regions contribute to the emotion recognition process.
Another study by Alonso-Fernandez et. al, (2018)
is a proof of the fact that the eyes serve as a
satisfactory RoI to recognize emotions. 12 action
units lie in the periocular region, which is a
substantial number, and thus makes up a good
percentage of an emotion. Given this, this work looks
at the next RoI, that is the mouth. The mouth consists
of 13 action units around it. Going by the results from
the periocular region and the works of Guarnera et. al,
(2015), it could be hypothesized that the mouth region
will prove to be a good region of interest as well. As
a human, it is quite simple to imagine the numerous
emotions in the expression of which, the mouth
plays a major role (such as a smile to convey
happiness, or a frown for disappointment).
Although the eyes and the mouth cover all the AUs
of the face, we still consider the entire face as a
separate region. This is because, a classifier may
wrongly identify the emotion from the face due to
the high dimensionality (as compared to the mouth
and the eye regions) and consequently, overfitting.
Thus, the mouth and the eyes serve as a validator to
the classification done in the face region, and a
corrector when the emotion class from the face
features has been identified wrongly, but those in the
mouth and eye region correctly identify it and agree
with each other.
2.1 Motivation
The motivation to use the three regions of the face
as separate entities, and then choose the emotion
label predicted in the majority of the regions, came
from the fact that not all faces, detected by
machines, or pictures of faces, have completely
visible or illuminated faces. Due to this, many
images cannot be analysed for emotions if the entire
face needs to be scrutinized. Moreover, the
satisfactory results from several research works
provided assurance that the use of separate regions
in the inference of emotions is a feasible experiment
as well as a satisfactory method to be used in case of
partially covered/visible faces. Further, given the
spread of the COVID-19 virus, most public places
see crowds with covered noses, mouths, or faces. In
situations like these, the basic idea behind this study
can prove its worth as a system of facial emotion
recognition for uses in the many areas of
applications.
This study makes use of three regions, which are:
the eyes, the mouth, as well as the entire face. Apart
from this, another major difference with respect to
the earlier study is that we do not focus on
improving the accuracies of classifiers on features
from individual regions of the face; instead, the
focus lies on improving the accuracy of the
classification done by classification technique on the
majority of the regions. In other words, each
classifier is trained and tested on each of the three
regions separately, and for each sample tested, the
emotion detected in the majority of the three regions
is taken as the result. Our focus thus lies on the
accuracy of this result.
Emotion Recognition through Voting on Expressions in Multiple Facial Regions
1039
3 DATASET
The Cohn-Kanade dataset (Kanade and Cohn, 2000),
CK dataset in short, is a benchmark dataset of facial
images used widely in FER and emotion detection
systems. This dataset has been extended since its
introduction, and is presented by the name Extended
Cohn-Kanade dataset (CK+) (Lucey et. al, 2010). In
this study, we make use of the CK+ dataset to identify
emotion labels correlated to the face image. The
dataset has 327 images that are emotion labelled
along with the action units (AUs) observed in the
facial image, and their intensities as well. In each of
the facial images, the action units present and their
respective intensities have been calculated and stored
as a part of the dataset. Each set of action units
corresponds to a different emotion and the degree to
which it is perceived. Emotion coded files provided
in the dataset consist of images that fit the prototypic
definition of an emotion. The emotion label is an
integer that corresponds to each of the 8 emotions.
We use the preprocessed data provided from the peak
expression frames to evaluate the expressions. Since
this work focuses only on a part of the face, we check
for the presence and intensity of only those AUs
which are found in our three regions of interest. The
intensities of the relevant AUs are stored as vectors of
n dimensions as a representation of each image in the
dataset, n being the number of AUs possible in the
region. The subset selection module further ahead
will involve the reduction of the number of AUs being
used to represent an image. From the various AUs and
their intensities found in the faces of the subjects, the
dataset also provides a definition of an emotion in the
form of a combination of various AUs as well as the
intensity with which they are detected in the image.
The experiments done in this study inherently create
such relationships between the AUs belonging to each
RoI (be it the eyes, the mouth or the entire face) and
the image to classify the images correctly.
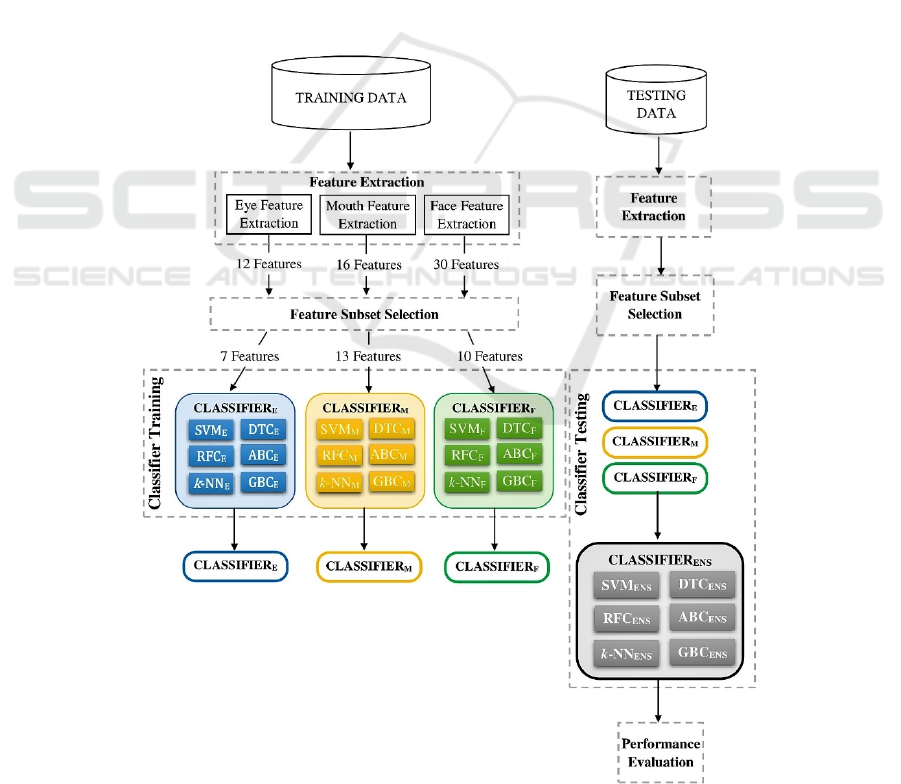
Figure 1: FER System Architecture.
ICAART 2021 - 13th International Conference on Agents and Artificial Intelligence
1040

4 METHODS
The computing approaches and algorithms used in the
proposed work will be discussed in this section
according to the modules designed in the architecture
shown in figure 1.
4.1 Feature Extraction
The features of the areas around the eyes, the mouth,
and those of the entire face were extracted separately.
The term “features” here refers to the Action Units
(AUs), derived from FACS and present alongside the
labelled images in the CK+ dataset. The dataset lists
more than thirty AUs that are found in a human face.
Each of these AUs produce a muscle movement in a
particular region (such as the eyes, mouth, cheeks,
nose, or the jaw) of the face, and some are similarly
involved in more than one such region. To decide
which AU corresponds to which area of the face, and
to further decide whether it lies in the regions of
interest (RoI) of this work, the description of each AU
was checked to see if it was involved in the taxonomy
of the RoI and listed. These listed AUs were then
extracted by reading the text files corresponding to
each image (using scripts, programmed in Python3)
and stored in separate CSV files for each of the RoIs.
The prototype definitions of an emotion, also
described in the dataset, are built from combinations
of these AUs. Thus one of the tasks of this work is to
have classifiers learn such combinations in the RoI
and employ those patterns onto test images to classify
them based on the emotions shown in the picture.
There are instances in the dataset where certain AUs
are not present in some of the images, and yet the
intensity of those AUs is not 0. This is because 0
intensity signifies the existence of the AU but
undefined intensity. Thus, the absent AU intensities
are filled with the mean intensity value of that AU
over all the images in which it is present. The files
also store the emotion labels of each of the images.
The emotion label files consist of a single number in
the exponential format. This is the number
corresponding to each of the eight emotions. Each
such number ranging from 0 to 7 has been assigned to
each of the eight emotions as follows: Neutral (0),
Anger (1), Contempt (2), Disgust (3), Fear (4),
Happiness (5), Sadness (6), and Surprise (7). Due to
the high dimensionality, it is essential to select a
subset of these AUs, for each region, so that further
tests can be carried out more easily. After the
extraction of the features, the serialisation of the
dataset is finally complete by plugging in the absent
AUs in each of the image and for each RoI, with the
mean of the values of that AU in all the face images
of the dataset which show signs of presence of that
AU in the face.
4.2 Feature Subset Selection
Feature Subset selection serves two functions: first, it
reduces the dimensionality of the dataset, which
consequently reduces the chances of overfitting as
well as the computational power and time
requirement. Second, it gives rise to more abstracted
data, finds, and brings out the patterns in the
relationships between the different features and how
they affect the class that the sample belongs to. For
the purpose of feature subset selection in the eye
region, all those features that do not contribute to the
decision of the emotion labels were removed first.
About 5 such AUs were removed, as none of the
images available displayed any of those AUs, leaving
7 features. This seems like a good enough number of
features, and we will leave it at that and further reduce
only if some issue arises with respect to the
dimensionalities.
Feature selection in the mouth region was done in
a similar manner, as in the periocular region. First, out
of the 16 AUs in the mouth region, some AUs were
present in over a hundred images, and most others
were seen in well above 40 images. Three features
were seen in less than 10 images, and these were
discarded as they provided negligible contribution to
the decision of the emotion labels. This left us with
13 features.
Similarly, for the features extracted for the entire
face, only about 24 AUs from the 30 mentioned
earlier, were available in the labelled images of the
dataset. Since 24 is too high a number compared to
the 7 features that we have chosen for the eyes and
the 13 for the mouth region, the data of these 24 AUs
was run through the Principal Components Analysis
(PCA) (Pedregos et. al, 2011), and reduced to 10.
Reducing to seven, as we did for the mouth region,
does not seem ideal as it could lead to loss in data.
However, it can not be guaranteed that these 10
features do not show any loss either. It is however, a
cause of concern to use data of a larger dimension, as
it tends to lead to overfitting and gives highly
unsatisfactory results when tested; moreover, keeping
in mind the small size of our dataset (327 samples), it
is important that we maintain an optimal
dimensionality.
All of the above processes have been carried out
in Python 3, using the Scikit-Learn package (Abdi
and Williams, 2010) that provides implementations
of the methods such as PCA and SVD (Golub and
Emotion Recognition through Voting on Expressions in Multiple Facial Regions
1041
Rensch, 1971), among others. The dimension
reduction was a result of the Singular Value
Decomposition (SVD) as part of the PCA process
(Wall et. al, 2003). PCA also helped in finding the
hidden relationships and patterns between the various
features that are a part of our dataset. Thus it has also
provided us with the liberty of exploiting these hidden
patterns during the classification process, for better
labelling performance.
4.3 Algorithm Experiments
In this section, we discuss several classification
techniques and their performance on the dataset made
from the previous two modules. Each classification
algorithm is run on all three regions of the face that
we are considering (eyes, mouth, entire face) and
tested on the same test set for each of them. For each
sample in the test set, the predictions obtained for
each of the regions is noted and the emotion label
decided by the experiment majority of the three
regions is chosen as the final prediction for the
sample. This prediction is then checked with the
actual emotion label and the accuracy score is
calculated. The dataset is split into 5 stratified splits.
Each classifier is trained on each RoI 5 times, each
time using one of the splits (that is, 20% of the data)
as the test set and the rest of the splits (80%) as the
training data. Thus, each split is used as a test set one
time, and as a part of the training set 4 times. This
results in 5 accuracy scores for each of the classifiers.
The final performance score is taken as the average of
these 5 accuracy scores, and the classifiers are
compared on this performance criterion. Experiments
were carried out using the following 6 classification
techniques:
▪ Support Vector Machine/Classifier (SVM),
▪ Random Forest classifier (RFC),
▪ k-Nearest Neighbours (k-NN) classifier
▪ Decision Tree Classifier (DTC)
▪ AdaBoost Classifier (ABC)
▪ Gradient Boost Classifier (GBC)
Since there are 3 RoIs, each Classifier is trained
on each of the regions separately. The dataset is split
into 5 stratas, and each of the splits are used as a test
set once, for each classifier. Which means that there
are a total of 15 classifier training processes for each
classifier. The predictions of the classifiers from each
of the three regions gives a majority labelling (in
some cases, there may be no such labelling to which
the majority of the predictions out of the three belong)
and an accuracy percentage of these majority labels
are noted. 5 such labellings are produced, one for each
strata as the test set. The average accuracy of these 5
labellings are taken as the performance score of the
classifier.
4.3.1 Support Vector Classification
For the SVM classification, we used the parameters
gamma = 1 and C = 2, which were a result of some
careful parameter turning. when using the Radial
Basis Function kernel. Using these parameters, and
following the procedure of majority voting, the
results obtained are as shown in Table 1.
Table 1: Results with SVM classifier.
Test no. E
y
es Mouth Face Ma
j
orit
y
1 74.24 92.42 81.81 86.36
2 66.67 87.88 86.36 86.36
3 74.42 84.85 83.33 84.85
4 66.67 90.91 83.33 83.33
5 69.70 84.85 89.39 90.90
Each of the rows in Table 1 denote the use of one
of each of the 5 sets that the dataset was split into. The
average of the accuracy scores given in the Majority
column came out to be 86.36%. The average score of
just the face region came out to be 84.44%, the eyes
70.34% and the mouth gave a score of 88.10%. It
seems like the majority voting system performance
falls behind that of just the mouth region when using
the SVM classifier.
4.3.2 Random Forest Classification
Random Forest classification was used with Gini
Impurity, and 20 estimators which were a result of
manual parameter tuning. Following the majority
voting procedure on all the 5 stratas of the dataset as
the test set one-by-one, using the RFC, the following
results were obtained as in Table 2.
Table 2: Results with RFC.
Test no. Eyes Mouth Face Majority
1 66.67 98.48 84.85 89.40
2 69.70 95.45 84.85 89.40
3 77.27 93.94 87.88 92.42
4 72.73 95.45 84.85 93.94
5 71.21 98.48 89.40 95.45
The RFC gave an average performance score of
92.12% through majority voting procedure. The
average performance in the eye region was 71.52%,
in the mouth region was 96.36%, and that in just the
face was 86.36%. Here as well, it looks like the
performance in the mouth region surpassed that from
the majority voting technique.
ICAART 2021 - 13th International Conference on Agents and Artificial Intelligence
1042
4.3.3 k-Nearest Neighbours Classification
The k-NN classification process using Euclidean
distance measure involved a search over the value of
k (in the term k-nearest), with the number of
neighbours chosen as 7. All the data points were
uniformly weighted when calculating the k-
neighbours. The results were obtained from the
majority voting on all 5 splits, as shown in Table 3.
Table 3: Results with K-NN.
Test no. Eyes Mouth Face Majorit
y
1 71.21 87.88 87.88 86.36
2 75.76 95.45 92.42 92.42
3 57.58 86.36 78.79 78.79
4 65.15 92.42 89.39 87.88
5 74.24 86.36 83.33 83.33
The average performance score obtained is
85.76%. Again, the best performance was seen in the
mouth region, with an average of 89.69%, followed
by the face region with 86.36% and the eyes with a
score of 68.79%. k-NN does not seem to have
performed nearly as well as the RFC.
4.3.4 Decision Tree Classifier
The Decision Tree Classifier (DTC) seemed to have
performed only decently well, close to the
performances of the k-NN and the Support Vector
Classification techniques, with an average 84.40% as
seen in Table 4.
Table 4: Results with DT classifier.
Test no. E
y
es Mouth Face Ma
j
orit
y
1 69.70 83.40 83.33 84.85
2 71.21 89.40 80.30 84.85
3 72.73 89.40 78.79 89.40
4 66.67 92.42 78.79 81.82
5 65.15 86.36 71.21 81.82
Here as well, the mouth region showed the best
performance of the classifier, at an average score of
88.20%, followed by the face region with a
performance of 78.48%, and the eyes showed an
average score of 69.09%.
4.3.5 AdaBoost Classifier
The AdaBoost Classifier, using the Decision tree as
the base estimator, was tuned and then trained with
30 decision tree estimators, and a learning rate of 0.05
as parameters, giving rise to the results as shown in
Table 5.
Table 5: Results with AdaBoost classifier.
Test no. E
y
es Mouth Face Ma
j
orit
y
1 54.45 92.42 62.12 80.30
2 78.79 86.36 50.00 80.30
3 46.97 86.36 60.60 72.73
4 37.88 65.15 65.15 71.21
5 75.76 59.09 63.64 69.70
The average performance of the classifier
according to our performance scoring is around
74.85%, which is quite unsatisfactory considering the
better performances observed in the last 4 classifiers.
The performance of the classifier in the mouth and
eye region showed a lot of fluctuation, which is
enough reason to be skeptical about its performance.
The classifier showed an accuracy of 77.88% in the
mouth region, 58.77% on the eyes, and 60.30% on the
entire face.
4.3.6 Gradient Boost Classifier
The Gradient Boost Classifier showed the best
performance score out of all the classifiers, with an
average of 94.84%, as can be seen from the Table 6.
Table 6: Results with GBC.
Test no. E
y
es Mouth Face Ma
j
orit
y
1 80.30 93.94 83.33 90.90
2 75.76 98.48 84.85 93.94
3 71.21 99.98 90.90 95.45
4 75.76 96.97 89.40 95.45
5 78.79 98.48 92.42 98.48
The classifier was trained with a learning rate of
0.0125, with 50 base estimators, and at maximum,
considers only
√
𝑑
features for deciding the best split,
where d is the number of features in our data. The
Gradient Boost Classifier showed a performance of
97.57% in the mouth region, 88.18% in the face
region, and 76.36% in the eye region. Here as well,
the classifier performs the best with the features of the
mouth.
5 DISCUSSION
The tests above display some good results when it
comes to seeing which method of classification
provides the best results. The performance scoring
system laid down helps in quantifying the results so
that the classifiers can be compared, added to the fact
that the stratified splits being used as the test set one
by one, results on each split helped in validating the
results shown by the classifier on other splits. This is
Emotion Recognition through Voting on Expressions in Multiple Facial Regions
1043
because it is possible that a single experiment can
have some extraordinary samples and might provide
misleading results about the performance of the
classifier.
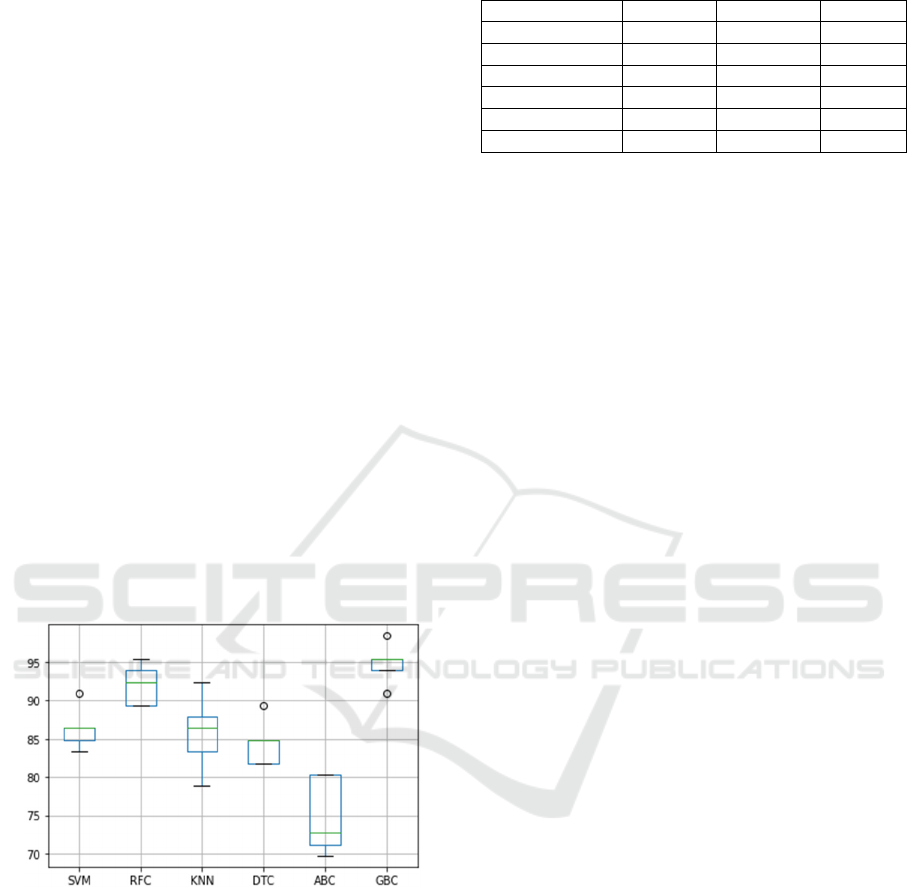
The box plot in Fig 2 gives an idea of the
comparison between the classifiers. The Y-axis
denotes the performance scores in percentage, and the
X-axis shows the classifiers used.
It is quite apparent that the Gradient Boost
Classifier performs significantly better than any of the
other classifiers, with a score of 94%, but closely
followed by the Random Forest Classifier with an
average performance of 92%. Three other classifiers,
Support Vector Machine, k-Nearest Neighbours, and
the Decision Tree classifiers performed similarly
well, with their performance scores lying closely in
the range of 84-86%. Following these in the ranks, is
the AdaBoost Classifier with a score close to 75%. It
is thus obvious, that in case of facial emotion
recognition systems that use separate regions of the
face to detect an emotion, the Gradient Boost
Classifier will serve its purpose much better than
other classifiers. Further, in comparison to works of
study of facial emotion recognition systems such as
(Sebe et. al, 2002), where the entire face is used to
find the emotion being displayed, our method
provides a better performance and shows potential of
usage in different scenarios.
Figure 2: Performances of all the Classification Techniques.
As an additional result, an observation can be made
based on the performance of each of the 6 classifiers
in the three regions, as shown in Table 7. This result
shows that the best classification took place in the
mouth region. Moreover, though GBC is the best in
all three regions, SVM, RFC, and k-NN also yield
comparable and promising results. When designing a
Emotion recognition system with respect to a
particular region of the face, this would serve as a
guideline for designers to make better decisions on
which classification approach to deploy.
Table 7: Average Classifier performances in each region.
Classifie
r
E
y
es Mouth Face
SVM 70.34 88.10 84.44
RFC 71.52 96.3
6
86.36
k
-NN 68.79 89.69 86.3
6
DTC 69.09 88.20 78.48
ABC 58.77 77.88 60.30
GBC 76.36 97.57 88.18
Apart from the results of the experiment that we have
focused on, there was also another observation made.
In most cases, the classifiers excelled in classifying
images using the features belonging to the mouth area
alone. Although this is not the main focus of the work,
it happens to be a finding that can prove useful for
other studies in the future.
6 CONCLUSION AND FUTURE
DIRECTIONS
Research works in the field of facial emotion
recognition generally focus on one region of the face,
with the majority of them being involved with the
various features of the entire face. This venture,
taking into account multiple regions of the face is a
fairly unique approach, and seems to bring enhanced
results as compared to classification based on
individual regions of the face. The majority voting
technique brought out better performance in each
classification approach, as the use of multiple regions
allowed a sort-of “validation” of results from one
region with those of other regions. This technique,
although computationally intensive than techniques
using just one region (due to repetition of the training
and testing processes multiple times, once for each
region), provides results that are much more
satisfactory than the accuracies of the latter. The
findings of this work can be utilized to design
intelligent systems based on facial emotion
recognition during the pandemic and post pandemic
era as most people will be covering their faces with
masks, partial face shields and veils.
This work has a good amount of scope for
improvement. Using a dataset bigger than the CK+
dataset will help, by having more number of stratified
splits and thus, more observations of the performance
accuracies to average. However, finding a dataset as
comprehensive and well labeled as the CK+, proved
to be quite difficult. Furthermore, since this was an
initial study, there is much scope for improvement in
terms of methods used for experiments, such as
making use of Deep Learning techniques like Neural
Networks, etc. in further work on this idea.
ICAART 2021 - 13th International Conference on Agents and Artificial Intelligence
1044

REFERENCES
Abdi, H., & Williams, L. J. (2010). Principal component
analysis. Wiley interdisciplinary reviews:
computational statistics, 2(4), 433-459.
Agrawal E., Christopher J. (2020) Emotion Recognition
from Periocular Features. In: Machine Learning, Image
Processing, Network Security and Data Sciences.
MIND 2020. Communications in Computer and
Information Science, vol 1240. Springer, Singapore.
Alonso-Fernandez, F., Bigun, J., & Englund, C. (2018).
Expression Recognition Using the Periocular Region:
A Feasibility Study. In 14th International Conference
on Signal-Image Technology & Internet-Based
Systems.
Ekman, R. (1997). What the face reveals: Basic and applied
studies of spontaneous expression using the Facial
Action Coding System (FACS). Oxford University
Press, USA.
Golub, G. H., & Reinsch, C. (1971). Singular value
decomposition and least squares solutions. In Linear
Algebra (pp. 134-151). Springer, Berlin, Heidelberg.
Guarnera, M., Hichy, Z., Cascio, M. I., & Carrubba, S.
(2015). Facial expressions and ability to recognize
emotions from eyes or mouth in children. Europe's
journal of psychology, 11(2), 183.
Kanade, T., Cohn, J. F., & Tian, Y. (2000, March).
Comprehensive database for facial expression analysis.
In Proceedings Fourth IEEE International Conference
on Automatic Face and Gesture Recognition (pp. 46-
53). IEEE.
Küçük, D., & Can, F. (2020). Stance detection: A survey.
ACM Computing Surveys (CSUR), 53(1), 1-37.
Lucey, P., Cohn, J. F., Kanade, T., Saragih, J., Ambadar,
Z., & Matthews, I. (2010, June). The extended cohn-
kanade dataset (ck+): A complete dataset for action unit
and emotion-specified expression. In 2010 ieee
computer society conference on computer vision and
pattern recognition-workshops (pp. 94-101). IEEE.
Pedregosa, F., et al (2011). Scikit-learn: Machine learning
in Python. The Journal of machine Learning research,
12, 2825-2830.
Sebe, N., Lew, M. S., Cohen, I., Garg, A., & Huang, T. S.
(2002, August). Emotion recognition using a cauchy
naive bayes classifier. In Object recognition supported
by user interaction for service robots (Vol. 1, pp. 17-
20). IEEE.
Wall, M. E., Rechtsteiner, A., & Rocha, L. M. (2003).
Singular value decomposition and principal component
analysis. In A practical approach to microarray data
analysis (pp. 91-109). Springer, Boston, MA.
Emotion Recognition through Voting on Expressions in Multiple Facial Regions
1045
