
3D Object Detection with Normal-map on Point Clouds
Jishu Miao, Tsubasa Hirakawa, Takayoshi Yamashita and Hironobu Fujiyoshi
Chubu University, 1200 Matsumoto-cho, Kasugai, Aichi, Japan
Keywords:
Object Detection, Deep Learning, Point Cloud Processing, Autonomous Vehicles.
Abstract:
In this paper, we propose a novel point clouds based 3D object detection method for achieving higher-accuracy
of autonomous driving. Different types of objects on the road has a different shape. A LiDAR sensor can
provide a point cloud including more than ten thousand points reflected from object surfaces in one frame.
Recent studies show that hand-crafted features directly extracted from point clouds can achieve nice detection
accuracy. The proposed method employs YOLOv4 as feature extractor and gives Normal-map as additional
input. Our Normal-map is a three channels bird’s eye view image, retaining detailed object surface normals. It
makes the input information have more enhanced spatial shape information and can be associated with other
hand-crafted features easily. In an experiment on the KITTI 3D object detection dataset, it performs better
than conventional methods. Our method can achieve higher-precision 3D object detection and is less affected
by distance. It has excellent yaw angle predictability for the object, especially for cylindrical objects like
pedestrians, even if it omits the intensity information.
1 INTRODUCTION
With the continuous development of autonomous
driving technology, it will be possible to achieve
higher levels of autonomous driving in the near fu-
ture. All autonomous driving functions cannot be
separated from the rapid development of computer
vision and deep neural networks. The sensors cur-
rently equipped on autonomous vehicles are cameras,
LiDARs, and radars. The information about the sur-
rounding environment can be continuously captured
and transmitted to the computer through these sen-
sors. An autonomous vehicle can sense its surround-
ings and make correct operations.
LiDAR sensors emit pulsed light waves into the
surrounding environment and receive the reflected
points from object surfaces, which we call point
clouds. Thus more than ten thousand points of infor-
mation, including 3D coordinates and reflection in-
tensities, can be obtained. Unlike RGB images, the
significant advantages of point clouds are that they
have obvious 3D spatial structure features and include
reflection features about the surface of the object.
Autonomous vehicles need to have high-accuracy
detection based on the sensors’ information in a very
short time. Object detection and classification based
on deep learning are two crucial tasks that affect au-
tonomous driving safety. The current mainstream
object-detection method involves predicting the 2D
bounding box’s position, size, and class from images
using region proposal networks (RPN) (Ren et al.,
2015). This excellent object detection method can
provide high-accuracy detection results while main-
taining processing speed.
Point cloud is enormous and discontinuous, and
there are currently various processing methods for ex-
tracting the hidden information in point cloud. The
current method is to input processed information into
a convolutional neural network then detect an object
by using an RPN to identify object location and clas-
sification labels for the surrounding environment.
For further improvement of object detection ac-
curacy, we propose a method based on Normal-map.
This method includes the following characteristics. A
normal is an object perpendicular to the given sur-
face. Based on the spatial position information hid-
den in a point cloud, a normal can be estimated then
used as the processed information to predict a 3D
bounding box and classification labels through the
convolutional neural network (CNN). There are sig-
nificant shape differences between car bodies and cy-
clists. Moreover, roads and buildings have regular
shapes, thus almost the same surface normals. Our
method extracts powerful spatial information from
point clouds while reducing the dimensions of the
cloud.
Miao, J., Hirakawa, T., Yamashita, T. and Fujiyoshi, H.
3D Object Detection with Normal-map on Point Clouds.
DOI: 10.5220/0010304305690576
In Proceedings of the 16th International Joint Conference on Computer Vision, Imaging and Computer Graphics Theory and Applications (VISIGRAPP 2021) - Volume 5: VISAPP, pages
569-576
ISBN: 978-989-758-488-6
Copyright
c
2021 by SCITEPRESS – Science and Technology Publications, Lda. All rights reserved
569
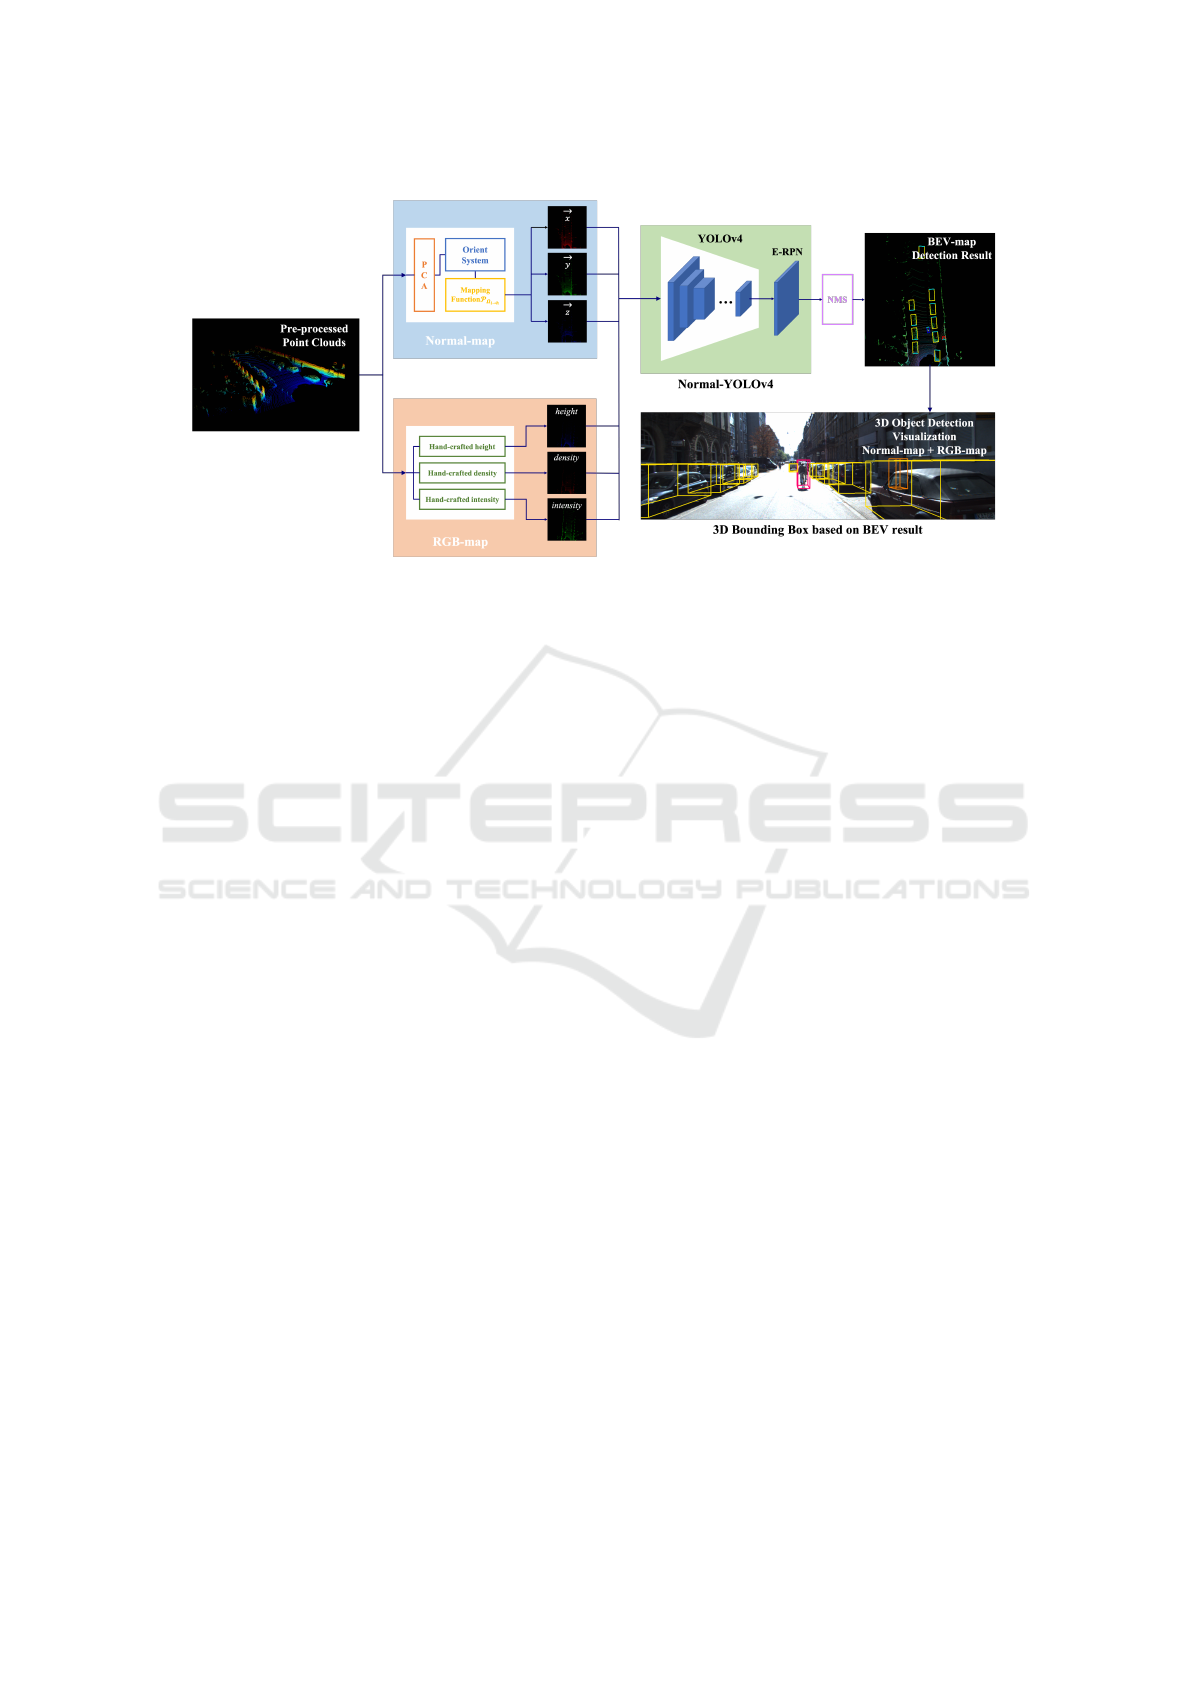
Figure 1: Overview of the proposed method. Our method detects 3D objects by using YOLOv4 + Euler-Region Proposal
Network (E-RPN). The input feature is a combination of Normal-map and RGB-map (see Section 3.1) to improve the precision
of 3D object detection, especially for cylindrical objects.
The contributions of this paper are as follows:
• We introduce a well-designed normal estimation
pipeline, extract estimated surface normals to
Normal-map, integrate it into the whole system as
additional input.
• With the addition of Normal-map, input infor-
mation is enhanced. We show that Normal-map
can achieve better object detection accuracy and
maintain stable performance on objects in differ-
ent levels of difficulty.
• The proposed method has the potential to com-
pensate for the effects of a lack of reflection in-
tensity. Under a no-reflection intensity condition,
it can still achieve high-precision object detection.
2 RELATED WORK
2.1 2D Object Detection
The CNN can achieve high-precision 2D object detec-
tion based on a single image. There are two types of
object detection approaches. The first type is a two-
stage detector: Regions with CNN feature (R-CNN)
(Girshick et al., 2014), Fast R-CNN (Girshick, 2015),
and the newest one called Faster R-CNN (Ren et al.,
2015) with a 12-fold improvement in detection speed.
Two-stage detectors have a low error detection rate
and low missing rate.
Another type is a one-stage detector: it inferences
the classification scores, and bounding boxes of ob-
jects, and the final detection result can be obtained
directly through only one phase. Therefore, com-
pared with two-stage detectors, they have a faster
detection speed, the most typical one-stage detec-
tors are SSD (Liu et al., 2016), and YOLO (Red-
mon et al., 2016)(Redmon and Farhadi, 2017)(Red-
mon and Farhadi, 2018)(Bochkovskiy et al., 2020).
These methods have laid the foundation to make it
possible for real-time object detection.
2.2 3D Object Detection
Due to the need for autonomous driving, it is impor-
tant to perform real-time 3D object detection. Based
on the important feature of a point cloud containing
3D spatial structure information, there is an increas-
ing number of 3D object detection methods depend-
ing on the type of deep learning network’s input, i.e.
point cloud (Shi et al., 2019), voxel (Simon et al.,
2019), or image (Beltr
´
an et al., 2018).
MV3D (Chen et al., 2017) involves two types of
point cloud processes. One is to construct a bird’s eye
view (BEV) image. Each pixel is the highest point
in the grid. Each layer of a grid is used as a chan-
nel, then intensity and density values are added. The
other type is to construct a front view (FV) image.
The point cloud is projected into the cylindrical coor-
dinate system, then rasterized to form 2D grids in the
cylindrical coordinate, then construct height, intensity
and density channels are constructed. The accuracy
of this method is high, but due to the large amount of
calculation, the processing speed is only 2.8 fps.
Complex-YOLO (Simony et al., 2018) is a method
focused on the efficiency, that has the same point
cloud process as the first one of MV3D (Chen et al.,
2017). The point clouds are only converted into three
VISAPP 2021 - 16th International Conference on Computer Vision Theory and Applications
570
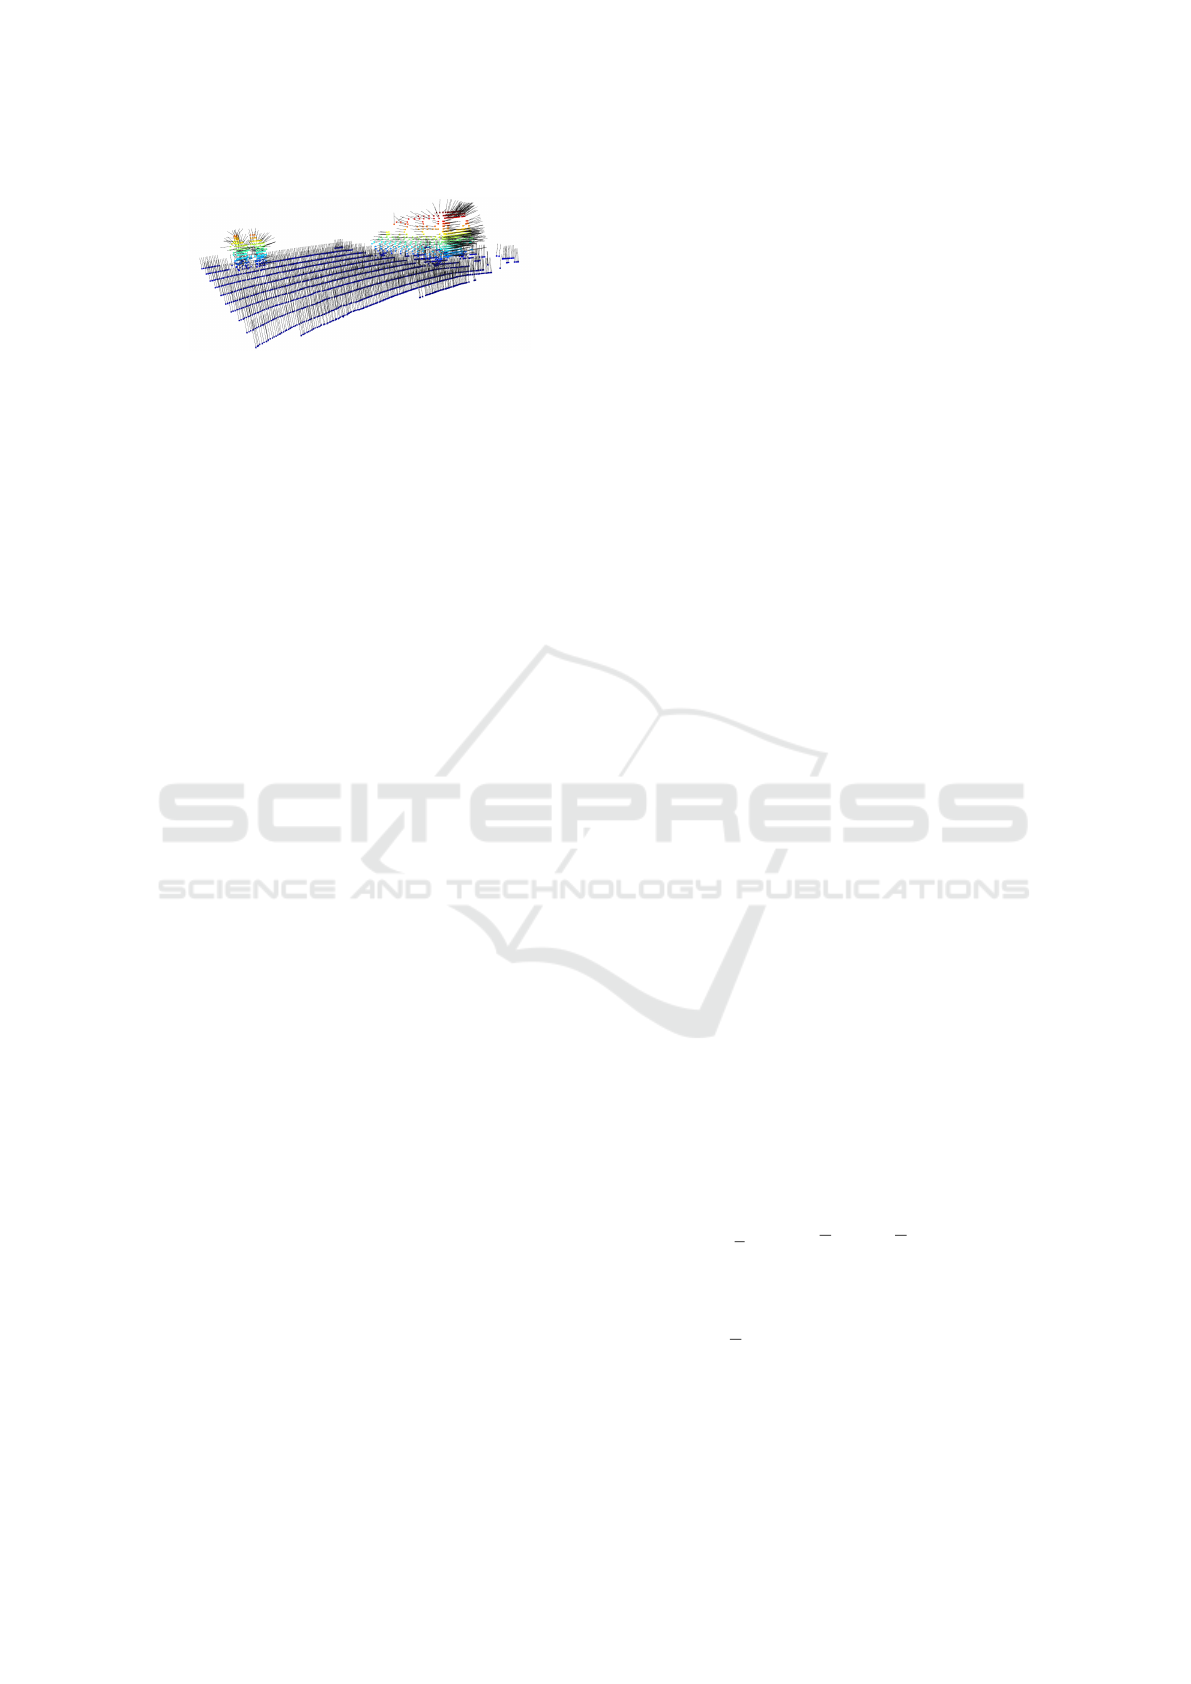
Figure 2: Surface normals estimated from point clouds.
channels BEV images (called as RGB-map), which
are put into YOLOv2, just like with RGB images. It
detects objects only in the BEV image then increases
the dimension and angle in the final regression vari-
able, which solves the problem of 3D object detection
and ensures real-time processing speed at the same
time.
2.3 Surface Normal Estimation
The surface normal is an important property of the
geometric surface and often used in many areas. If a
geometric surface is given, it is usually easy to esti-
mate the normal of a point on this surface as a vector
perpendicular to the surface located on that point. A
point cloud is composed of thousands of points re-
flected back from the surface of an object, therefore it
is a precise record on the shape of the object.
There is a well-known method for estimating sur-
face normals on point clouds. It involves estimating
surface normals directly from the point cloud using
approximation. Liu et al. proposed a normal es-
timation method (Ran et al., 2013) for point cloud.
It speeds up the searching process by using the kd-
tree tree data structure (Merry et al., 2013) to find the
neighbor field. The normal estimation by kd-tree is
robust. Wang et al. (Wang and Siddiqi, 2016) proved
that adding first and second-order features such as sur-
face normal and curvature is helpful in improving the
object detection performance.
Open3D (Zhou et al., 2018) is an open-source li-
brary that supports the rapid development of software
that handles 3D data. We used the Open3D library to
estimate correct and regular surface normals directly
from a point cloud.
3 PROPOSED METHOD
This study focuses on further improvement of the ac-
curacy of 3D object detection on point clouds. Our
3D object detection method is based on surface nor-
mals as they are important spatial information. This
method not only simply extracts point clouds but also
extracts object surface shape information to Normal-
map by normal estimation. Through increasing the
amount of input information and using the YOLOv4
network, the accuracy of 3D object detection is fur-
ther improved.
3.1 Point Cloud Processing
Different from object detection on RGB images, point
clouds are sparse, and a huge amount of computation
is necessary if the point clouds are directly input to a
convolutional neural network. Therefore, we generate
hand-crafted BEV-map in two ways for each frame of
point clouds. Based on the surface normal estimation
of point clouds, and inspired by MV3D (Chen et al.,
2017), we created a 3 channel BEV RGB-map by ex-
tracting values from point cloud.
Since both YOLOv3 (Redmon and Farhadi, 2018)
and YOLOv4 (Bochkovskiy et al., 2020) exhibit ex-
cellent detection performance at an input size of 608,
the BEV grid map size is defined as (608 ×608) and
set the LiDAR position as the origin of the Cartesian
coordinate system as follows:
P
Ω
= [x, y,z]
T
(1)
The select points within an area of 50 m long and
50 m wide (i.e, x ∈[0,50] and y ∈[−25,25]). Consid-
ering that the LiDAR sensor is located at 1.73m, we
set the range of z axis to [−2.73, 1.27], so that it can
cover all objects within a height range of about 4m
from the ground. Based on the above settings, each
pixel of the BEV image can carry information within
the actual 50meter/608 = 8cm range.
3.1.1 Normal Estimation
We estimate the surface normals to hold as much of
the object shape features as possible for the point in
this area. We use an approximate method to estimate
normals directly from the point cloud. The normal of
a point will be inferred from its surrounding points.
The surface normal is brought by principal com-
ponent analysis (PCA) of the covariance matrix C cre-
ated from the nearest neighbors of the target point p
i
.
C =
1
k
k
∑
i=1
(p
i
−p) ·(p
i
−p)
T
(2)
C ·~v
j
= λ
i
·~v
j
, j ∈ {0, 1,2} (3)
Here, k is the number of neighbor points consid-
ered near p
i
, p is the nearest 3D centroid, λ
j
is the
eigenvalue of the covariance matrix in j, and ~v
j
is the
eigenvector of j. If 0 ≤ λ
0
≤ λ
1
≤ λ
2
, the eigenvec-
tor v
0
of the smallest eigenvalue λ
0
is the approximate
value of normal vector ~n.
3D Object Detection with Normal-map on Point Clouds
571
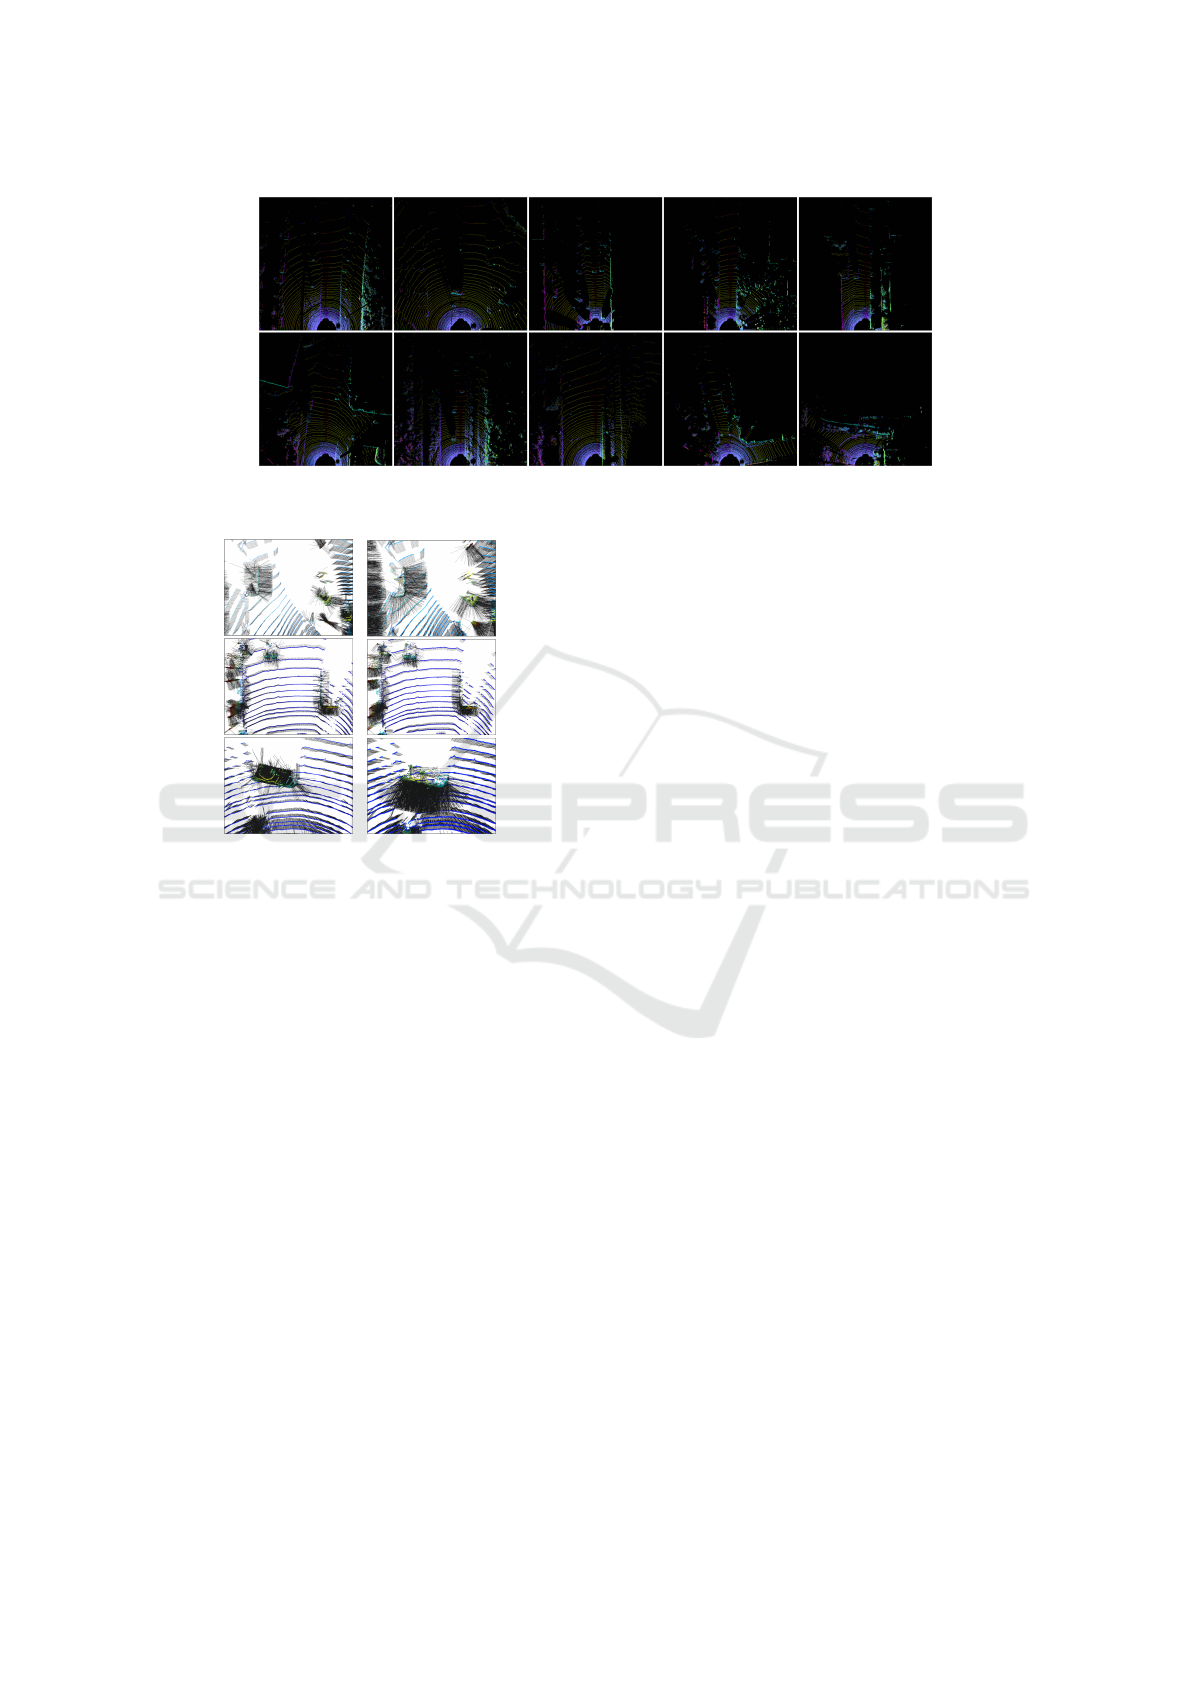
Figure 3: The Visualization of Normal-map. A 2D BEV feature map based pseudo-image contains the 1st-order features
(surface normal) of objects.
(a) Raw Normal (b) After Orient
Figure 4: Align results of Orient System in BEV.
Considering the efficiency of directly finding
neighbor points, we use the kd-tree algorithm, a data
structure known for high computation efficiency.
In this study, we set the searching range of the
normal estimation to 30 cm and search for a maxi-
mum of 50 points near the target point. Due to this
setting, under a resolution of (608 ×608), the normal
vector (1st-order feature) actually overcomes the lim-
itations of the 0th-order features which are limited by
the representation range (8cm/pixel). It is possible to
present surface normals beyond the pixel range.
3.1.2 Camera Relative Coordinate System
Without knowing the object geometric structure, a
normal vector generally has two directions and are
both correct. This kind of randomness would confuse
the convolutional neural network to a certain extent.
For consistent orientation of a point cloud, it is neces-
sary to satisfy:
~n
i
·(v
p
−p
i
) > 0 (4)
In order to solve this problem, we designed a nor-
mal orient system for ensuring the consistency of the
final normal vector:
• Orient System: It follows the actual state of point
clouds, which are emitting and reflecting back to
the LiDAR. Since LiDAR is set at an altitude of
1.73m above the ground, we orient all normal vec-
tors toward (0, 0,0) in LiDAR coordinate.
Some examples of orient system’s output is shown
in Fig. 4. Comparing with the raw normals in Fig.
4(a), there are more consistent normals after orienting
by the camera relative coordinate system in Fig. 4(b).
3.1.3 Generate Normal-map
The estimated normal is a set of 3D unit vector con-
taining (~x,~y,~z). In this study, we converted normal
vectors into a 2D BEV pseudo-image, which we call
Normal-map. The mapping function S
j
= f
P S
(P
Ωi
,g)
is used for mapping each point into a specific grid cell
S
j
of Normal-map, which describes all the points in
P
Ωi→j
:
P
Ωi→j
= {P
Ωi
= [x, y,z]
T
|S
j
= f
P S
(P
Ωi
,g)} (5)
Through this, we only keep the point with the biggest
z value, the P
Ω j→h
describes every highest point in
each grid cell at range[0, 4] meter. We then extract
each point’s normal vector from P
Ω j→h
to nor mal
~x
,
normal
~y
, normal
~z
by axis.
normal
~x
(S
j
) =~x(P
Ω j→h
),
normal
~y
(S
j
) =~y(P
Ω j→h
),
normal
~z
(S
j
) =~z(P
Ω j→h
).
(6)
In normal-map, each channel indicates the normal
vector of the highest point in the grid cell, correspond-
ing to that channel. Besides, the 0th-order feature
maps: density, intensity, and height map of RGB-map
are also extracted.
z
r
(S
j
) = min(1.0,log(N + 1)/64),N = |P
Ωi→j
|
z
g
(S
j
) = max(P
Ωi→j
·[0,0, 1]
T
)
z
b
(S
j
) = max(I(P
Ωi→j
)
(7)
VISAPP 2021 - 16th International Conference on Computer Vision Theory and Applications
572
Figure 5: Normal-YOLOv4 network architecture.
Thus, there are 4 hand-crafted pseudo-images: in
Normal-map, normal
~x
, normal
~y
, normal
~y
encodes
normal vectors (~x,~y,~z); In RGB-map, z
r
is the nor-
malized density of all points in S
j
, z
g
is the maximum
height, and z
b
is the maximum intensity.
3.2 Network Input
We will not lose any information for separating 3D
normal vectors into three channels. An RGB image
is composed of three RGB channels, as does Normal-
map. Normal-map can represent spatial geometric in-
formation when three channels are combined, just like
in RGB images. The benefit of this is that the Normal
can combine with other BEV feature maps and ap-
ply 2D convolution. We combine Normal-map with
RGB-map at the object detect network’s first layer as
input images. Thus, the network input will be a n-
dimensional array depending on the combination of
BEV-maps.
3.3 Network Architecture
Our Normal-YOLOv4 object detection network em-
ploys the YOLOv4 (Bochkovskiy et al., 2020) to ex-
tractor features from the input BEV-map, extended
it by an Euler-Region Proposal Network (E-RPN) to
regress angle and detect multi-class 3D objects.
As shown in Fig. 5, the input is a n-dimensional
(608 ×608) 2d-pseudo image, the n is depend on the
channels of the BEV-map combination. Then neck
outputs the multi-scale feature maps to the head in
size: (76×76×256), (38×38×512), and (19×19 ×
1024). The head is based on YOLOv3, and added E-
RPN as the extension, giving network the ability to
accurately predict object angles. The head finally pre-
dicts a 10 dimensions output for each box: object po-
sition (t
x
,t
y
), object dimensions (t
w
,t
l
), object angles
(t
im
,t
ie
), as well as probability p
0
, class scores p
1
, p
2
,
p
3
.
In each grid cell, we predict three boxes resulting
in 30 features each. The object angle is calculated as
arctan(t
im
,t
re
). Due to the height is not as important as
other information in the autonomous driving, we use
a predefined height h to build 3D bounding box for
conserving computational resources. Thus, Normal-
map would not affect the prediction of height directly.
3.4 Loss Function
In Normal-YOLOv4, YOLOv3 is used as the head as
same as the YOLOv4. In this study, the loss func-
tion is Mean-square Error (MSE), which is based on
YOLOv3, and the angle loss calculation is added for
angle regression. Since the network is a combination
of YOLOv4 and E-RPN, the entire loss function is
presented as follows.
L = L
YOLO
+ L
E−RPN
(8)
L
E−RPN
= λ
coord
S
2
∑
i=0
B
∑
j=0
1
i
j
ob j
[(t
im
−
ˆ
t
im
)
2
+(t
re
−
ˆ
t
re
)
2
]
(9)
Therefore, The yaw can be calculated as
arctan(Im, Re) and adjust all the parameters contin-
uously through back-propagation.
4 EXPERIMENTS
In this section, we evaluate the performance of the
proposed method on the KITTI benchmark for bird’s
eye view. Our ablation studies compare the object de-
tection precision of Normal-map with RGB-map in
different Intersection over Union (IoU) threshold and
distance. We also evaluate the accuracy of the model
in predicting the yaw angle by adding an included an-
gle function.
4.1 KITTI Dataset
There are three types of KITTI object detection eval-
uation (Geiger et al., 2012): 2D, 3D and BEV. For the
proposed method, we chose dataset both point clouds
and left color images data. It contains 7481 frames
training data including annotated ground truth and
7518 frames testing data without public ground truth.
All the data were randomly disrupted and the previ-
ous and next frames were not from the same scene.
We use only point cloud for object detection and the
color images for visualizing the results.
4.2 Training Details
The training data is split in a ratio of 4 : 1. There
are 6000 samples in training data were only used for
the network training, and the remaining 1481 sam-
ples with their ground truth labels were for validation
3D Object Detection with Normal-map on Point Clouds
573
Table 1: Evaluation Results for Bird’s eye view Performance on the KITTI Benchmark (Test data).
Method
Car AP (%) Pedestrian AP (%) Cyclist AP (%)
mAP (%)
FPS Easy Mod. Hard Easy Mod. Hard Easy Mod. Hard
BirdNet 9.1 84.17 59.83 57.35 28.20 23.06 21.65 58.64 41.56 36.94 45.93
Complexer-YOLO 16.7 77.24 68.96 64.95 21.42 18.26 17.06 32.00 25.40 22.88 38.68
Ours 5.5 72.84 71.52 67.50 26.71 21.19 20.17 42.50 36.06 31.18 43.30
Table 2: Performance of models with different sets of inputs.
Hand-crafted features Classes AP mAP
Input Normal-map RGB-map Car Pedestrian Cyclist (%)
(~x,~y,~z) density height intensity (%) (%) (%) IoU 50
RGB -
√ √ √
96.26 76.83 90.10 87.73
Normal
√
- - - 97.78 71.57 89.28 86.21
Normal+RG
√ √ √
- 97.38 78.58 91.18 89.05
Normal+RGB
√ √ √ √
96.90 85.57 94.50 92.325(↑4.60)
and the evaluation of ablation study. We regarded
both “Cars” and “Vans” as Cars and both “Pedes-
trian” and “Person (sitting)” as Pedestrians. So that
the network would learn how to classify three classes:
Cars, Pedestrian and Cyclists. Model was trained
from scratch using the Adam optimizer. The cosine
decay is applied to the learning rate.
Based on the Bag of freebies (BoF) of YOLOv4’s
backbone, data augmentation (i.e. including horizon-
tal flip, scaling, random crop, mosaic and random
padding) is applied for the input 2D BEV pesudo-
images during network training. It enriches the num-
ber of datasets but would not change the connection
between pixels and values on BEV-map. In abla-
tion study, all experimental sets were trained in 200
epochs, making the results reliable enough.
4.3 Network Performance
The prediction results of the official test set are eval-
uated by the KITTI Vision Benchmark Suite for BEV
benchmark. We focus on the BEV performance of the
proposed method.
As shown in Table 1. The proposed method (Ours)
achieves 72.84% for class Car in Easy difficulty, and
guarantee 67.50% in Hard difficulty at the same time.
Facing the objects of the same category but different
difficulty, the addition of surface normal makes the
detecting more robust, especially for the objects with
regular surface shapes like cars.
Based on the statistics provided by the KITTI
leaderboard, we compare the proposed method to
two state-of-the-art methods. Compared to BirdNet
(Beltr
´
an et al., 2018), a BEV-based object detection
network, proposed method demonstrates better detec-
tion performance on Car at higher levels of difficulty.
The proposed method achieves better mean average
precision (mAP) in BEV detection than Complexer-
YOLO (Simon et al., 2019), which is known as em-
ploy YOLOv3 network. Although the input of pro-
posed method is 2D pseudo-image, not the 3D vox-
elized semantic point clouds, the accuracy of objects
with highly non-planar surface (i.e., pedestrian and
cyclist) is still higher in any level of difficulty.
4.4 Ablation Studies
To confirm the effectiveness of the proposed method,
we combined Normal-map with other hand-crafted
features in three different sets, as shown in Table. 2.
We used the point cloud processing described in Sec-
tion 3.1, calculated all the features we need.
mAP for Object Detection. All three classes used
the same Intersection over Union (IoU) threshold. As
shown in Eq. 10, the IoU is given by the overlapping
area between the predicted bounding box B
pred
and
the ground truth bounding box B
gt
divided by the area
of union.
IoU =
area(B
pred
∩B
gt
)
area(B
pred
∪B
gt
)
. (10)
Table 2 shows that Normal+RGB set achieves the
highest mAP of 91.94 in all sets of this ablation study.
Besides, proposed method achieves better precision
balance than RGB-map-only set, which proves the ef-
fectiveness of Normal-map
According to the Table 3. Normal-based methods
have higher mAP than RGB-map-only set with dif-
ferent IoU threshold. In addition, when the reflection
intensity is removed, the set with Normal-map still
achieves a higher mAP. This means that Normal-map
has the potential to be used in environments where
reflection strength is unreliable.
Evaluation over Distance. The point cloud at near-
by is relatively dense but sparse of the further object.
In this experiment, the objects are divided into five
sets according to their distance of LiDAR position,
VISAPP 2021 - 16th International Conference on Computer Vision Theory and Applications
574
(a) RGB-map
(b) Normal-map
(c) Normal-map + RGB-map
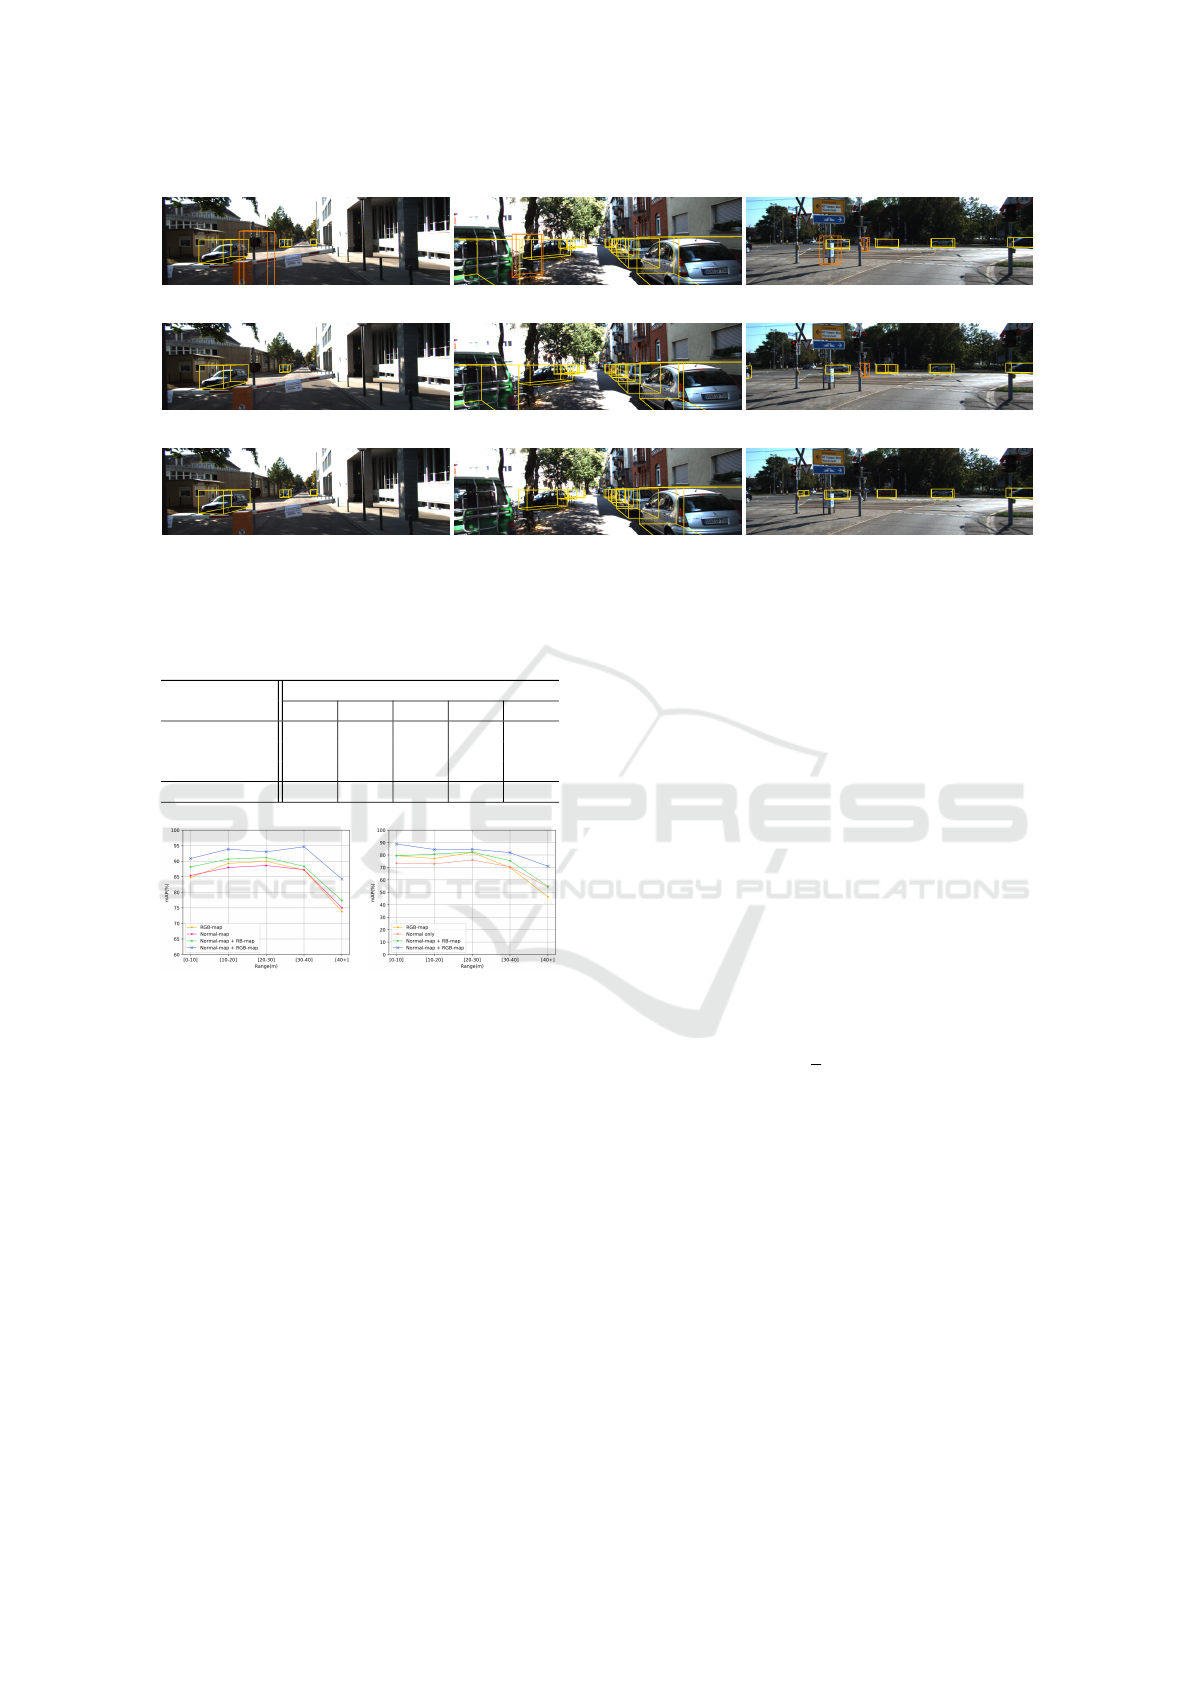
Figure 6: 3D object detection visualization in camera view. Three different feature combination sets were compared.
With addition of Normal-map, false detection of cylindrical object, which is similar to pedestrian, significantly decreased,
especially for three left images.
Table 3: mAP with different IoU threshold.
IoU Threshold
Feature 0.5 0.6 0.7 0.8 0.9
RGB 87.7 77.5 55.6 24.1 0.8
Norm. 86.2 82.2 66.3 38.5 4.7
Norm.+RG 89.1 83.2 61.8 31.9 2.4
Norm.+RGB 92.3 89.0 79.3 53.8 17.3
(a) mean AP (b) Pedestrian AP
Figure 7: Average precision of object detection over dis-
tance. Pedestrian AP of RGB-map set fell down rapidly
with the distance increasing, while the Normal-based sets
were less affected by it.
and calculated the average precision of objects in each
set.
It is shown in Fig. 7(a) that all experimental sets
have similar trends. The mAP is higher in mid-range,
because the mid-range of global coordinate is the cen-
tre area in BEV image. We can find that all sets
with the addition of Normal-map have a significant
improvement comparing with RGB-map only. With
the increasing distance, point clouds become sparse
leading mAP falls down in all sets. The PCA based
surface normal estimation is known to be sensitive to
the surface curvature. But we can see the results of
[40+] in Fig. 7(a), all Normal-based sets still have
better accuracy than RGB-map only.
Yaw Angle Error Evaluation. As the surface normal
is a spatial shape information of an object, we think
Normal-map could improve the object yaw angle ac-
curacy. In this study, object yaw angle is brought by
arctan(Im, Re).
Considering that in the Cartesian coordinate sys-
tem, both π and −π are actually pointed in the same
direction, the yaw angle error cannot be calculated
from predicted yaw and gt directly. Thus we assume
that the predicted yaw angle is a (Im
p
,Re
p
) vector and
the ground truth is (Im
gt
,Re
gt
). The accuracy of the
yaw angle can be evaluated by comparing the size of
included angle θ between ~a
p
and
~
b
gt
. The evaluation
scores of each class are calculated as Eq. 12 shows:
~a
p
~
b
gt
= |~a
p
||
~
b
gt
|cosθ (11)
score
class
(θ
k
) = (
1
n
n
∑
k=1
arccosθ
k
)
−1
(12)
As shown in Fig. 8, Normal-based method has
smaller included angles which means Normal-map is
conducive to accuracy improvement of object yaw an-
gle. In addition, Normal-map is been used as only in-
put can still further improve the yaw angle accuracy
for the object with more flat and large planar surface.
Visualization Results. As can be seen from Figs. 6,
the traffic sign and traffic light were incorrectly de-
tected as cyclists or pedestrians in the results of RGB-
map. This result shows cylindrical objects and those
are similar in height to humans would confuse the
model and cause it to predict incorrectly. Normal-
map seldom results in such mistakes because humans
definitely have a different shape than traffic lights or
signs. Objects with a highly non-planar surface like
3D Object Detection with Normal-map on Point Clouds
575

Figure 8: Accuracy of yaw angle prediction of 3 classes.
pedestrians have significantly precision improvement
on object detection with the help of Normal-map.
5 CONCLUSION
In this work we propose a 3D object detection method
that combines Normal-map (the surface normal esti-
mated from point cloud) with other hand-crafted im-
ages. The proposed method makes the input informa-
tion have more enhanced spatial shape information.
The object detection results show competitive perfor-
mance on KITTI benchmarks. This method has better
accuracy in object detection than conventional meth-
ods, and is less affected by sparse point clouds. In
addition, it brings better yaw angle prediction. It also
has excellent anti-interference ability for object sur-
faces with unreliable reflection intensity data. Our
method has the potential to be used for the virtual-
world dataset, enables further research in autonomous
driving. In the future, we would like to use a modern
normal estimation technique in our pipeline for the
accuracy of Normal-map go further. We also plan to
improve it to detect more classes of objects and faster.
REFERENCES
Beltr
´
an, J., Guindel, C., Moreno, F. M., Cruzado, D.,
Garc
´
ıa, F., and Escalera, A. D. L. (2018). Birdnet: A
3d object detection framework from lidar information.
In 2018 21st International Conference on Intelligent
Transportation Systems (ITSC), pages 3517–3523.
Bochkovskiy, A., Wang, C.-Y., and Liao, H.-Y. M. (2020).
Yolov4: Optimal speed and accuracy of object detec-
tion. arXiv preprint arXiv:2004.10934.
Chen, X., Ma, H., Wan, J., Li, B., and Xia, T. (2017). Multi-
view 3d object detection network for autonomous
driving. In The IEEE Conference on Computer Vision
and Pattern Recognition (CVPR).
Geiger, A., Lenz, P., and Urtasun, R. (2012). Are we ready
for autonomous driving? the kitti vision benchmark
suite. In Conference on Computer Vision and Pattern
Recognition (CVPR).
Girshick, R. (2015). Fast r-cnn. In Proceedings of the IEEE
international conference on computer vision, pages
1440–1448.
Girshick, R., Donahue, J., Darrell, T., and Malik, J. (2014).
Rich feature hierarchies for accurate object detection
and semantic segmentation. In The IEEE Conference
on Computer Vision and Pattern Recognition (CVPR).
Liu, W., Anguelov, D., Erhan, D., Szegedy, C., Reed, S.,
Fu, C.-Y., and Berg, A. C. (2016). Ssd: Single shot
multibox detector. In European conference on com-
puter vision, pages 21–37. Springer.
Merry, B., Gain, J., and Marais, P. (2013). Accelerating kd-
tree searches for all k-nearest neighbours. Technical
report, University of Cape Town.
Ran, L., Ximin, Z., Yiyuan, Z., Wanggen, W., and Lib-
ing, L. (2013). Normal estimation algorithm for point
cloud using kd-tree. IET International Conference on
Smart and Sustainable City 2013 (ICSSC 2013).
Redmon, J., Divvala, S., Girshick, R., and Farhadi, A.
(2016). You only look once: Unified, real-time ob-
ject detection. 2016 IEEE Conference on Computer
Vision and Pattern Recognition (CVPR).
Redmon, J. and Farhadi, A. (2017). Yolo9000: Better,
faster, stronger. In The IEEE Conference on Computer
Vision and Pattern Recognition (CVPR).
Redmon, J. and Farhadi, A. (2018). Yolov3: An incremental
improvement. arXiv preprint arXiv:1804.02767.
Ren, S., He, K., Girshick, R., and Sun, J. (2015). Faster
r-cnn: Towards real-time object detection with region
proposal networks. In Advances in neural information
processing systems, pages 91–99.
Shi, S., Wang, X., and Li, H. (2019). Pointrcnn: 3d object
proposal generation and detection from point cloud.
In Proceedings of the IEEE Conference on Computer
Vision and Pattern Recognition, pages 770–779.
Simon, M., Amende, K., Kraus, A., Honer, J., Samann,
T., Kaulbersch, H., Milz, S., and Michael Gross, H.
(2019). Complexer-yolo: Real-time 3d object detec-
tion and tracking on semantic point clouds. In Pro-
ceedings of the IEEE Conference on Computer Vision
and Pattern Recognition Workshops, pages 0–0.
Simony, M., Milzy, S., Amendey, K., and Gross, H.-M.
(2018). Complex-yolo: An euler-region-proposal for
real-time 3d object detection on point clouds. In Pro-
ceedings of the European Conference on Computer Vi-
sion (ECCV), pages 0–0.
Wang, C. and Siddiqi, K. (2016). Differential geometry
boosts convolutional neural networks for object detec-
tion. In The IEEE Conference on Computer Vision and
Pattern Recognition (CVPR) Workshops.
Zhou, Q.-Y., Park, J., and Koltun, V. (2018). Open3d: A
modern library for 3d data processing. arXiv preprint
arXiv:1801.09847.
VISAPP 2021 - 16th International Conference on Computer Vision Theory and Applications
576
