
Evaluation of Thermal Resistance of Surface-emitting Quantum
Cascade Laser using Structural Function and 3D Thermal Flow
Simulation
Shigeyuki Takagi
1
, Hirotaka Tanimura
1a
, Tsutomu Kakuno
2
, Rei Hashimoto
2
, Kei Kaneko
2
and Shinji Saito
2
1
Department of Electrical and Electronics Engineering, School of Engineering, Tokyo University of Technology,
1404-1 Katakura-cho, Hachioji, Tokyo, Japan
2
Corporate Manufacturing Engineering Center, Toshiba Corporation, 8 Shinisogo-cho, Isogo,
Yokohama, Kanagawa, Japan
Keywords: Quantum Cascade Lasers, QCLs, Surface-emitting QCL, Photonic Crystal, PhC, Static Method, Structure
Function, Thermal Resistance, Three-dimensional Simulation.
Abstract: We analysed the thermal characteristics of a surface-emitting quantum cascade laser (QCL), which is expected
to increase output and improve beam quality, on the basis of structural functions and 3D thermal flow
simulation. The surface-emitting QCL has a device size of 3 mm x 3 mm and has a photonic crystal for
extracting laser light vertically from the QCL. The structural function indicating the heat capacity and thermal
resistance of the surface-emitting QCL was measured by the static method, and the total thermal resistance
including the mount was about 4.7 K/W. On the other hand, the thermal resistance calculated from the 3D
thermal flow simulation of the surface-emitting QCL was 4.55 K/W, showing the results of the two methods
to be in good agreement. It was shown that the structural function and the 3D simulation are effective for the
thermal analysis of surface-emitting QCLs.
1 INTRODUCTION
Quantum cascade lasers (QCLs) are n-type
semiconductor lasers that can emit laser light in the
infrared region (Faist et al., 1994). Since the
oscillation wavelength of the QCL is in the infrared
region called the fingerprint region of molecules,
many gases can be measured with high sensitivity. In
particular, QCLs are applicable to trace substance
detection and distant gas detection. With such trace
substance detection and distant gas detection, higher
sensitivity is expected upon increasing the output.
Since the amount of laser absorption is measured in
the detection of trace substances, it is necessary to
propagate a large optical path length. Also, in far-
field gas detection, a high-power laser is required
since the weakly reflected light during laser light
propagation is detected.
Regarding high-power lasers, watt-class laser
oscillation has been reported by Evans et al. (Evans et
a
https://orcid.org/0000-0002-7653-4602
al., 2007). This laser is an end-face emitting-type
laser in which the directions of the laser excitation
and the laser emission coincide with each other. In an
end-face light-emitting laser, the laser beam is excited
by concentrating the current along a narrow current
path called a ridge, and heat dissipation is low.
Moreover, the laser beam is emitted from the narrow
ridge into a wide space, and the rapid expansion of
the beam area causes the deterioration of the beam
quality.
On the other hand, a surface-emitting QCL that
emits laser light in the vertical direction of the device
using a photonic crystal (PhC) has been proposed. By
increasing the area of the excited part called a mesa,
improvements of the beam quality and the heat
dissipation can be expected. In the surface emitting
QCL using PhC, laser oscillation was reported by
Colombelli et al. (Colombelli et al., 2003), and laser
oscillation of 5 W was reported by Wang et al. (Wang
et al., 2019).
88
Takagi, S., Tanimura, H., Kakuno, T., Hashimoto, R., Kaneko, K. and Saito, S.
Evaluation of Thermal Resistance of Surface-emitting Quantum Cascade Laser using Structural Function and 3D Thermal Flow Simulation.
DOI: 10.5220/0010302700880093
In Proceedings of the 9th International Conference on Photonics, Optics and Laser Technology (PHOTOPTICS 2021), pages 88-93
ISBN: 978-989-758-492-3
Copyright
c
2021 by SCITEPRESS – Science and Technology Publications, Lda. All rights reserved
It has been reported that the gain of QCLs
improves with decreasing temperature (Gresch et al.,
2009). Therefore, it is important to improve the
cooling of the device, that is, the heat dissipation of
the device in order to increase the laser power. Since
thermal resistance is the ratio of temperature rise to
power input, in this paper we use thermal resistance
as an index of heat dissipation. By reducing the
thermal resistance, high heat dissipation can be
achieved and the laser output power can be improved.
We have reported on the relationship between the
ridge structure and the heat-dissipating structure
using structural functions and simulations in an end-
face light-emitting QCL (Takagi et al., 2019). Laser
oscillations of the surface-emission type QCLs have
been reported, but there are few reports on their
thermal analysis.
So far, we have reported the results of applying the
structural functions and the thermal simulations to the
thermal analysis of end-face emission QCLs. The
structural function was measured by applying the
static method to the surface-emitting QCL, and the
thermal resistance of the device was extracted to be
about 4.7 K/W. On the other hand, thermal analysis
was performed using a 3D simulation model for the
surface emitting QCL, and a thermal resistance of
4.55 K/W was obtained. The thermal resistance
values obtained by the two methods were in good
agreement. It has been shown that both methods are
effective for the thermal analysis of surface-emitting
QCLs.
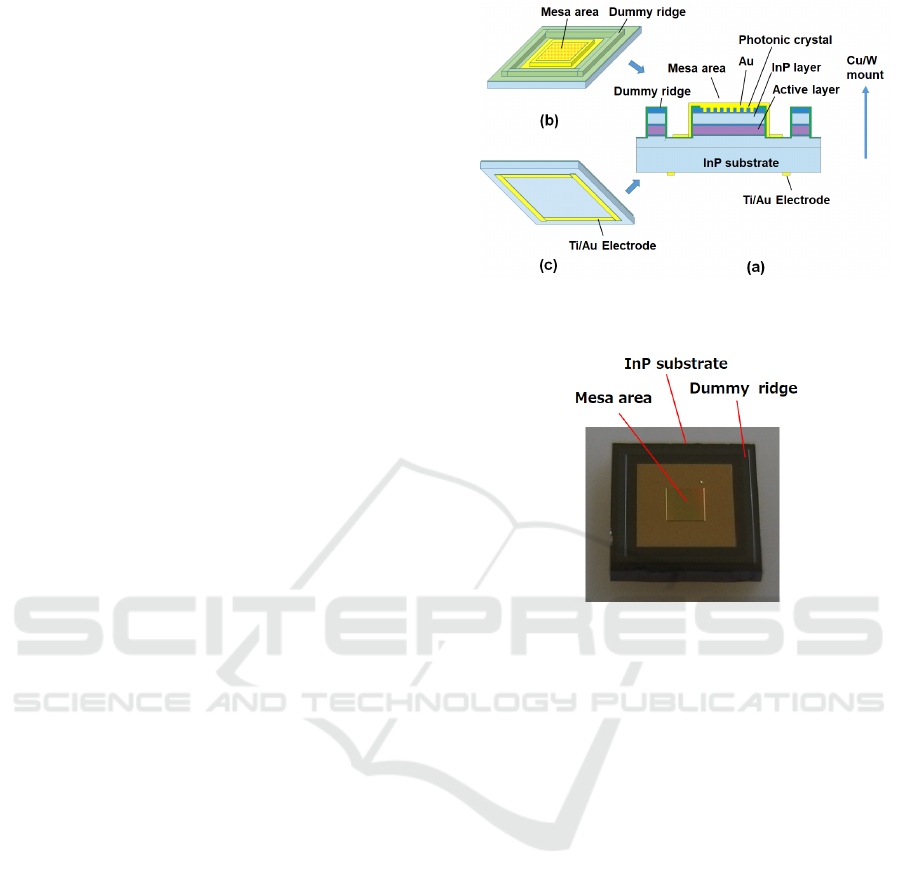
2 SURFACE-EMITTING QCL
The structure of the surface-emitting QCL is shown
in Fig. 1, where (a) is a cross-sectional view, (b) is a
top view, and (c) is a bottom view. A mesa area that
emits laser light and a dummy ridge are formed on an
InP substrate of 600 µm thickness. In the mesa area,
InP layer is formed on the active layer that excites the
laser, a photonic crystal made of InGaAs is formed on
the InP layer, and the photonic crystal is embedded
with AuSn. An Au electrode for current supply is
formed on the opposite side of the InP substrate. The
surface-emitting device has an epi-side-down
structure in which the mesa and dummy ridge sides
are mounted on a Cu/W mount with AuSn solder.
Figure 2 shows a photograph of the surface-
emitting QCL used for the measurement, in which the
mesa and dummy ridge are observed to be formed on
the InP substrate.
Figure 1: Surface emitting QCL. (a) Cross-sectional view,
(b) top view, and (c) bottom view.
Figure 2: Photograph of surface-emitting QCL.
3 MEASUREMENT OF
STRUCTURE FUNCTION
3.1 K-factor Measurement
Dynamic and static methods are used to measure the
thermal resistance of semiconductor devices. The
static method is a method of measuring the thermal
resistance from the voltage/current characteristics at
the time of cooling after heating the device. The
measurement time is short and the reproducibility is
excellent (Székely, 1997).
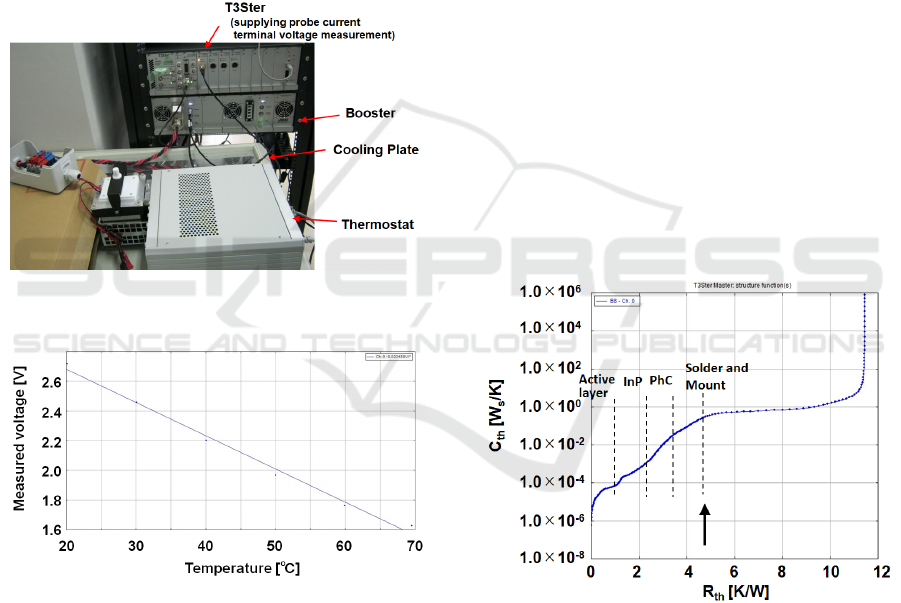
We have reported a method for measuring the
thermal resistance of an end-face emitting QCL by
the static method. In this study, we applied a static
method to the thermal resistance measurement of the
surface-emitting QCL. The T3Ster (Siemens AG)
shown in Fig. 3 was used for the measurement. Since
the total thermal resistance of a semiconductor device
changes with temperature, the temperature change is
proportional to the voltage change at the end of the
device when a constant current is flowing. In the
static method, the voltage change of ΔTSP [mV] is
Evaluation of Thermal Resistance of Surface-emitting Quantum Cascade Laser using Structural Function and 3D Thermal Flow Simulation
89
measured, and the device temperature change of ΔTj
[K] is calculated using
∆𝑇
=𝐾∙∆𝑇𝑆𝑃 ,
(1)
where K is a coefficient called the K-factor.
The K-factor is required to measure the
temperature of a surface-emitting QCL by the static
method. The surface-emitting QCL was installed in
the thermostat shown in Fig. 3. The thermostat
temperature was changed from 20 °C to 70 °C, and
the K-factor was measured. Figure 4 shows the
measurement result of the K-factor of the surface-
emission QCL. As a result, the K-factor of –0.02243
V/° was obtained.
Figure 3: Measuring Equipment of K-factor and structure
function.
Figure 4: Measurement result of K-factor.
3.2 Measurement of Structure
Function
T3Ster was also used to measure the structural
function by the static method. The QCL mount was
set on the cooling plate of T3Ster. The QCL mount
was cooled to 20 °C, and the QCL device was heated
by supplying about 200 mA of electric current. After
stopping the heating power supply, the QCL
temperature during cooling was measured and the
cooling curve was obtained. Denoting the thermal
resistance as R
th
and the thermal capacity as C
th
in the
elements constituting the QCL, the time constant τ
during cooling is expressed by
𝜏=𝐶
∙𝑅
.
(2)
The time constant τ was extracted from the
inflection point of the cooling curve, and C
th
and R
th
were obtained from τ using Eq. (2). In structural
functions graphs, R
th
is plotted on the horizontal axis
and C
th
is plotted on the vertical axis (Székely, 1997).
Figure. 5 shows the structural function of the
surface-emitting QCL. As shown in Fig. 1, the
surface-emitting QCL is divided into the mount,
AuSn solder, PhC, InP layer, and the active layer.
From the thermal conductivity and component size, it
is estimated that the structural function divided by
inflection points corresponds to the four QCL
components. In addition, the flat region with a
thermal resistance of 5 K/W or more changes
depending on whether the QCL is attached to a
cooling plate and is considered to be the thermal
resistance between the surface-emitting QCL and the
T3Ster cooling plate. The total thermal resistance of
the surface emitting QCL is estimated to be about 4.7
K/W.
Figure 5: Measurement results of structure function.
4 THERMAL SIMULATION OF
SURFACE-EMITTING QCL
4.1 3D Thermal Flow Simulation
Model
As another method for analysing the thermal
characteristics of the surface-emitting QCL, thermal
PHOTOPTICS 2021 - 9th International Conference on Photonics, Optics and Laser Technology
90
flow simulation using a 3D model was performed.
The 3D configuration and physical property data of
the surface-emitting QCL were input to the
simulation model. The thermal flow simulation
software FloTHERM (Siemens Product Lifecycle
Management Software Inc.) was used for the
simulator. The simulation is performed using a
natural convection model in which the active is
overheated and natural convection is generated (Ho et
al., 2008). The equation for gas flow is expressed by
𝜕𝜌
𝜕𝑡
+
∂
𝜌𝑣
𝑥
∂
x
+
∂𝜌𝑣
𝑦
∂
y
+
∂
𝜌𝑣
𝑧
∂
z
=0,
(3)
where ρ is density, t is time, and 𝑣
𝑥
, 𝑣
𝑦
, and 𝑣
𝑧
are
velocities in the x, y, and z directions, respectively.
The heat equation is determined as
𝜕𝑢
𝜕𝑡
=
𝐾
𝜎𝜌
𝜕
2
𝑢
𝜕𝑥
2
+
𝜕
2
𝑢
𝜕𝑦
2
+
𝜕
2
𝑢
𝜕𝑧
2
+
1
𝜎
𝐹
𝑥, 𝑦,𝑧, 𝑡
,
(4)
where u is the temperature and is a function of the
position and time. σ is the specific heat, and Κ is the
thermal conductivity. F is the external heating value
per time, and is a function of position and time.
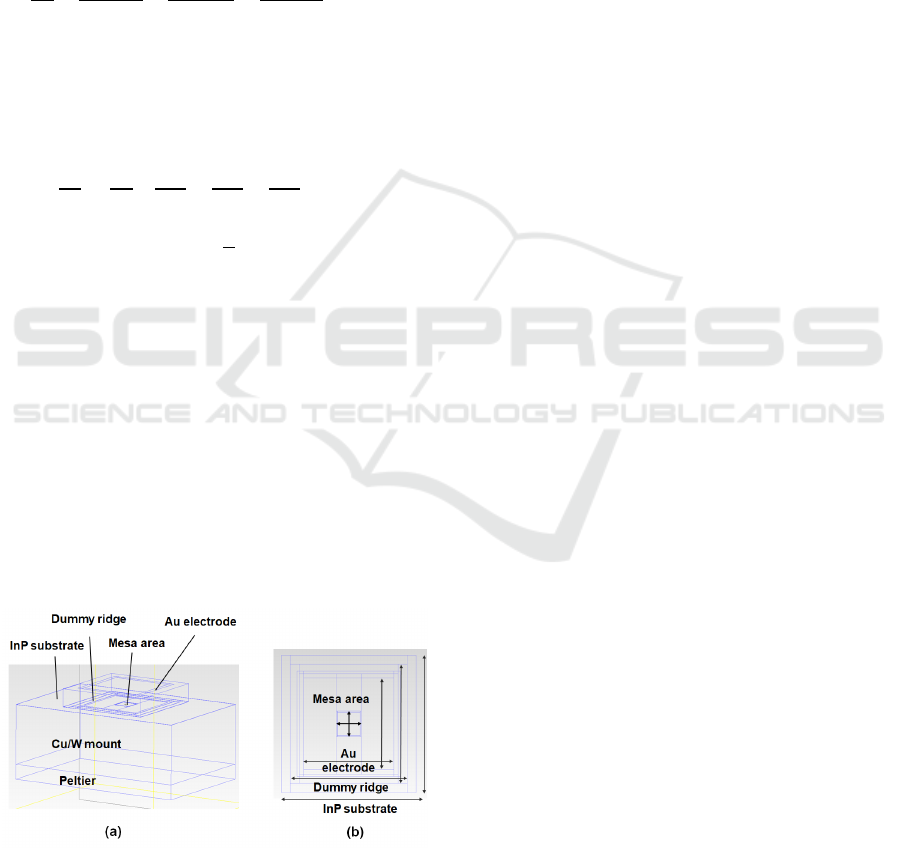
Figure 6 (a) shows the three-dimensional model
of the surface-emitting QCL. The InP substrate with
the mesa area on the lower side is placed on the Cu/W
mount, and the mount is fixed on the Peltier element.
Figure 6 (b) shows the top view of the 3D model as
shown in Fig. 2. The outlines of the InP substrate,
AuSn solder, mesa, dummy ridge, and the Au
electrode on the opposite side of the InP substrate to
the mesa are observed.
Figure 5: 3D thermal flow model (a) and its top view.
In the 3D model, the temperature distributions in
the QCL components were simulated using the
isotropic thermal conductivities as follows. The
thermal conductivity of the Cu/W mount, AuSn
solder, InP, SiO
2
, Ti, Au, and Cu are 157 W/mK, 59
W/ mK, 68 W/mK, 1.38 W/mK, 21 W/mK, 296
W/mK, and 403 W/mK, respectively. For the PhC in
which Au was embedded, the thermal conductivity
was calculated using the volume ratio of PhC and Au.
In the active layer, thin films of Al
0.638
In
0.362
As and
Ga
0.331
In
0.669
As were alternately laminated. The
thermal conductivity of the active layer was
calculated by multiplying the film thickness ratio with
InAlAs of 10.0 W/mK (Kim et al., 2002) and InGaAs
of 5.6 W/mK (Adachi, 1985), and was estimated to be
7.5 W/ mK.
The temperature boundary condition is fixed at 0
°C on the mount with a cooling Peltier device, and the
ambient temperature of the surface-emitting QCL is
set at 30 °C. Assuming that the power from the power
supply is input to the active layer, the temperature rise
was calculated by changing the power supplied to the
active layer.
4.2 Simulation Results
The temperature distribution of the surface-emitting
QCL was calculated by changing the input power to
the active layer to 2 and 10 W. Figures 7 (a) and 7 (b)
show the temperature distribution of the surface-
emitting QCL in the central cross section. The Cu/W
mount has high thermal conductivity, and the
temperature in the mount is approximately 0 °C. The
temperature is high in the active layer where power is
applied and in the mesas around it. The maximum
temperature of air is 21.3 °C because the calculation
region is set to the region where the temperature of air
is affected by the temperature of the surface-emission
QCL.
When the input power was increased from 2 to 6
W, as shown in Figs. 7 (a) and (b), the temperature of
the mesa area increased from 8.6 to 45.5 °C. Then, the
input power to the active layer was increased from 0
W to 16 W, and the relationship between the input
power to the active layer and the maximum
temperature of the surface-emission QCL was
calculated. The simulation results are shown in Fig.
8. The maximum temperature of the surface emitting
QCL increases in proportionally to the power input to
the active layer. Figure 8 shows that the maximum
temperature rise at 10 W is 45.5 °C (K), and the
thermal resistance is estimated to be 4.55 K/W.
Evaluation of Thermal Resistance of Surface-emitting Quantum Cascade Laser using Structural Function and 3D Thermal Flow Simulation
91
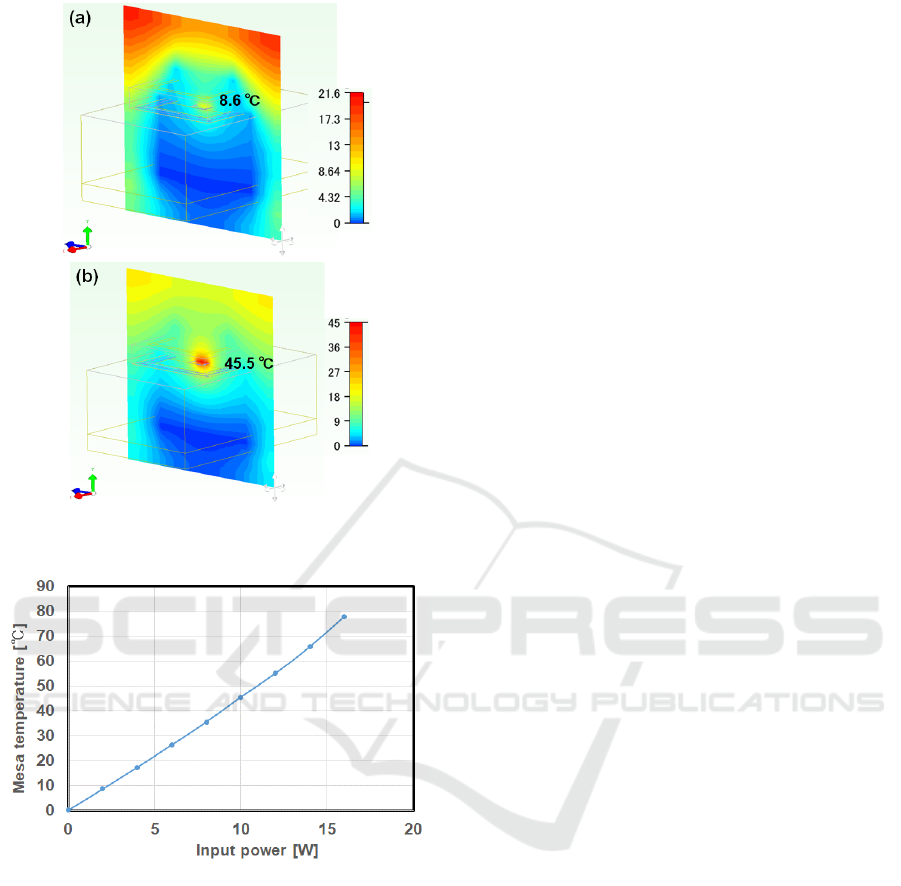
Figure 6: Simulation results of thermal flow analysis. (a)
Input power: 2 W, (b) Input power: 10 W.
Figure 7: Relationship between input power and maximum
temperature of the mesa section.
5 DISCUSSION AND
CONCLUSIONS
In the surface-emitting QCL, the Cu/W mount with
the size of 6 x 4 x 2 (t) mm has the maximum heat
capacity of the device. The heat capacity is calculated
to be 0.123 J/K from the density of 17.2 g/cm
3
and the
specific heat of 0.15 kJ/(kg/K). This is almost the
same as the thermal resistance of the threshold value
at which the heat capacity becomes flat in the
structural function. Therefore, it is reasonable to
estimate the thermal resistance of the structural
function to be about 4.7 K/W.
On the other hand, the thermal resistance is
calculated to be 4.55 K/W from the 3D simulation,
and the thermal resistances obtained by 3D simulation
are in good agreement with that obtained from the
structure function. Therefore, the thermal analyses
using the structural function and 3D simulation are
effective for calculating the thermal characteristics of
the surface-emitting QCL. In addition, thermal
resistance measurement using the structural function
is effective for evaluating the validity of the
calculation model of 3D simulation.
ACKNOWLEDGMENTS
This work was supported by Innovative Science and
Technology Initiative for Security (Grant Number
JPJ004596), ATLA, Japan.
REFERENCES
Faist, J., Capasso, F., Sivco, D. L., Sirtori, C., Hutchinson,
A., & Cho, A. Y. (1994). Quantum cascade laser.
Science, 264, 553-556.
Evans, A., Darvish, S. R., Slivken, S., Nguyen, J., Bai, Y.,
& Razeghi, M. (2007). Buried heterostructure quantum
cascade lasers with high continuous-wave wall plug
efficiency. Appl. Phys. Lett., 91, 071101-1-3.
Colombelli, R., Srinivasan, K., Troccoli, M., Painter, O.,
Gmachl, C. F., Tennant, D. F., Sergent, A. M., Sivco,
D. L., Cho, A. Y., & Capasso, F. (2003). Quantum
cascade surface-emitting photonic crystal laser.
Science, 302, 1374–1377.
Wang, Z., Liang., Y., Meng, B., Sun., Y-T., Omanakttan,
G., Gini, E., Beck, M., Ilia, S., Lourdudoss, S., Faist, J.,
Scalari, G. (2019). Large area photonic crystal quantum
cascade laser with 5 W surface-emitting power. Opt.
Express, 27, 22708–22716.
Gresch, T., Faist, J., & Giovannini, M. (2009). Gain
measurements in strain-compensated quantum cascade
laser. Appl. Phys. Lett., 94, 161114-1-3.
Takagi, S., Tanimura, H., Kakuno, T., Hashimoto, R., Saito,
S. (2019). Thermal analysis and heat dissipation
improvement for quantum cascade lasers through
experiments, simulations, and structure function. Jpn.
J. Appl. Phys., 58, 091008-1–6.
Székely, V. (1997). A new evaluation method of thermal
transient measurement results. Microelectron. J., 28,
277–292.
Ho, C. J., Chen, M. W., Li, Z. W. (2008). Numerical
simulation of natural convection of nanofluid in a
square enclosure: Effects due to uncertainties of
viscosity and thermal conductivity. Int. J. Heat Mass
Transfer, 51, 4506–4515.
PHOTOPTICS 2021 - 9th International Conference on Photonics, Optics and Laser Technology
92

Kim, Y. M., Rodwell, M. J. W., Gossard, A. C. (2002).
Thermal characteristics of InP, InAlAs, and AlGaAsSb
metamorphic buffer layers used in
In0.52Al0.48/In0.53Ga0.47As heterojunction bipolar
transistors grown on GaAs substrates. J. Electron.
Mater., 31, 196–199.
Adachi, S. (1985). GaAs, AlAs, and AlxGa1−xAs: Material
parameters for use in research and device applications.
J. Appl. Phys., 58, R1–R29.
Evaluation of Thermal Resistance of Surface-emitting Quantum Cascade Laser using Structural Function and 3D Thermal Flow Simulation
93
