
CPU and RAM Performance Assessment for Different Marker Types
in Augmented Reality Applications
Ciro Angeleri
a
, Franco Marini
b
, Damián Alvarez
c
, Guillermo Leale
d
and David Curras
e
Universidad Abierta Interamericana, Av. Ovidio Lagos 944, Rosario, Argentina
mail@guillermoleale.com and david.curras@radiumrocket.com
Keywords: Augmented Reality, CPU Performance, RAM Performance, Performance Assessment, Fiducial Markers,
Natural Markers.
Abstract: Augmented Reality is becoming a commonplace in the area of mobile application development industry and
academia. This experiences on smartphones allowed a new world of experiences in the users daily life. Widely
approaches such as fiducial markers or natural markers can be used to generate different scenarios and
interactions. Two of the most important concerns are the limitations of resources in mobile devices and the
consequent computational inefficiency. Thus, an important question to be raised in development teams is how
the different parts that make up an AR experience can affect the performance of a mobile device and
consequently the end user experience. Therefore, in this work we performed a quantitative assessment in
terms of overall CPU and RAM usage when applying different marker types to mobile development. The
results obtained are statistically significant and show that the use of markers with fewer number of vertices,
such as a sphere performs better than others like a pyramid or a cube. With our results, we aim to provide a
convenient means for technical leaders and development teams to reach an adequate decision when choosing
a marker for generating new AR experiences.
1 INTRODUCTION
Augmented Reality (AR) is becoming a
commonplace in the area of mobile application
development both for industry and academia (Qiao et
al., 2019). An AR experience is a mix of a diverse
collection of virtual information, superimposed on
their view of the real world (or also called real reality)
around them (MacIntyre et al., 2011). Different fields
have started taking into account AR as a resource,
such as human computer interaction, education,
games, manufacturing, construction and advertising
(Baek et al., 2013).
AR applications on smartphones enabled new
mobile AR experiences for everyday users. With this
ubiquitous availability, Mobile AR allows to devise
and design innovative learning scenarios in real world
a
https://orcid.org/0000-0003-0789-2905
b
https://orcid.org/0000-0002-5448-267X
c
https://orcid.org/0000-0002-5310-4124
d
https://orcid.org/0000-0003-3983-1496
e
https://orcid.org/0000-0003-3827-4835
settings. Hardware-based Mobile AR and App-based
Mobile AR are the two dominant platforms for
Mobile AR applications. However, hardware-based
Mobile AR implementation is known to be costly and
lacks flexibility. On the other hand, the App-based
one requires additional software downloading and
installation in advance, and therefore is inconvenient
for cross-platform deployment (Specht, 2012).
Web AR is defined as an approach for Web
Augmented Reality implementation, combining some
boundaries from the Web cross-platform
compatibility, and the possibility of providing a
lightweight and pervasive service of Mobile AR.
The rapid growth of this technology brought
several challenges. Two of the most important ones
are the limitations of resources in mobile devices and
the consequent computational inefficiency.
Angeleri, C., Mar ini, F., Alvarez, D., Leale, G. and Curras, D.
CPU and RAM Performance Assessment for Different Marker Types in Augmented Reality Applications.
DOI: 10.5220/0010302302710277
In Proceedings of the 16th International Joint Conference on Computer Vision, Imaging and Computer Graphics Theory and Applications (VISIGRAPP 2021) - Volume 1: GRAPP, pages
271-277
ISBN: 978-989-758-488-6
Copyright
c
2021 by SCITEPRESS – Science and Technology Publications, Lda. All rights reserved
271

Therefore, the user experience is quickly degraded by
limited performance on this type of development.
AR experiences can be developed applying one of
the following mechanisms: sensor-based, vision-
based, and hybrid tracking. Sensor-based applications
make exhaustive use of a wide variety of sensors, like
GPS, gyroscopes and accelerometers. As a result of
the complexity of computation, storage and
networking, the lightweight Web AR implementation
mechanism is currently the least chosen option for
users to start. Vision-Based applications, on the other
hand, provide object recognition, detection and
tracking. It can be splitted into two methods, the
frame-by-frame tracking approach which uses cloud
servers to perform real time processing in order to
reduce the high pressure on mobile computation, and
the marker-based method, which makes the tracking
based on a defined marker. Marker-based methods
can be implemented in three different ways. 1) The
fiducial markers, which make use of the camera
image to find optical square markers and estimate
their relative pose to the camera. A square marker
consists of a black square of a pre-defined size with a
white border. 2) Physical or natural markers, which is
an image-based tracking technique that detects and
tracks the features that are naturally found in the
image itself. These could be corners, edges, blobs,
etc., without using specifically designed ID markers
(Ćuković et al., 2015; Yabuki, N et al., 2011). The
natural marker technique includes 3-D (a human face
for example) as well as 2-D objects (a photo for
example). 3) Hybrid-approach, which overcomes the
weaknesses and limitations of the individual methods
mentioned earlier by combining different methods.
The use of these approaches provides affordable
means of mobile development in AR experiences.
Nevertheless, since there are still several open
challenges for the application of Web AR in real
cases, it is important to decide which approach is
more appropriate in order to build the final product.
To this end, it is relevant to assess the performance of
each one when performing specific tasks.
Several studies have shown how to improve the
algorithms that are running in the background (Baek
et al., 2013; Hofmann et al., 2012). Nevertheless,
these investigations were based on the precision of
early AR systems for the military using wireless
beacons or optimizations in the algorithm to detect
interest points on different image resolutions. There
is one study that takes quantitative measurements of
Frames Per Second, Latency, Power Consumption
and Number of keypoints, but these results are based
on experiments that are helped with external cloud
server computations as well as the mobile processing
itself (Srinivasan et al., 2009). Therefore, in these
works there is no clear assessment on the specific
performance of the mobile device (Qiao et al., 2018).
It is known that the limited computing and
rendering capabilities on the Web make it challenging
to achieve high-performance, especially on mobile
devices. Application performance is one of the
deciding factors to choose the best approach to build
AR experiences. However, it depends on many
factors including developer coding efficiency, marker
complexity, and usage of native AR modules (they
depend on the operating system in which the
application is running on). In an effort to increase the
knowledge about how efficiently these technologies
perform on a mobile device, five applications were
developed, one per marker-based mechanism
approach, and their performance was compared
taking into account values for CPU and RAM
performance (Azuma et al., 2006).
This work is structured as follows. In the
Methodology section, an overall description of the
code implementation and the performance indicators
is shown. In the Experiment section, the workflow for
the overall process is depicted. In the Results section,
the obtained values for the CPU and RAM assessment
are analyzed. Finally, in the Conclusions and Future
Work section, current results and future lines of work
are presented.
2 METHODOLOGY
In order to evaluate the device CPU and RAM usage
from the runtime perspective, we built a set of
scenarios using different types of markers.
The scenarios consisted of a mobile phone
recognizing both fiducial and natural markers and then
drawing a 3D object on them. In order to simulate real
world experiences, different complexity patterns on the
marker generation were applied. A set of basic 2D
figures called fiducial markers (similar to QR codes)
and 3D figures composed of basic shapes like cubes,
cones as well as complex ones like cylinders and
spheres were generated. Several distances between the
markers and the cellphone were set, and also a specific
illumination set up was used and measured.A wealth
of useful information was provided by the packages
used to measure the resource usage of the mobile
device. However, we considered it necessary to take
only two variables to have a clean starting point in the
technology comparison. Experiments were
performed automatically, and the results were
recorded over determined intervals of time. Results of
each run were analyzed, and the percentage of the
GRAPP 2021 - 16th International Conference on Computer Graphics Theory and Applications
272
CPU and RAM memory usage were picked for this
work.
The CPU and RAM indicators are obtained as a
percentage of the CPU and RAM usage in a fixed
period of time. In order to handle large variability of
CPU consumption throughout the experiment, the
average for each run was considered as a summary
measure. Since the CPU usage is obtained in terms of
the number of device cores, measured values often
exceed 100%, being its maximum equal to 100 ×
number of cores. Therefore, we define the CPU
overall usage percentage as
CPU Usage / (100 x number of cores)
(1
)
Finally, an ANOVA analysis was performed to check
if the differences between the indicators of each run
were statistically significant.
For the RAM, we define RAM overall usage
percentage which is obtained as a percentage of the
total amount of RAM memory in the device over a
fixed period of time. In order to find particularities
that allow a better understanding of the performance
of the devices while running AR and to handle a
possibly large variability of CPU and RAM
consumption throughout the experiment, the average
of the performance indicators was considered as a
summary measure for each run, using different
execution times and distances.
3 EXPERIMENTS
The experiments were developed following a process
with three main phases: setup, runs and execution. A
workflow for the process is shown in Figure 2.
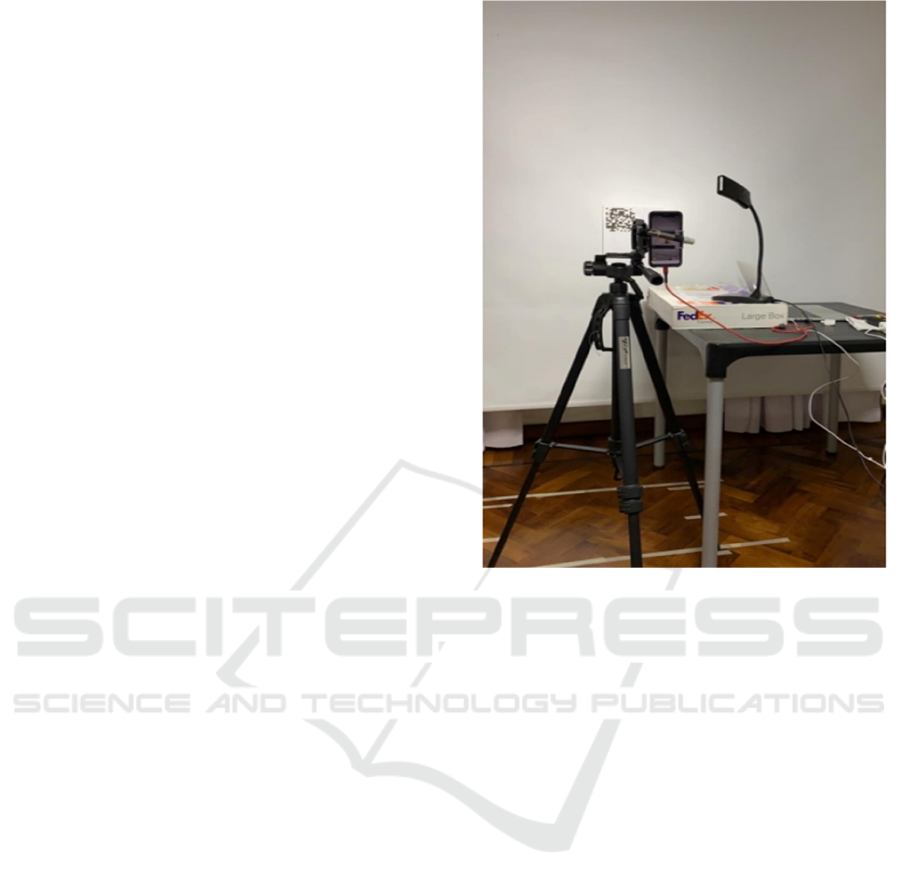
The setup phase consists in defining the
experiment parameters as follows. Five scenarios
were proposed: a QR code, a cube, a pyramid, a
cylinder and a sphere. An application was developed
to evaluate each scenario. The environment
illumination consisted in a white LED focusing on the
different target objects with a fixed intensity of 670
lx. The distances between the marker and the mobile
phone were defined as 0.40m, 0.60m and 0.80m. The
time that the applications were running at each
execution were 20s, 40s and 60s. Finally, the number
of runs was defined as totalRuns=50. Figure 1 shows
an example set up for the QR scenario.
The run phase consists in running the application
for a certain amount of time and stopping the
experiment if the max number of runs totalRuns is
reached.
Figure 1: Example of an experiment scenario.
The application phase consists in executing the
applications given a determined running time.
Different applications were executed depending on the
scenario. The developed applications ran
implementations in order to recognize fiducial and
natural markers. After a marker is recognized, a 3D
figure was rendered above the specified marker. These
implementations were based on the examples that
Wikitude SDK provides in their documentation. A
Node.js script was developed in order to execute each
run. The code, files and shapes are freely available at
https://github.com/radiumrocketapps/ResourcesARPa
per.
In order to prepare the experiments, 3D shapes of
10cm3 (cube, pyramid, cylinder and sphere) were
printed using a 3D printer. A round of 50 photos per
shape were taken to generate Wikitude Target Objects
(WTO). A rotating base on its own axis was used in
order to take the photos. WTO files were generated
using the Wikitude Studio, which the Wikitude SDK
uses to detect these figures and render virtual objects
over them. The 3D model used on the experiment was
a default file by Wikitude.
CPU and RAM Performance Assessment for Different Marker Types in Augmented Reality Applications
273
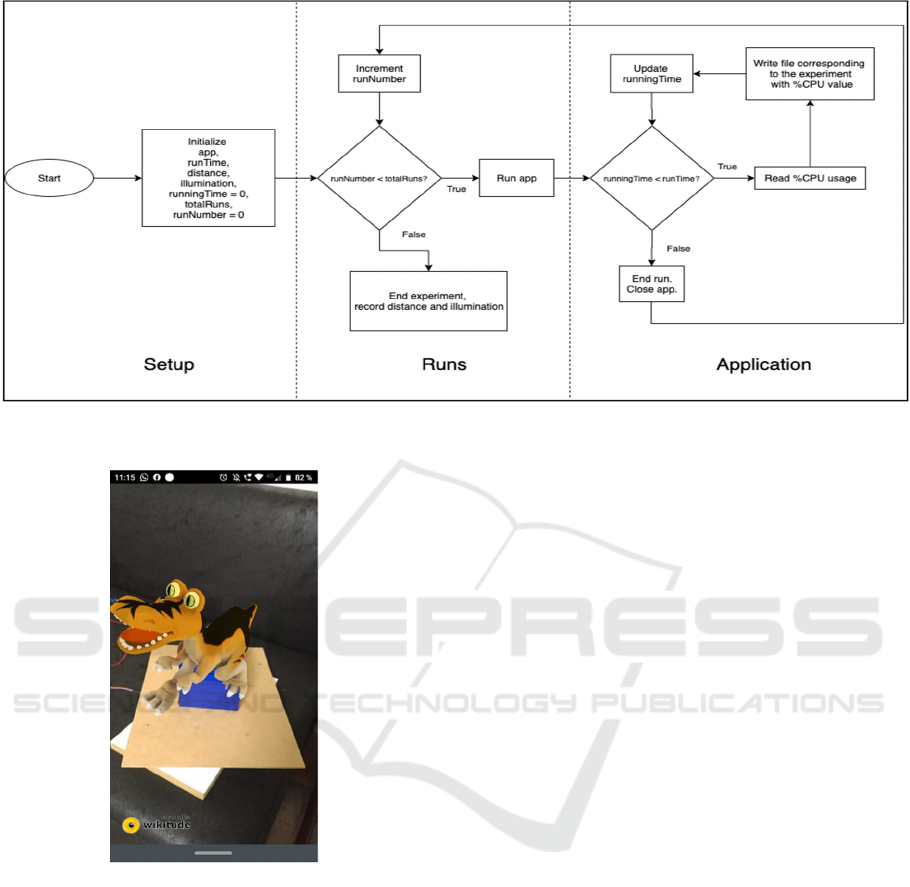
Figure 2: Workflow of the experiment.
Figure 3: Example of running application.
Figure 3 shows an example of the running
application, with a dinosaur being rendered on a
marker.
Once initiated, the app ran indefinitely until the
script stopped after the pre-defined periods of time set
on the setup phase were completed. A number of
totalRuns=50 runs were executed for each
combination of distance and figure. CPU and RAM
measurements were tracked on Android bundles. The
top command of the adb shell from Android Debug
Bridge tools was used in order to get the use
percentage of each one (ADB Shell Commands
(n.d)). This process takes measurements of the CPU
and RAM percentages given a determined time
interval. It also calculates an average of the taken
measurements given that determined time interval.
Runs were executed in a Samsung S9 [SM-G9600]
mobile device. This device has a CPU with 8 cores
[Qualcomm Snapdragon 845] and a 4GB RAM
[LPDDR4X]. Files were finally written with CPU and
RAM usage percentage values after each running
time.
4 RESULTS
After the experiment runs, a quantitative analysis was
developed in order to reflect the results as shown in
Tables 1 and 2. Table 1 shows the CPU means that
were obtained through the different experiments
performed. The rows show the types of experiments
carried out taking into account the running time in
seconds for each of them and the different distances.
In the columns the different markers are detailed.
Each number represents the overall usage
percentage average obtained after performing the 50
runs of the experiment. It can be seen in Table 1 that
the CPU results yields a maximum value of 16.02%
and a minimum of 10.15% (both values shown in bold
typeface). Except from the value from the fiducial
marker at 0.8m, the rest of the values are consistently
higher while the distance decreases. On the other
hand, all values from the natural approach (cube,
pyramid, cylinder and sphere) are lower than the
fiducial one. Different implementations of algorithms
on markers recognition might be the cause of this
difference. Regarding the natural markers, it can be
seen that the sphere figure required less CPU
GRAPP 2021 - 16th International Conference on Computer Graphics Theory and Applications
274
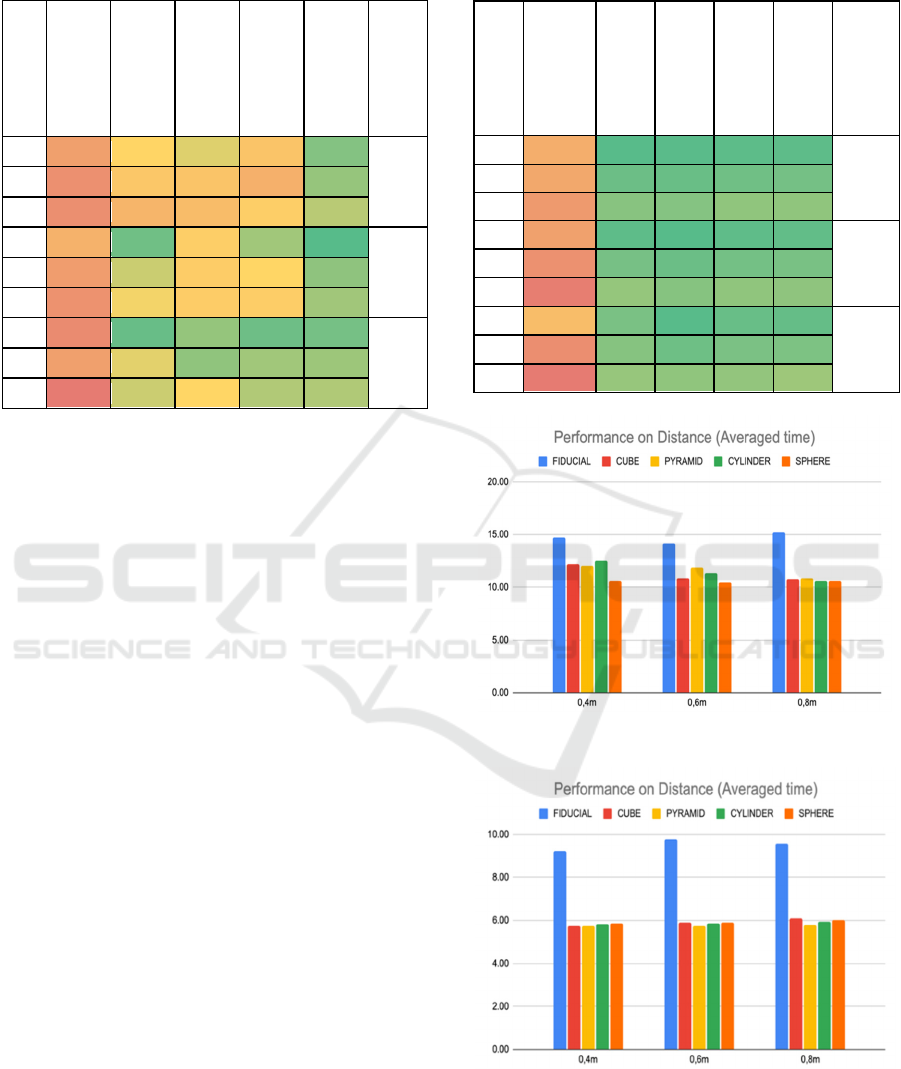
Table 1: Means for overall CPU. Color reference: green =
low, red = high, yellow = medium.
Time
Fiducial
Cube
Pyramid
Cylinder
Sphere
Distance
20s 14.17 11.44 11.14 12.33 10.47
0.4m 40s 14.99 12.17 12.30 13.37 10.62
60s 15.14 13.11 12.75 11.81 10.87
20s 13.26 10.35 11.81 10.70 10.15
0.6m
40s 14.33 10.99 11.92 11.38 10.56
60s 14.90 11.29 11.92 11.85 10.69
20s 15.29 10.28 10.61 10.32 10.38
0.8m 40s 14.20 11.17 10.57 10.70 10.67
60s 16.02 11.00 11.37 10.81 10.80
processing (all values in green, meaning low
comparative results) than the other figures.
In Table 2 the obtained means through the
experiments for RAM can be seen. As in Table 1, the
types of experiments performed in each running time
period are detailed in the rows. In the columns the
different marker types are detailed. Each number
represents the overall usage percentage average
obtained after performing the 50 runs of the
experiment.
The values for means in Table 2 show a behavior
that is consistent with the means obtained for CPU in
Table 1. In this table the highest value is 10.28% for
the fiducial marker in its longest period of testing (60
seconds) and the minimum value is 5.40%. Both
extreme values are marked in bold typeface.
A series of plots with the summary performance
measures for the evaluated running times within each
technology is shown in both Figures 4 and 5. It can be
seen that the means calculated for each of the
experiment describe a consistent behaviour, where the
maximum CPU usage was measured at the shortest
distance between the marker and the mobile phone.
Also the maximum CPU values were obtained at the
maximum period of times as well as the RAM values.
The highest values belong to the Fiducial marker
approach, while the sphere figure from the natural
markers approach assumes the lowest values and
figures as the square, cylinder and pyramid has
intermediate values between the fiducial marker and
the sphere.
Table 2: Means for overall RAM usage percentage. Color
reference: green = low, red = high, yellow = medium.
Time
Fiducial
Cube
Pyramid
Cylinder
Sphere
Distance
20s 8.99 5.43 5.46 5.50 5.52
0.4m
40s 9.14 5.71 5.68 5.79 5.84
60s 9.50 6.12 6.08 6.22 6.22
20s 9.33 5.51 5.40 5.53 5.58
0.6m
40s 9.74 5.87 5.70 5.83 5.91
60s 10.22 6.31 6.10 6.23 6.20
20s 8.59 5.91 5.42 5.65 5.62
0.8m
40s 9.85 6.09 5.75 5.94 5.98
60s 10.28 6.34 6.23 6.28 6.43
Figure 4: Bar plot for CPU values.
Figure 5: Bar plot for RAM values.
CPU and RAM Performance Assessment for Different Marker Types in Augmented Reality Applications
275
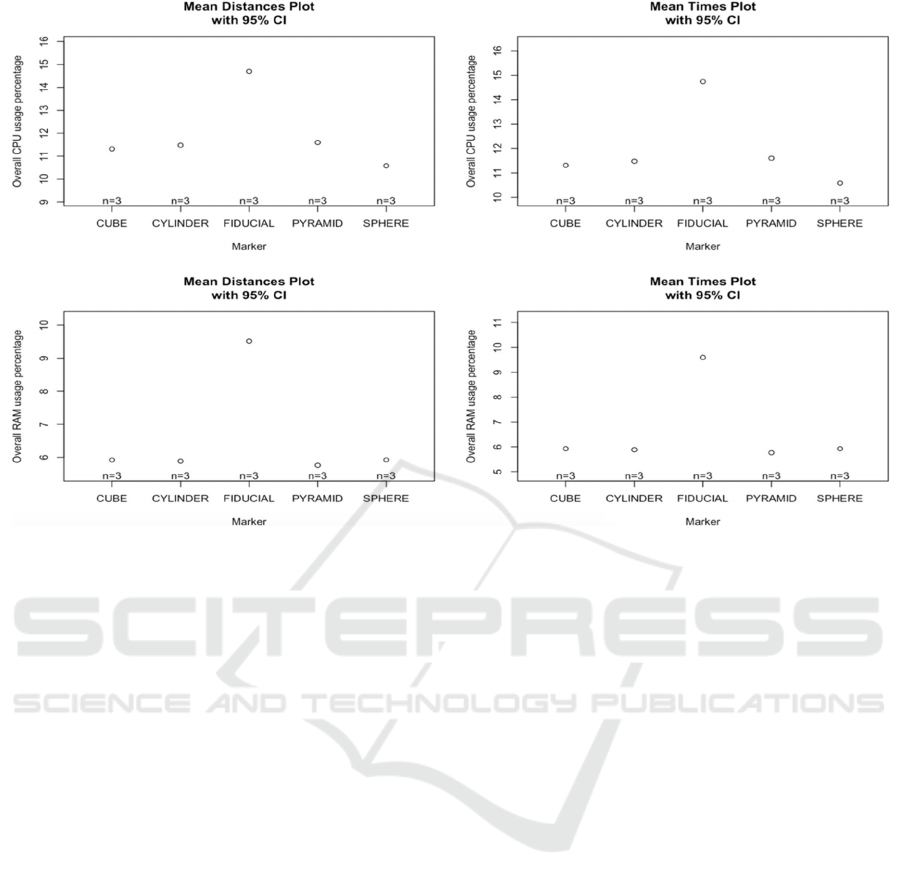
Figure 6: Plot of means for all the marker types.
Additionally, an ANOVA (0.05%) was performed to
verify if the differences between the fiducial approach
and the natural approach are statistically significant,
with positive results. It can be seen in the plot of
means shown in Figure 6 that the means are visibly
different for these approaches. Therefore, the fiducial
approach remains as a challenging scenario for
mobile performance in AR.
5 CONCLUSION
In this work, we performed a systematic assessment
on CPU and RAM performance for several types of
Augmented Reality markers such as QR, square,
pyramid, cylinder and sphere. Each type is
represented as an example of fiduciary and natural
approaches, respectively. Five applications were
developed, one for each marker type, and an
experiment was executed with a number of runs for
the application over different running times and
distances. Under the condition of the execution of
different scenarios, the sphere from of the natural
markers was the best approach in terms of CPU and
the pyramid in terms of RAM, with consistent values
over the entire experiment. The other figures showed
higher values for CPU and RAM consumption. As a
conclusion, we consider this work to be a valuable
resource for technical leaders and development teams
in the process of making an adequate decision when
building AR experiences, based on statistically
proved indicators.
For future research, we aim to consider
unexplored scenarios, which may involve measures
for more indicators, such as GPU. As well as this,
applications targeted to other use cases may be
analysed, for example different illumination set ups.
Finally, a study on iOS devices should be performed
in order to compare the performance in AR
applications for different operating systems.
REFERENCES
Qiao, X., Ren, P., Dustdar, S., Liu, L., Ma, H., & Chen, J.,
2019. Web AR: A promising future for mobile
augmented reality—State of the art, challenges, and
insights. Proceedings of the IEEE, 107(4), 651-666.
MacIntyre, B., Hill, A., Rouzati, H., Gandy, M., &
Davidson, B., 2011. The Argon AR Web Browser and
standards-based AR application environment. In 2011
10th IEEE International Symposium on Mixed and
Augmented Reality (pp. 65-74). IEEE.
Baek, A. R., Lee, K., & Choi, H., 2013. CPU and GPU
parallel processing for mobile augmented reality.
In 2013 6th International Congress on Image and
Signal Processing (CISP) (Vol. 1, pp. 133-137). IEEE.
GRAPP 2021 - 16th International Conference on Computer Graphics Theory and Applications
276

X. Qiao, P. Ren, S. Dustdar, L. Liu, H. M, J. Chen, 2019.
Web AR: A Promising Future for Mobile Augmented
Reality—State of the Art, Challenges, and Insights. In
Proceedings of the IEEE, vol. 107, no. 4, pp. 651-666
Specht, Marcus, 2012. Mobile Augmented Reality for
Learning.
Ćuković, S., Gattullo, M., Pankratz, F., Devedžić, G.,
Carrabba, E., & Baizid, K., 2015. Marker based vs.
natural feature tracking augmented reality visualization
of the 3D foot phantom. In Proceedings of the
International Conference on Electrical and Bio-
Medical Engineering, Clean Energy and Green
Computing.
Yabuki, N., Miyashita, K., & Fukuda, T., 2011. An
invisible height evaluation system for building height
regulation to preserve good landscapes using
augmented reality. Automation in Construction, 20(3),
228-235.
Baek, A. R., Lee, K., & Choi, H., 2013. CPU and GPU
parallel processing for mobile augmented reality.
In 2013 6th International Congress on Image and
Signal Processing (CISP) (Vol. 1, pp. 133-137). IEEE.
Hofmann, R., Seichter, H., & Reitmayr, G., 2012. A
GPGPU accelerated descriptor for mobile devices. In
2012 IEEE International Symposium on Mixed and
Augmented Reality (ISMAR) (pp. 289-290). IEEE.
Srinivasan, S., Fang, Z., Iyer, R., Zhang, S., Espig, M.,
Newell, D., ... & Haussecker, H., 2009. Performance
characterization and optimization of mobile augmented
reality on handheld platforms. In 2009 IEEE
International Symposium on Workload
Characterization (IISWC) (pp. 128-137). IEEE.
Qiao, X., Ren, P., Dustdar, S., & Chen, J., 2018. A new era
for web AR with mobile edge computing. IEEE Internet
Computing, 22(4), 46-55.
Azuma, R., Neely, H., Daily, M., & Leonard, J., 2006.
Performance analysis of an outdoor augmented reality
tracking system that relies upon a few mobile beacons.
In 2006 IEEE/ACM International Symposium on Mixed
and Augmented Reality (pp. 101-104). IEEE.
Wikitude. (n.d). Wikitude SDK API Reference. Retrieved
on September 2020 from
https://www.wikitude.com/external/doc/documentatio
n/latest/Reference/JavaScript%20API/index.html
ADB Shell Commands. (n.d). ADB Commands - Android
ADB Shell Commands Manual. Retrieved on
September 2020 from http://adbshell.com/commands.
STL Files. (n.d). A 3D printer STL file for each figure are
available are available in GitHub
https://github.com/radiumrocketapps/ResourcesARPap
er/tree/master/Real%20World%20Objects.
CPU and RAM Performance Assessment for Different Marker Types in Augmented Reality Applications
277
