
Capsule Networks with Intersection over Union Loss for Binary Image
Segmentation
Floris Van Beers
Bernoulli Institute, Department of Artificial Intelligence, University of Groningen,
Nijenborgh 9, Groningen, The Netherlands
Keywords:
Capsule Network, Deep Learning, Image Segmentation, Loss Function, Intersection over Union, Jaccard
Index.
Abstract:
With the development of Capsule Networks and their adaptation to the task of semantic segmentation, it has
become important to determine which hyperparameters perform best for this new type of image processing
model. One such parameter is the loss function, for which the baseline is usually cross entropy loss. In recent
work on other models, Intersection over Union (IoU) loss has been shown to be effective. This work explores
the application of IoU loss to segmentational capsule networks. For this purpose experiments are performed on
two datasets: a medical dataset, LUNA16, and a dataset of faces (LFW). Results show marginal to significant
improvements when using the IoU loss function as compared to the baseline Binary Cross-Entropy. From this
can be concluded that the search for optimal loss functions is not finished and new loss functions may further
improve performance of existing models.
1 INTRODUCTION
Image segmentation, the task of detecting, outlining
and pixel-wise labelling of objects in an image, can
be performed either with binary labels, making a dis-
tinction between foreground (the detected class) and
background (non-class) or on multiple labels. Ini-
tially, the task was performed using clustering tech-
niques and growing schemes (Haralick and Shapiro,
1985). In more recent developments, Artificial Neu-
ral Networks have been developed to improve results.
Feature detection in images was first expanded by the
use of Convolutional Neural Networks (CNNs) (Liu
and Deng, 2015; Krizhevsky et al., 2017) in classifica-
tion tasks on images. Since the task of image segmen-
tation has been picked up by the field of Deep Learn-
ing, through the use of fully convolutional CNNs
(Shelhamer et al., 2017), ever deeper and more com-
plex models have been developed to improve on the
task of image segmentation such as Tiramisu (Jegou
et al., 2017), U-Net (Ronneberger et al., 2015) and
SegNet (Badrinarayanan et al., 2017). These more
complex models have become not just more sophisti-
cated, but also larger, leading to rapid increases in the
number of trainable parameters. At the same time, the
development of the use of capsules in CNNs (Sabour
et al., 2017) led to doubts being cast on the imple-
mentation of the encoder segment of CNNs, due to
the loss of information in max-pooling layers. Since
fully convolutional CNNs use similar, if not the same,
encoders, the same doubts arise when using these en-
coders for image segmentation. Due to this a segmen-
tational CNN was developed using capsules named
SegCaps (LaLonde and Bagci, 2018).
Effectiveness of semantic segmentation has often
been determined with the use of metrics such as In-
tersection over Union (IoU) (Siam et al., 2018; Je-
gou et al., 2017; Ronneberger et al., 2015) or the Dice
metric (LaLonde and Bagci, 2018). Binary or cate-
gorical accuracy counts true positives and true nega-
tives as equally valid, relating these to all false posi-
tives and false negatives. IoU and Dice, in contrast,
ignore true negatives, relating only the true positives
to false positives and false negatives. In image seg-
mentation, where pixel-wise labeling can cause large
discrepancies between positive foreground pixels and
negative background pixels, especially when a de-
tected class is only a small portion of the image, bi-
nary and categorical accuracy may lead to naive solu-
tions focusing on labeling large parts of the image as
Van Beers, F.
Capsule Networks with Intersection over Union Loss for Binary Image Segmentation.
DOI: 10.5220/0010301300710078
In Proceedings of the 10th International Conference on Pattern Recognition Applications and Methods (ICPRAM 2021), pages 71-78
ISBN: 978-989-758-486-2
Copyright
c
2021 by SCITEPRESS – Science and Technology Publications, Lda. All rights reserved
71

background to achieve over-simplified results.
SegCaps (LaLonde and Bagci, 2018) has achieved
state of the art performance, using less parameters
than larger segmentational CNNs such as Tiramisu
(Jegou et al., 2017) or U-Net (Ronneberger et al.,
2015), while also avoiding the pitfalls surrounding
max-pooling layers. However, previous work on im-
age segmentation has also shown the issue when de-
veloping newer and more complex models, while ac-
cepting the status quo for given hyper-parameters,
such as the loss function (Zhao et al., 2017). This
was shown further by multiple studies implement-
ing new loss functions based on the Intersection-over-
Union (IoU) or applying these loss functions to exist-
ing models (van Beers et al., 2019; Yuan et al., 2017;
Rahman and Wang, 2016; Nowozin, 2014).
Combining these factors a question arises: Can
these state-of-the-art models be improved upon when
trained directly on metrics that can be shown to mea-
sure more accurately the effectiveness of those mod-
els in the image segmentation task? To determine
this, the IoU loss function (Rahman and Wang, 2016),
previously tested on earlier models (van Beers et al.,
2019), will be applied to the SegCaps (LaLonde and
Bagci, 2018) model. The choice of a loss function
based on IoU rather than Dice is explained in section
2.3.3.
The contributions of this work are three-fold.
First, the implementation of a previously developed,
state-of-the-art, segmentational capsule neural net-
work (SegCaps) is trained and tested on its origi-
nal dataset, LUNA16, and on Labeled Faces in the
Wild (LFW). The application of this model to a new
dataset should provide better insight into its effective-
ness. Secondly, this work shows the effectiveness of
the SegCaps network when trained using the weighted
Binary Cross-Entropy (BCE), as was done in the orig-
inal paper, and compares this with the effectiveness
of both the unweighted BCE and IoU loss functions.
Third, an argumentation will be provided in favor of
training on the IoU metric over training on the Dice
metric.
While previous work has already addressed the
BCE-IoU comparison (Rahman and Wang, 2016; van
Beers et al., 2019), this work adds a new dimension
to this comparison by using a state-of-the-art capsule
network. Previous comparisons were done with well-
established, but somewhat dated, CNNs. The devel-
opment of capsules requires similar comparisons of
loss functions in this new line of deep learning mod-
els.
Section 2 will describe the model, datasets and
loss functions used in this work. How these methods
were tested will be explained in section 3. The results
of these experiments are shown in section 4 and their
relevance is discussed in section 5. Finally, the con-
clusions for the field and any possibilities for further
research will be shown in section 6.
2 METHODS
2.1 Model: SegCaps
The model used in this research is the first imple-
mentation of a segmentational network using capsules
(Sabour et al., 2017). This model, called SegCaps R3
(LaLonde and Bagci, 2018), makes some important
adjustments to the implementation of the dynamic
routing algorithm. The initial benefit of the use of
capsules is that these networks do away with the con-
ventional max pooling layers, which throw away large
swaths of information. Capsule networks, in contrast,
use dynamic routing to have a closer relation of the
location of features between layers, resulting in im-
proved part-whole relationships. First used for classi-
fication tasks (Sabour et al., 2017), SegCaps expands
this functionality to segmentation tasks by using a
development referred to as deconvolutional capsules,
which function similarly to capsules, but can perform
the upsampling necessary for a pixel-wise segmenta-
tion. Due to the routing algorithms complexity, a sim-
ple implementation of this would result in a complex
network with extremely large amounts of parameters
and training time. As such, the second contribution
in the development of SegCaps is the use of locally-
connected routing. This refers to a technique where
each capsule in a layer only connects to a subset of
capsules that are in the same vicinity in the next layer.
This largely reduces parameters, as well as training
time.
A further feature of SegCaps which improves in-
put data preservation is that the final loss of the model
is balanced between the aforementioned upsampling
layer based on deconvolutional layers which deter-
mines segmentation and a second, more simplistic up-
sampling layer which attempts to recreate the input
data. This second layer also contributes to the over-
all loss of the model and by doing so ensures that the
features extracted from the input by the capsule layers
contain enough information to confidently reproduce
the input. The balance between the segmentation loss
and the reproduction loss is weighted by a parameter
to be set upon model creation named recon weight.
The full implementation of SegCaps is provided
with the original work (LaLonde and Bagci, 2018)
and is implemented using the Keras framework (Chol-
let et al., 2015). The original work describes the
ICPRAM 2021 - 10th International Conference on Pattern Recognition Applications and Methods
72
model as a u-shaped series of 11 convolutional and
deconvolutional capsule layers. The first layer is a
regular convolutional layer to extract primary fea-
tures. After the final deconvolutional capsule layer,
the model produces two outputs. The first output is
a segmentation of the image, the proposed task, the
second is a reconstruction of the positive input class,
which regularizes the model in favor of retaining as
much information as possible.
2.2 Datasets
The original implementation of SegCaps (LaLonde
and Bagci, 2018) used the Lung Nodule Analysis
(LUNA16) dataset. To determine cross-task effective-
ness of this model in all its iterations, a second dataset
was used to determine whether this changes the effec-
tiveness of the loss functions that are compared. This
second dataset is Labeled Faces in the Wild (LFW).
2.2.1 Lung Nodule Analysis 2016
The LUNA16 dataset is used to train systems on pro-
viding lung cancer screening on CT-scans to improve
Computer Aided Detection (CAD). There are 888 CT-
scans in the dataset, each consisting of several hun-
dred slices. To be used for nodule detection, each CT-
scan had to be analyzed by 4 radiologists, of which 3
had to agree on the location of a nodule for it to be
labeled as such.
To process the data for use in a segmentational
CNN, several steps where taken, based on preprocess-
ing supplied for future use with the implementation of
SegCaps (LaLonde and Bagci, 2018). The images are
split from a 3D CT-scan into separate images. The
input images are scaled between 0 and 1 by first ap-
plying an upper and lower bound, followed by a lin-
ear scaling. This results in normalized input images
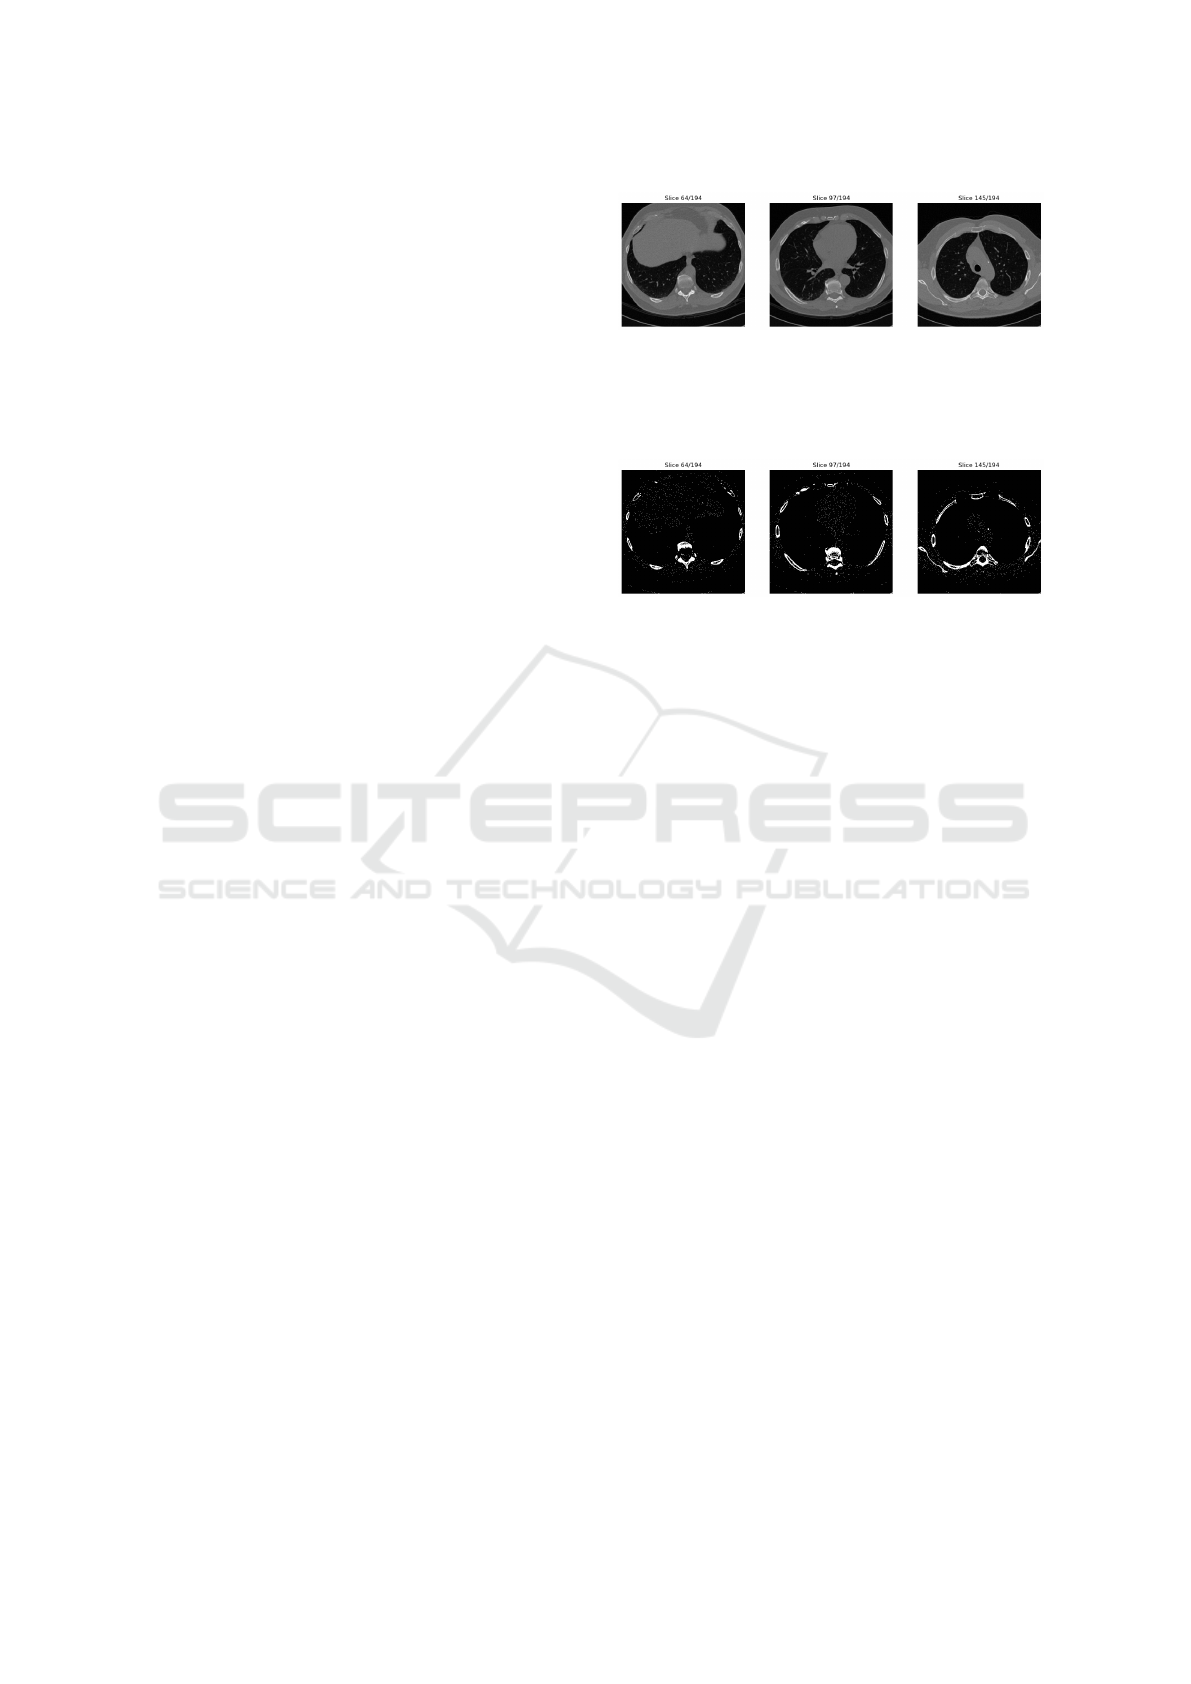
shown in Figure 1. Corresponding to each of the input
images, a mask is created where the trachea, spine and
possible lung nodules are labeled as 1 (white). Empty
lung volume, background around the body and other
tissues are labeled as 0. The decision boundaries for
the creation of the mask are made with the help of an
automated algorithm (van Rikxoort et al., 2009). The
result is shown in Figure 2. Since nodules are labeled
as non-lung within lung tissue, they can be detected
as anomalies by observation or algorithmically.
While the original paper on SegCaps used
LUNA16, it is noted that 10 out of 880 CT scans were
omitted due to poor labeling. It is not noted which
scans are removed. Therefore, this adaptation of the
data can not be reproduced.
Figure 1: Example input: 3 slices of the same CT-scan, a
data point in the LUNA16 dataset. Air/background is la-
beled 0, i.e. black. Bone structures are labeled 1, i.e. white.
Other tissues are between 0 and 1, i.e. various shades of
grey.
Figure 2: Expected label: 3 slices of the same CT-scan, a
data point in the LUNA16 dataset. Bone, trachea and lung
nodules are labeled as 1, other tissues and empty volume is
labeled as 0.
2.2.2 Labeled Faces in the Wild
Labeled Faces in the Wild: Part Labels (Kae et al.,
2013) consists pixel-wise labeled images of faces.
There are 2927 RGB images matched with the same
number of labels. The label images have three labels,
namely face (skin), hair and background. These im-
ages where preprocessed to follow the same structure
as the images of LUNA16. To do this, the input im-
ages were converted to greyscale. The output images
were converted to contain binary labels by combining
the face (skin) and hair labels into a single face la-
bel and keeping the background as background. This
results in the same normalized input images and bina-
rized output images for both datasets.
2.3 Loss Functions
For this work three loss functions were compared:
the Binary Cross-Entropy (BCE), as it is the industry
standard, the weighted BCE, as it is used by the orig-
inal paper, and the Intersection over Union (IoU) as a
proposition to improve on the performance compared
to both other loss functions.
2.3.1 Binary Cross-entropy
The cross entropy loss function is used as a baseline
comparison to the IoU loss function. In recent works,
cross entropy has been used either in its base form
(Ronneberger et al., 2015; Jegou et al., 2017) or a
weighted version (LaLonde and Bagci, 2018).
Capsule Networks with Intersection over Union Loss for Binary Image Segmentation
73

The formula for Binary Cross-Entropy (BCE)
loss, as shown in Equation 1, shows how the true la-
bel T is compared to the output P. In the formula T
x
and P
x
refer to single elements of the true label and
the output, respectively.
L
BCE
=
∑
x
−(T
x
logP
x
+ (1 − T
x
)log(1 − P
x
)) (1)
To avoid mathematically undefined behaviour, i.e.
log(0), which would occur when P
x
= 1 or P
x
= 0,
the Keras framework adjusts the values of P to the
range [ε, 1 − epsilon, rather than the range [0 − 1].
The BCE loss function puts equal value on both true
positives and true negatives and penalizes false pos-
itives and false negatives equally. Due to the equal
importance of true positives, true negatives, false pos-
itives, and false negatives, the BCE loss function is
closely connected to a scoring metric such as binary
accuracy. A problem that may arise from the use of a
BCE loss function occurs when a dataset consists of
largely background pixels and only a small number of
foreground pixels. This may result in a naive solution
where all except the most obvious foreground pixels
are labeled as background. This ensures a good binary
accuracy and low BCE loss, while not solving the task
very well, since the number of true positives is poor.
The model effectively overfits on negative samples.
To adjust for this undesirable behaviour, an ad-
justed version of BCE is sometimes used. Here, the
background and foreground labels are weighted with
a factor of their occurrence in the data. This ensures
that during training, the smaller number of foreground
pixels will be considered equally important as the
larger number of background pixels. This may solve
some of the issues caused by classic BCE and avoid
the naive solution, especially for sufficiently imbal-
anced datasets.
2.3.2 Intersection over Union
To avoid misleadingly high accuracy values caused
by the issues discussed in section 2.3.1, segmenta-
tion research has long used Intersection over Union
(IoU) as an indicator for success of the segmentation.
This avoids evaluating a model’s performance on un-
clear metrics, such as only observing binary accuracy.
However, many models scored on IoU are still trained
on BCE. This means the model is more accurately
scored, but its learning process may still fall into naive
solutions associated with accuracy with respect to im-
balanced datasets.
To remedy this, the IoU can be used as a loss func-
tion directly (Rahman and Wang, 2016; van Beers
et al., 2019). Original IoU, as defined by Equation
2, requires the use of binary values 0 and 1 for use
with the set operators. Here T refers to the true label
and P to the model output. This implementation does
not work for two reasons. First, in this work, Seg-
Caps outputs values between 0 and 1 for each pixel.
Second, these set symbols are non-differentiable.
IoU =
|T ∩ P|
|T ∪ P|
(2)
Equation 3 shows an approximation of IoU , here
named IoU
0
. This adaptation functions identically for
each set of binary values for T and P, but can also be
applied to values between 0 and 1. By replacing the
set symbols by the mathematical operators of addition
and element-wise multiplication, the equation can be
applied to any value and becomes differentiable.
IoU
0
=
|T ∗ P|
|T + P − (T ∗ P)|
=
I
U
(3)
Finally, the equation requires an inversion in order to
make minimizing desirable rather than maximizing.
This produces Equation 4. L
IoU
, when implemented
in its differentiable form, can be used by the Keras
framework directly to compute the derivatives and use
these in training.
L
IoU
= 1 − IoU
0
(4)
2.3.3 Dice
A metric comparable to IoU which is often used in
segmentation scoring is the Dice coefficient. Equa-
tions 5 and 6 show each metric in a form that can be
easily compared to the other. These equations show
that, while both metrics ignore true negatives (TN),
their relation of true positives (TP) to false positives
(FP) and false negatives (FN) is scaled with a factor
of 2. This means IoU scores instances of bad classi-
fication more negatively than does Dice. This means
that in instances where practical use depends signif-
icantly on the detection of the positive class, for in-
stance when the positive class is a tumour and the
negative class is healthy tissue, a focus on finding true
positives can be considered a good feature. However,
when outlining objects in general - including niche
cases and difficult boundaries - an equal balance be-
tween correct positive classification and errors is more
useful. This leads to the choice of using a loss func-
tion that is an approximation of the IoU metric, rather
than an approximation of the Dice metric.
IoU =
T P
T P + FP + FN
(5)
Dice =
2T P
2T P + FP + FN
(6)
ICPRAM 2021 - 10th International Conference on Pattern Recognition Applications and Methods
74
3 EXPERIMENTS
To determine the effectiveness of the SegCaps net-
work in different segmentation tasks using the BCE,
weighted BCE and IoU loss functions a series of ex-
periments was set up. In order to compare the results
of these experiments to the previous performance of
SegCaps (LaLonde and Bagci, 2018), the parameters
of the experiments were based as much as possible on
the experiments in the original paper. This includes
the use of the Dice metric for final comparison, re-
gardless of the argumentation of the advantages of
using IoU as a metric and loss function over Dice.
For each combination of dataset and loss function, k-
folds cross-validation was used with a k value of 4.
Furthermore, the hyperparameters of the model were
kept similar to the original implementation, but not
blindly. After a parameter sweep, the value for the
weight of the reconstruction loss was adjusted from
131.072 to 100, as this gave the segmentation part of
the model more room to develop. The final hyperpa-
rameters can be found in Table 1.
Table 1: Experimental parameters.
Parameter Value
Shuffle Data True
Augment Data True
Recon weight 100.0
Learning Rate 0.0001
Batch-size 1
LR Patience 5
Stopping Patience 25
Optimizer Adam
In Table 1, two patience values are noted. First,
LR patience determines after how many epochs of no
improvement to the validation Dice score the learn-
ing rate should be reduced. Second, the stopping pa-
tience determines after how many epochs of no im-
provement to the Dice score the training is finished.
3.1 Data Augmentation
Setting the data augmentation parameter to true en-
ables the model to perform any of a number of
changes to the input images. Each of these changes
can be applied consecutively, meaning a single image
has multiple augmentations performed on it. Table
2 shows the different types of augmentation imple-
mented and the possibility of their application to the
image. The augmentations are applied to the training
images, but not the validation images.
Table 2: Data augmentation methods.
Augmentation type Chance
Rotation 10%
Elastic transform 20%
Shift 10%
Shear 10%
Zoom 10%
Flix x-axis 10%
Flip y-axis 10%
Salt and pepper 10%
4 RESULTS
4.1 Quantitative Results
Tables 3 and 4 show the results of 4 fold k-folds on
the LUNA16 and LFW datasets, respectively. For col-
umn, the value in bold indicates the use of which loss
function performed best.
Table 3: Results LUNA16 dataset: The results of k-folds
testing using three loss functions, where F1 through F4
corresponds with folds 1 through 4. BCE: Binary Cross-
Entropy. WBCE: Weighted Binary Cross-Entropy. IoU: In-
tersection over Union. The highest score on each fold and
the mean is labeled in bold.
Loss F 1 F 2 F 3 F 4 Mean
BCE 78.17 67.22 76.26 73.80 73.86
WBCE 70.95 71.40 70.03 68.42 70.20
IoU 82.63 79.11 79.50 79.27 80.13
Table 4: Results LFW dataset: The results of k-folds test-
ing using three loss functions, where F1 through F4 corre-
sponds with folds 1 through 4. BCE: Binary Cross-Entropy.
WBCE: Weighted Binary Cross-Entropy. IoU: Intersection
over Union. The highest score on each fold and the mean is
labeled in bold.
Loss F 1 F 2 F 3 F 4 Mean
BCE 89.29 91.20 90.07 90.94 90.38
WBCE 90.25 89.87 90.86 90.48 90.37
IoU 89.68 91.30 91.69 91.02 90.92
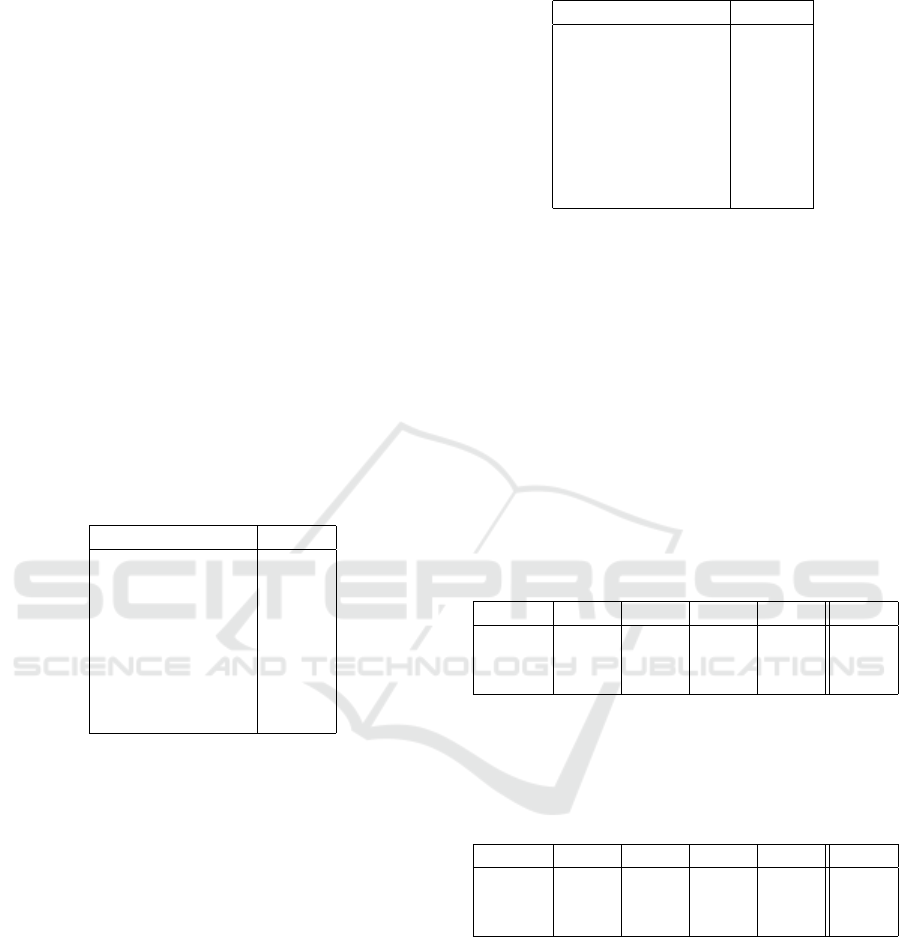
4.2 Qualitative Results
Figures 3, 4, and 5 show the final output of the trained
model on the same image at the same slices.
5 DISCUSSION
As shown by Tables 3 and 4, for both domains, us-
ing the IoU loss function provides the highest Dice
scores across all folds, subsequently leading to the
Capsule Networks with Intersection over Union Loss for Binary Image Segmentation
75
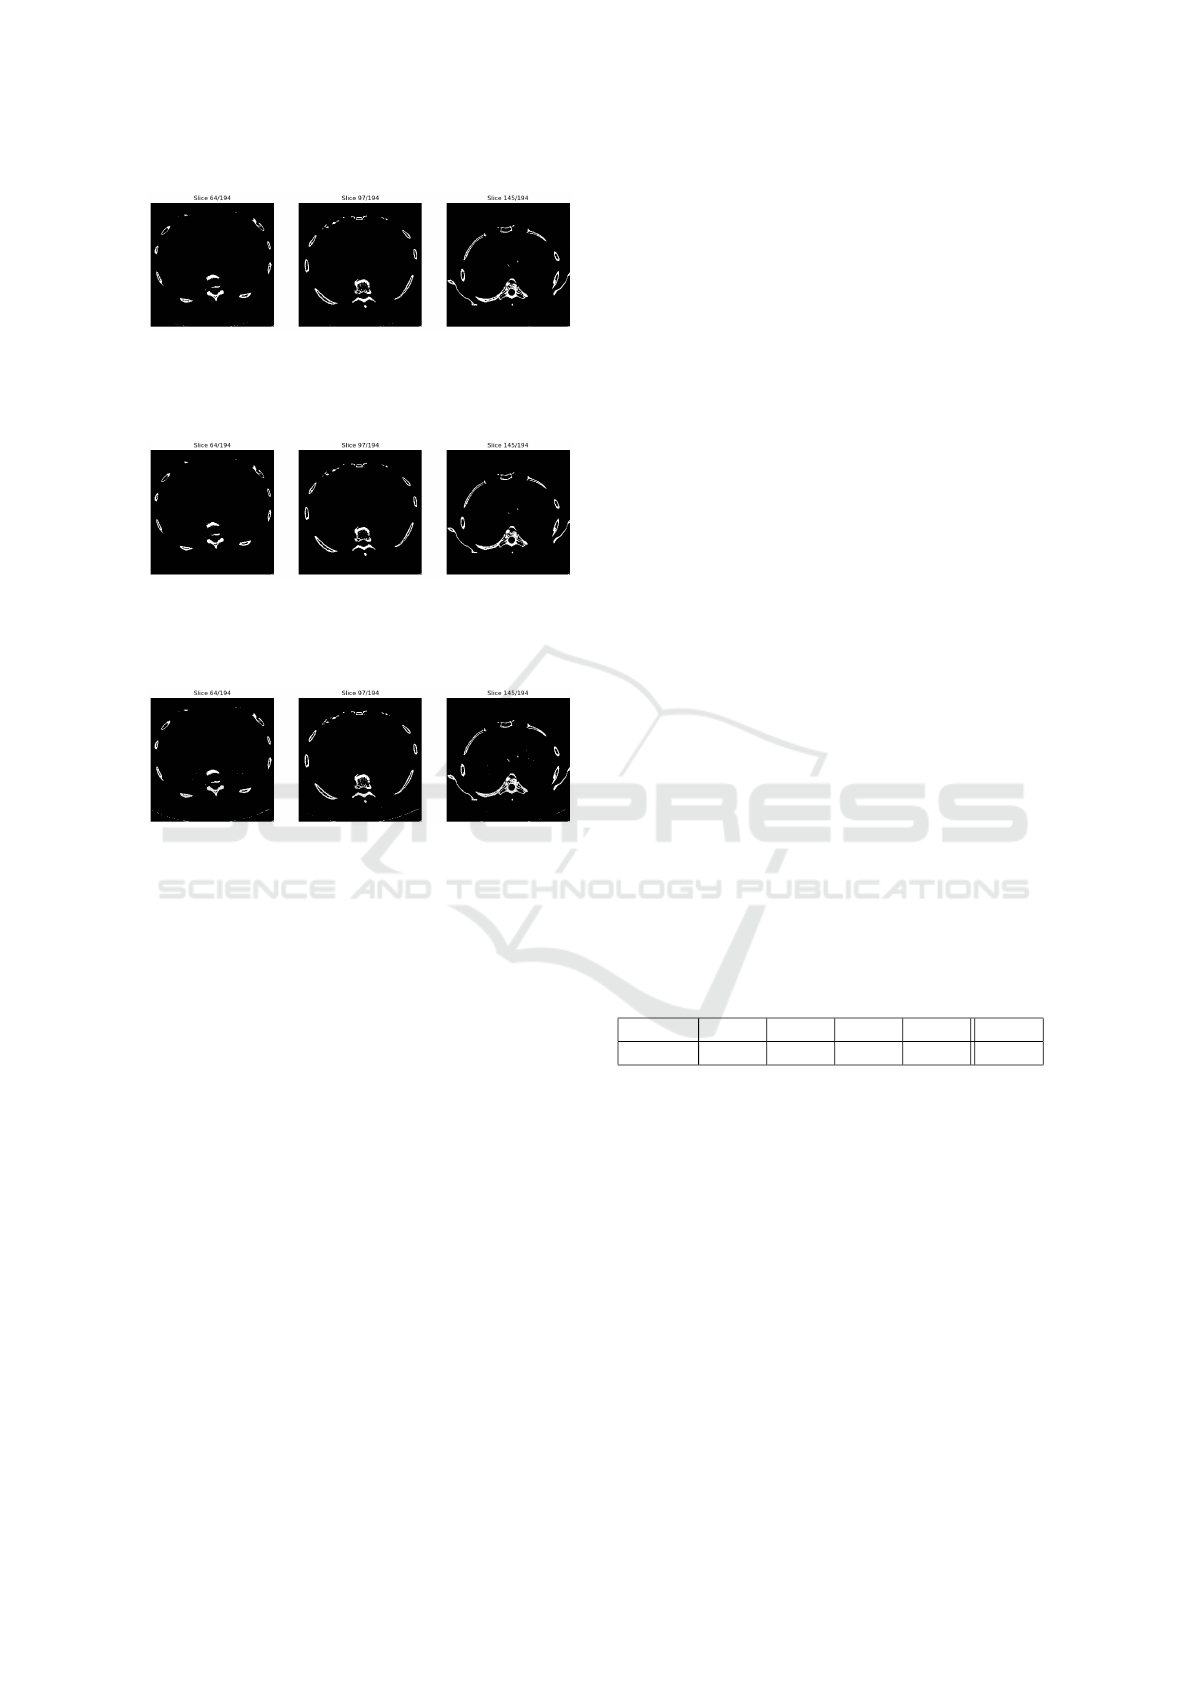
Figure 3: Final result of the trained model with IoU loss
on the same CT-scan as in Figure 1. Bone structures are
labeled 1, i.e. white. Air, background, and other tissues are
labeled 0, i.e. black.
Figure 4: Final result of the trained model with BCE loss
on the same CT-scan as in Figure 1. Bone structures are
labeled 1, i.e. white. Air, background, and other tissues are
labeled 0, i.e. black.
Figure 5: Final result of the trained model with weighted
BCE loss on the same CT-scan as in Figure 1. Bone struc-
tures are labeled 1, i.e. white. Air, background, and other
tissues are labeled 0, i.e. black.
best Dice score for mean results. Applying pairwise t-
tests to these results confirms significantly better per-
formance by IoU on the LUNA16 dataset compared
to BCE (p-value of 0.04761) and weighted BCE (p-
value of 0.001436).
Unfortunately, while IoU scores higher on all
counts for the LFW datasets, the same claim can not
be made. Here, the p-values are 0.23 and 0.2755 com-
pared with BCE and weighted BCE, respectively. The
difference between BCE and weighted BCE was not
significant for either LUNA16 (p-value of 0.2596) or
LFW (p-value of 0.9864).
What these values show is that, while using an IoU
loss function scores higher in all but one training set-
ting, the variation is such that no conclusive claims
can be about about the LFW domain. However, for
the LUNA16 domain, we can say with statistical cer-
tainty that an IoU loss function performs better than a
BCE baseline, or the weighted BCE used in previous
work.
This distinct difference in performance in the dif-
ferent domains can be attributed to any number of
factors, but most importantly will be the difference
in labeling and the density of the datasets. As ar-
gued previously, the IoU loss function will show its
benefits most effectively in datasets that are not bal-
anced equally between background and foreground.
As such the benefits of this loss function will prove
more prominent when using an imbalanced dataset
such as LUNA16, which has a ratio of 28.9 of nega-
tive to positive samples, compared to a more balanced
dataset of LFW, which has a ratio of 2.15 of negative
to positive samples.
A second point of interest in the results is a com-
parison of the weighted BCE values in Table 3 and the
results of the original work on SegCaps presented in
Table 5. The difference in mean results of 18.35% is
staggering. In this work, the same model, data, hy-
perparameters and early stopping is used as in the
original paper (LaLonde and Bagci, 2018) with a
small number of exceptions. First, a single parame-
ter, the reconstruction weight, has been lowered from
131.072 to 100.00 as it proved to be more effec-
tive. Second, and more importantly, the original work
omits 10 out of 880 CT scans of the LUNA16 dataset
due to bad labeling. Since no documentation could be
found on which scans were removed, this noteworthy
step in preparation could not be recreated. Since each
CT scan is split up in to anywhere from 100 to 350
separate slices, used as input images, the removal of
several thousand poorly labeled images may increase
the stability of the dataset by such an amount as to
explain this large discrepancy in performance.
Table 5: K-Folds results of the SegCaps R3 network on
LUNA16, where F1 through F4 corresponds with folds 1
through 4. Weighted Binary Cross-Entropy loss is used as
presented by the original paper(LaLonde and Bagci, 2018).
Loss F 1 F 2 F 3 F 4 Mean
WBCE 98.50 98.52 98.45 98.47 98.48
Finally, the qualitative results show specific ef-
fects that can explain the results from Table 3. Using
Figure 2 as the original label, comparing Figures 3, 4
and 5 shows the critical points where performance dif-
fers. When comparing the results for BCE with both
IoU and weighted BCE, we can see a distinct lack of
details. As is to be expected, the use of BCE loss over-
generalizes the larger class and misses out on details
in the under-represented class. To counteract this ef-
fect, the original paper uses weighted BCE, such that
the model will assign more value to the underrepre-
sented class. However, when comparing the results
for IoU and weighted BCE, the details in fine-grained
structures are more pronounced with IoU, compared
to BCE, but even more so with weighted BCE. To ex-
plain why, then, IoU scores better quantitatively, Fig-
ICPRAM 2021 - 10th International Conference on Pattern Recognition Applications and Methods
76

ure 5 can be compared to Figure 2. This shows that
the white lines in the weighted BCE output are over-
represented, especially in the bottom region. From
this information it can be stated that weighted BCE
assigns such weight to the underrepresented class that
some overfitting will occur on it, resulting in higher
predictions of that class than is realistic.
6 CONCLUSION
After careful discussion of the experimental results,
several conclusions can be drawn. First, that, with
the inclusion of the application of IoU on capsule net-
works, together with previous work (van Beers et al.,
2019; Rahman and Wang, 2016), a more generalized
claim can be made that using the IoU loss function is a
reasonable step to consider in optimizing any segmen-
tational neural network. In addition, it can be claimed
that the use of capsule layers does not respond differ-
ently to the use of count-based, rather than logarith-
mic, loss functions than do other models from these
previous works. The results presented here do not
mean that it is objectively proven that IoU is the bet-
ter option throughout domains or that IoU should be-
come the new baseline. Rather, the availability of a
loss function based on IoU should be part of a seg-
mentational neural net developer’s toolkit. To further
enhance this toolkit, however, similar research can be
done into other loss functions, such that a parameter
sweep on this particular aspect of a network will al-
ways yield optimal results. Another example of this
is a loss function based on the Dice metric (Lguensat
et al., 2018; Yuan et al., 2017), which can be used in
instances where true positives are much more impor-
tant than avoiding false positives and false negatives.
Secondly, it can be seen that the adaptation of a
dataset does much to interfere with the results on said
dataset. The removal of 10 ct scans out of 880 from
the LUNA16 dataset in previous work (LaLonde and
Bagci, 2018) hampers any attempt to reproduce these
studies, but also seems to reduce the average error by
92.35%, which is a staggering amount. While prepro-
cessing, or manual labor, can be used to adapt real
world samples in similar ways so as to retain high
scores from a model trained on an adapted dataset,
the goal of machine learning should always be real
world applicability, regardless of the noise in the real
world data. As such, it would be beneficial in future
research to search for optimizations of the SegCaps
network on the full, noisier dataset.
Finally, the results show that significant differ-
ences remain between different domains, such as lung
segmentation and face detection. This can be at-
tributed to a number of factors, for example complex-
ity of the data, size of the dataset, balance in fore-
ground and background pixels, etc. It might be bene-
ficial to get a clearer view of the effect each of these
factors has on the effectiveness of the SegCaps model,
but also other models. This could be further explored
by performing comparisons of IoU loss with other
loss functions in a broader selection of domains in
an attempt to detect a pattern of which loss function
should predictably perform better on which task. If
this is in any way generalizable, the parameter sweeps
required to determine optimal loss functions can be
greatly reduced in complexity.
REFERENCES
Badrinarayanan, V., Kendall, A., and Cipolla, R. (2017).
SegNet: A deep convolutional encoder-decoder ar-
chitecture for image segmentation. IEEE Transac-
tions on Pattern Analysis and Machine Intelligence,
39(12):2481–2495.
Chollet, F. et al. (2015). Keras. https://keras.io.
Haralick, R. M. and Shapiro, L. G. (1985). Image segmen-
tation techniques. Computer Vision, Graphics, and
Image Processing, 29(1):100 – 132.
Jegou, S., Drozdzal, M., Vazquez, D., Romero, A., and Ben-
gio, Y. (2017). The one hundred layers tiramisu: Fully
convolutional densenets for semantic segmentation. In
2017 IEEE Conference on Computer Vision and Pat-
tern Recognition Workshops (CVPRW), pages 1175–
1183.
Kae, A., Sohn, K., Lee, H., and Learned-Miller, E. (2013).
Augmenting CRFs with Boltzmann machine shape
priors for image labeling. In the IEEE Conference on
Computer Vision and Pattern Recognition (CVPR).
Krizhevsky, A., Sutskever, I., and Hinton, G. E. (2017). Im-
agenet classification with deep convolutional neural
networks. Commun. ACM, 60(6):84–90.
LaLonde, R. and Bagci, U. (2018). Capsules for object seg-
mentation. ArXiv, abs/1804.04241.
Lguensat, R., Sun, M., Fablet, R., Tandeo, P., Mason, E.,
and Chen, G. (2018). Eddynet: A deep neural net-
work for pixel-wise classification of oceanic eddies. In
IGARSS 2018 - 2018 IEEE International Geoscience
and Remote Sensing Symposium, pages 1764–1767.
Liu, S. and Deng, W. (2015). Very deep convolutional
neural network based image classification using small
training sample size. In 2015 3rd IAPR Asian Confer-
ence on Pattern Recognition (ACPR), pages 730–734.
Nowozin, S. (2014). Optimal decisions from probabilistic
models: The intersection-over-union case. In 2014
IEEE Conference on Computer Vision and Pattern
Recognition, pages 548–555.
Rahman, M. A. and Wang, Y. (2016). Optimizing
intersection-over-union in deep neural networks for
image segmentation. In International Symposium on
Visual Computing.
Capsule Networks with Intersection over Union Loss for Binary Image Segmentation
77

Ronneberger, O., Fischer, P., and Brox, T. (2015). U-
Net: Convolutional networks for biomedical image
segmentation. In Navab, N., Hornegger, J., Wells,
W. M., and Frangi, A. F., editors, Medical Image Com-
puting and Computer-Assisted Intervention – MICCAI
2015, pages 234–241, Cham. Springer International
Publishing.
Sabour, S., Frosst, N., and Hinton, G. E. (2017). Dynamic
routing between capsules. In Proceedings of the 31st
International Conference on Neural Information Pro-
cessing Systems, page 3859–3869.
Shelhamer, E., Long, J., and Darrell, T. (2017). Fully con-
volutional networks for semantic segmentation. IEEE
Transactions on Pattern Analysis and Machine Intel-
ligence, 39(4):640–651.
Siam, M., Gamal, M., Abdel-Razek, M., Yogamani, S.,
and J
¨
agersand, M. (2018). RTSeg: Real-time se-
mantic segmentation comparative study. CoRR,
abs/1803.02758.
van Beers, F., Lindstr
¨
om, A., Okafor, E., and Wiering,
M. A. (2019). Deep neural networks with intersec-
tion over union loss for binary image segmentation.
In Proceedings of the 8th International Conference on
Pattern Recognition Applications and Methods.
van Rikxoort, E., Hoop, B., Viergever, M., Prokop, M., and
Ginneken, B. (2009). Automatic lung segmentation
from thoracic computed tomography scans using a hy-
brid approach with error detection. Medical physics,
36:2934–47.
Yuan, Y., Chao, M., and Lo, Y. C. (2017). Automatic
skin lesion segmentation using deep fully convolu-
tional networks with Jaccard distance. IEEE Trans-
actions on Medical Imaging, 36(9):1876–1886.
Zhao, H., Gallo, O., Frosio, I., and Kautz, J. (2017).
Loss functions for image restoration with neural net-
works. IEEE Transactions On Computational Imag-
ing, 3(1):47–57.
ICPRAM 2021 - 10th International Conference on Pattern Recognition Applications and Methods
78
