Measuring Sustainability Performance in the Product Level
Qinru Wang
a
, Qing Yang
b
and Mingxing Chang
c
School of Economics and Management, University of Science and Technology Beijing, 30 Xueyuan Road, Beijing, China
Keywords: Sustainability, Measurable Indicator, Product Level, Life Cycle, DSM (Design Structure Matrix).
Abstract: Sustainability is becoming increasingly important in new product development as modern society demands
technicality, customer satisfaction, and economic efficiency during a product’s life cycle. Previous papers
have commented more on the environmental aspects of sustainability in project management, whereas less
attention has been paid to the measurable indicators of products. The knowledge about the product process
structure is beginning to use sustainability indicators as part of the approach. Based on this idea, this paper
suggests a combination of measurable indicators of sustainability that can be used in the product process
structure of the construction industry. The aim is to identify a product process structure that is compatible
with sustainable project management. The idea of product design structure matrix (DSM) will be introduced
to identify the sustainability of products. By analysing the different dimensions of the measurable indicators,
the sustainable products can be compared. This provides an integrated view of the product process structure
when developing new products. This approach will then be applied to the smartphone industry as an illustrate
example, which will provide ideas to improve the sustainability of new smartphone development.
1 INTRODUCTION
Sustainability has been a major source of discussion
for some years. Shareholders use the term
‘sustainable’ to describe their products and activities.
They all state that they are trying to protect natural
resources and the global environment. Indeed, the
manufacturing industry has actually been achieving
some form of sustainability (Eskerod and Huemann,
2013). The creation of high-quality products at
competitive prices is what makes manufacturers
profitable. As a result, throughout history,
manufacturers have been trying to find ways to make
the machining process more efficient and cost-
effective, including the continuous development of
advanced and sophisticated production machinery
and improved cutting tools, and the optimization of
the entire cutting system (Silvius and Schipper,
2014). Specific strategies that have been developed
include high-speed, high-feed, high-performance,
and digital machining.
Sustainability is generally divided into three
dimensions: economic, environmental, and social. In
a
https://orcid.org/0000-0002-3267-7804
b
https://orcid.org/0000-0002-7529-9065
c
https://orcid.org/0000-0003-4672-9406
the manufacturing factory, the sustainability of the
production process and the sustainability of the
conveyance are both essential as they can have
significant social and environmental effects (Pimmler
and Eppinger, 1994; Browning, 2001). A sustainable
product process structure is specifically relevant for
industries that have a large output with a lot of waste.
In the multi-product life cycle, it is also a system that
is turn to concentrate on sustainability, but the
absorption is more on the environmental dimension
of the product itself. Sustainability has dominated
international attention, due largely to the society that
unfavorable environmental effect is increasingly
concentrated (Ma and Kremer, 2016; Okudan et al.,
2013).
Sustainability is an essential project purpose
equilibrating other aspect of costs and earnings.
Sustainability in the production process means the use
of practices that ensure the process is economically,
socially and environmentally acceptable throughout
its life cycle (Silvius and Schipper, 2014). Sustainable
project management relates and develop on
stakeholder pattern (Eskerod and Huemann, 2013),
includes life cycle considerations and development
Wang, Q., Yang, Q. and Chang, M.
Measuring Sustainability Performance in the Product Level.
DOI: 10.5220/0010301102410247
In Proceedings of the 10th International Conference on Operations Research and Enterprise Systems (ICORES 2021), pages 241-247
ISBN: 978-989-758-485-5
Copyright
c
2021 by SCITEPRESS – Science and Technology Publications, Lda. All rights reserved
241
(Labuschagne and Brent, 2005), and ensures the three
dimensions’ measurable indicators of sustainability
are adhered to products (Silvius and Schipper, 2014).
Klakegg (2009) implied different thinking for the
demand of sustainability in project management: lack
of interest, lack of participation from main
stakeholders, low profits of sustainability compared
to the required investment, and dynamic
environment.
The relationship between sustainability and the
product is being discussed in an increasing number of
papers (Silvius and Schipper, 2014; Aarseth et al.,
2017), with ‘green’ or ‘sustainable’ products having
been determined as one of the most important
international topics (Alvarez-Dionisi et al., 2016).
Product development activities typically begin by
recording customers’ requirements and society’s
demands (Eppinger et al., 1994; Browning, 2001).
By investigating the production process in the
manufacturing industry, decision makers can
determine the sustainability of different products. The
product design structure matrix (DSM) is a matrix-
based analytical method created by Steward (1981)
and developed by Pimmler and Eppinger (1994) to
aid with multi-project management. A matrix
representation is also used to indicate different
manufacturing of three dimensions (Pimmler and
Eppinger, 1994). Furthermore, in the project process
structure, developments in manufacturing industry
have been indicated as communication system of
interacting new product that generate their profits for
more earnings (Sosa et al., 2004; Cataldo et al., 2006).
2 MEASURABLE INDICATORS
OF SUSTAINABILITY AND
THE MANAGEMENT LIFE
CYCLE BASED ON PRODUCT
2.1 Sustainability of the Product Life
Cycle
Sustainability based on the production process
structure is a comprehensive, time-based method,
which indicates the structural performance based on
the three measurable indicators of sustainability
throughout the product’s life cycle. A life cycle
analysis has the ability to evaluate the social,
economic, and environmental impacts of the product
process structure throughout its entire life cycle,
allowing it to determine the most suitable product that
meets a customers’ needs.
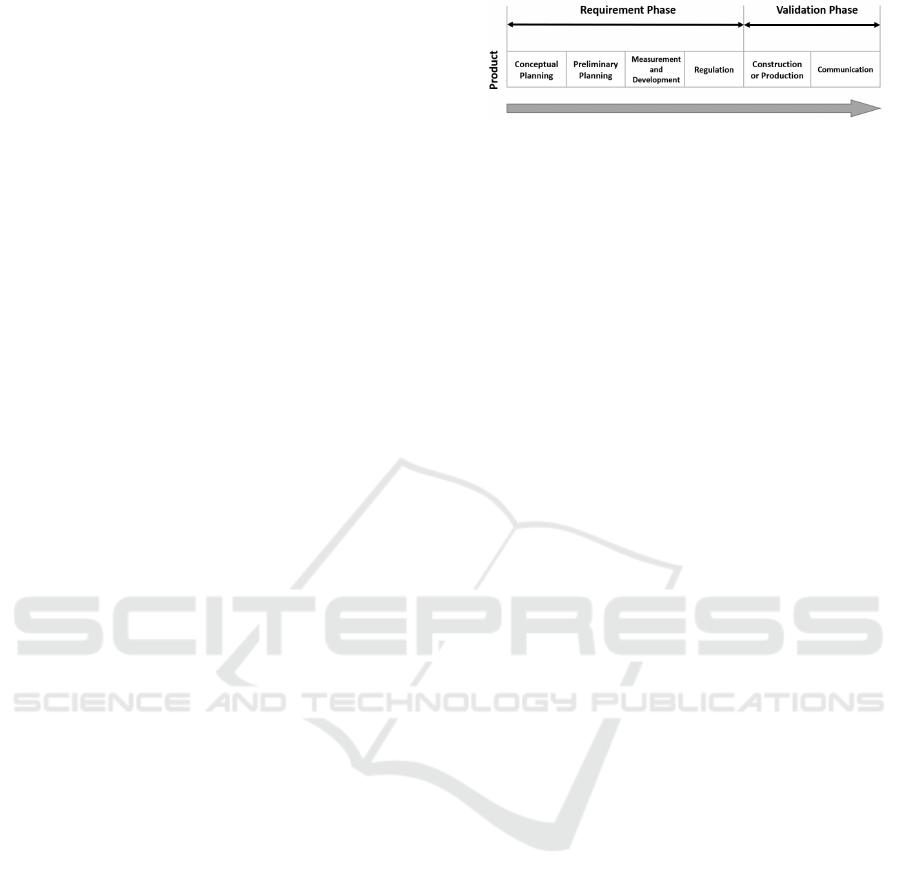
Figure 1: Sustainability of the Product Life Cycle.
The main goal for developing a new product is to
design a product or to alter the production industry to
meet the demands of the customers. The procedure
phase of the product life cycle is in the product of the
manufacturing industry (Silvius and Schipper, 2014).
In recent years, product life cycles have played an
essential role in life cycle assessments (LCA), which
are used to estimate the performance of different
products. An LCA examines six stages in a product’s
life cycle. These stages (conceptual planning,
preliminary planning, measurement and
development, regulation, construction or production,
and communication) are split into two phases: the
requirement phase, and the validation phase. The
difference between these two phases is that the first
focuses on the supply chain, and includes the
planning and measurement of a product, while the
second starts the life cycle of a product with the
construction in industry and includes the supply chain
activities as part of the validation phase.
In the requirement phase, measurement indicators
are used to give guidance to for initial planning and
regulation. In the validation phase, measurement
indicators are used for production and final
coordination.
2.2 Identifying Indicators That Can Be
used to Measure the Sustainability
Evaluation Criteria
Some researchers include three dimensions of
sustainability jointly in product selection.
Labuschagne and Brent (2005) specified three aims
of a sustainable product process structure, including
social equity, economic efficiency, and
environmental performance. They stated that
sustainability is a compound term, including social,
economic, and environmental aspects. The three
dimensions of sustainability for an enterprise are
people, income, and earth, each of which represents
the social, economic, and environmental aspects in
turn (Daneshpour, 2016). Each dimension includes
many different measurable indicators. Table 1, 2 and
3 list the three dimensions (economic, environmental
and social) of these measurable indicators.
ICORES 2021 - 10th International Conference on Operations Research and Enterprise Systems
242
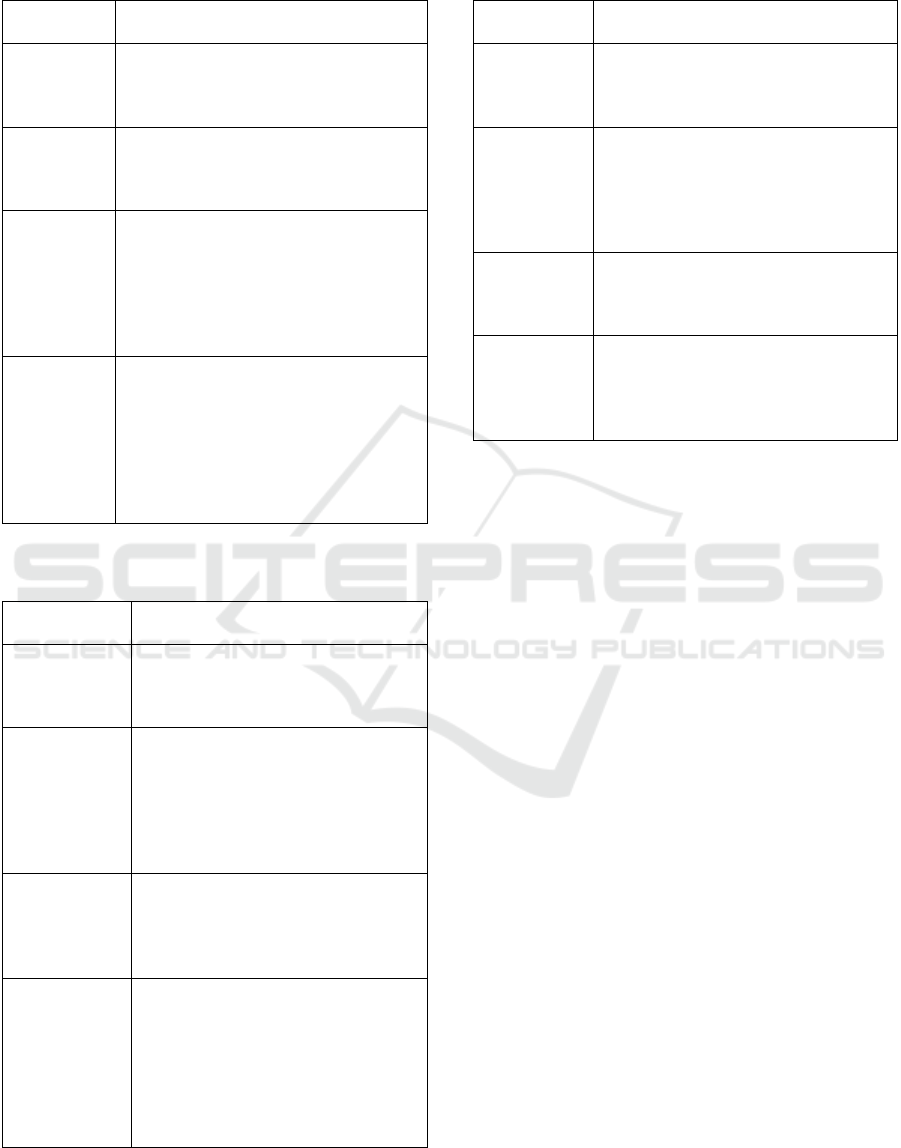
Table 1: Economic Indicators of Sustainability for Products
in the Manufacturing Industry.
Economic
Indicator
Description
Indicator A:
Level of
Stakeholder
involvement
Satisfying stakeholders’ needs and
interests by involving them in the
development of the project, leading to
the successful delivery of projects.
Indicator B:
Financial
performance
Financial performance: An objective
measure that concerns the return on
investments, and the creditworthiness,
viability, and cash flow of a project.
Indicator C:
Sustainable
pricing
Every business faces the challenge of
setting sustainable prices for its goods
or services. The price must be high
enough to cover costs and generate
profit, but must still be low enough to
attract customers in a competitive
market.
Indicator D:
Customer
satisfaction
Customer satisfaction is a key element
for sustainable economic development.
What customers care about is when
their order will be delivered. Customers
start to calculate the delivery date as
soon as the order is placed. The
delivery time does not just include the
production time.
Table 2: Environmental Indicators of Sustainability for
Products in the Manufacturing Industry.
Environmental
Indicator
Description
Indicator E:
Waste and
measurement
To reduce waste and save resources,
it is necessary to understand the
characteristics of the material being
used and the processing technology.
Indicator F:
Reducing
energy
consumption
Sustainable processing can minimize
the energy consumption per cubic
millimeter or cubic inch of material.
Minimizing energy consumption will
reduce energy waste and make the
processing process more
environmentally friendly.
Indicator G:
Level of
environmental
responsibility
This indicator refers to the equity
between members of different
generations, and to their ability to
cooperate to improve the quality of
the environment.
Indicator H:
Correlation of
the life cycle
of products
and services to
reduce
environmental
impacts
This indicator is measured through a
lifecycle analysis, a product
disassembly analysis, post-sale
tracking, and reverse logistics.
Table 3: Social Indicators of Sustainability for Products in
the Manufacturing Industry.
Social
Indicator
Description
Indicator I:
Social
responsibility
level
It refers to competition and pricing
policies, compliance with
anticorruption practices and
contribution to social campaigns.
Indicator J:
Sustainable
levels of
employment
This indicator concerns the
empowering of young people through
the provision of better job
opportunities, the creation of
environmentally friendly jobs, and the
conditions needed to create them.
Indicator K:
Level of
Social
impact
This indicator is measured through an
analysis of the statistics showing
society’s views of a specific project.
Indicator L:
Public
acceptance
towards a
product
This indicator refers to the willingness
of society to embrace a product or
service.
The economic dimension focuses on increasing
profits, minimizing expenditure, and increasing
income (Huntzinger and Thomas, 2009). The main
goal of a project is to make profit for the shareholders.
Brones and Carvalho (2015) stated the importance of
the economic dimension, as it protects the assets of
the shareholders. As a result of the shift from a
commodity exchange system to a currency-based
economy, organizations and individuals need money
to obtain the resources they need. Expenditure in
investment in an enterprise ensures growth in the
manufacturing industry invested into the enterprise to
make sure that the manufacturing industry arrive
growth. The economic aspect of sustainability is
commonly used in product selection. Profitability is
more important than returns or expenditure, although
there are many other indicators that can be used to
measure this aspect.
Environmental sustainability is primarily
concerned with the protection of the environment
(Gore, 2006; Higgins, 2010). The environment has
been adversely affected by the processes that have
been developed by people (Gore, 2006; Higgins,
2010; Ludwig et al., 1993). Environmental protection
needs to be included as part of product selection.
Researches initiate to connect environmental
assessment into product, such as manufacturing
industry (Labuschagne and Brent, 2005). In most
cases, environmental demonstration is integrated as a
condition to approve decision-making in the product.
The social dimension involves the ownership in
which enterprise manipulate as well as the workers of
Measuring Sustainability Performance in the Product Level
243
the enterprise (Dempsey et al., 2011). The workers
are the people who produce the consequences of the
industry and should be valued by the shareholders.
The products of the enterprise are also reliable on how
the society influence the enterprise (Harik et al.,
2015). However, social sustainability deserves much
more attraction, as it focuses on daily life and has an
important effect on society. There are four indicators
that can be used to measure social sustainability:
social responsibility, sustainable employment, social
impact, and public acceptance of the product.
3 BUILDING A
SUSTAINABILITY
EVALUATION MODEL BASED
ON DESIGN STRUCTURE
MATRIX
3.1 A Structured Approach to Identify
and Validate Selective Products
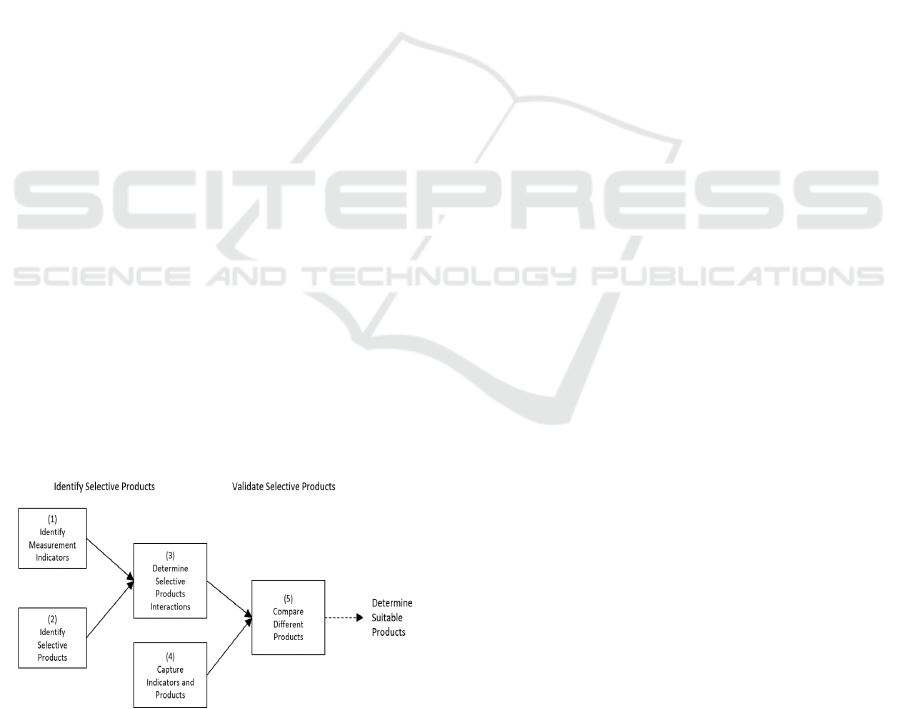
In order to rank the sustainability of different
products in the manufacturing industry, this paper
introduces a five-step approach to identify and
validate selective products, split into two phases (see
Figure. 2). The first phase (steps 1, 2, and 3) focuses
on identifying selective products based on the
measurable indicators, and then examines the
sustainability of the selected products (Ghadimi et al.,
2012). The second phase (steps 4 and 5) focuses on
validating the products identified during the first
phase by comparing them in order to determine the
most sustainable products. The introduction of the
product DSM (P) in step 2 is fundamental to this
approach, as it allows data on the measurable
indicators to be captured.
Figure 2: A Structured Approach to Identify and Validate
Selective Products.
The basic assumption behind this the first phase
of the approach is that selective products between
measurable indicators generate coordination
requirements. The first phase focuses on identifying
the set of interactions that could, potentially, take
place to coordinate the selective products that are
being measured.
In order to determine the most sustainable
product, it is necessary to identify the sustainability
of each of the selected products. This type of product
network is identified by asking the product
developers (m) about their level of involvement in the
design of each of the product components (n). This
information is documented in the product DSM (P).
is a rectangular matrix, in which the rows are
labeled with the selected product and the columns
are labeled with the measurable indicator. Cell
indicates the degree of involvement of product i in the
design of indicator j. The rows are ordered based on
the formal organisational structure, with the
individual developers split into groups so that group
members are sequenced together.
The selected product matrix (
) can be
defined as a function of the product DSM (P) as
follows:
(1)
The product DSM () can be used in a similar way
to determine the number of measurable indicators to
whose determine products contribute. In such a case,
the rows within the product DSM should be
compared, so that
1 if both products i
and j meet the measurable indicators. In this manner,
the selected product interaction matrix (
) can
be defined as follows:
(2)
To determine the sustainability of products i and j,
the entries of both the measurable indicator Domain
Mapping Matrix (DMM) (M) and the product DSM (P)
need to be examined. More specifically, product i
would look for sustainability from product j (
0)
if indicator K influencing product i (
0) depends
on indicator L (
0) which is influencing product j
(
0). Therefore, (
0) if (
0), (
0),
and (
0). Moreover, if M and P are binary
matrices, then the number of times that products i and
j need to coordinate measurable indicators interfaces
between products to which they contribute needs to be
measured. In other words, the number of times that
=
=
= 1 needs to be counted for products i and
j. This can be determined using the following equation:
(3)
ICORES 2021 - 10th International Conference on Operations Research and Enterprise Systems
244
Once this has been done, the validate product
matrix (
) can be formally defined, allowing
it to record the relationship between the selective
products with sustainability. This matrix is a function
of both the product DSM (P) and the measurable
indicator DMM (M). The validated product matrix
can be generated using the following equation:
(4)
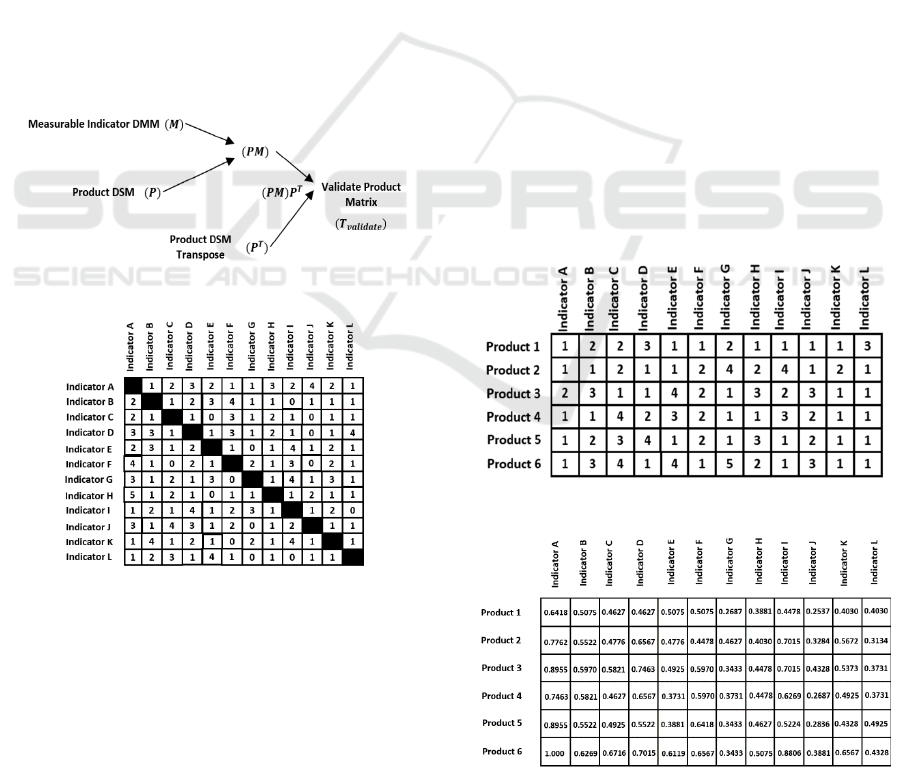
3.2 Determine the Sustainability
Evaluation Model
To illustrate the rationale behind Equation (4), Figure
3 shows the measurable indicator DMM (M) for the
12 indicators that can be used to compare the similar
products in the manufacturing industry which were
identified by the product DSM (P). The product PM
produces a rectangular matrix in which non-zero cells
capture the number of products with which product I
is involved, imposing sustainability constraints on
product j. The
can be estimated in the end
for further analysis.
Figure 3: Sustainability Evaluation Model.
Figure 4: Measurable Indicator DMM (M).
The measurable indicator DMM (M) was scored
by the Delphi method, also known as the expert
investigation method. It is essentially a feedback
anonymous inquiry method. The general process is to
obtain expert opinions on the problem to be predicted.
Figure 4 shows the impact of sustainability of
measurable indicators on the same type products in
the manufacturing industry and the comparison
within different measurable indicators of three
different dimensions.
4 AN ILLUSTRATIVE EXAMPLE
A certain company mainly produced computer
software and hardware, and entered the smartphone
industry later. It implemented technology with strong
innovation capabilities.
In this paper, this smart phone development
project is used as an example in order to analyze the
sustainability of mobile phones. The project
developed six mobile phone models, labelled Product
1 to Product 6, respectively, in order to compare the
mobile phones of sustainability could be put into
production, saving resources and offering the highest
number of benefits.
Each mobile phone was evaluated based on the
materials that were used for each part, the power
consumption, the impact they had on the
environment, their recyclability, and other aspects.
According to the sustainability evaluation model
constructed in the previous chapter, the expert scored
evaluation from 12 standards such as Indicator A. The
scoring matrix of the six selective products (product
DSM) (P) shown in Figure 5 was obtained through
interviews with the project manager and other experts
in the field of sustainability.
Figure 5: Product DSM (P).
Figure 6: PM Matrix.
Measuring Sustainability Performance in the Product Level
245
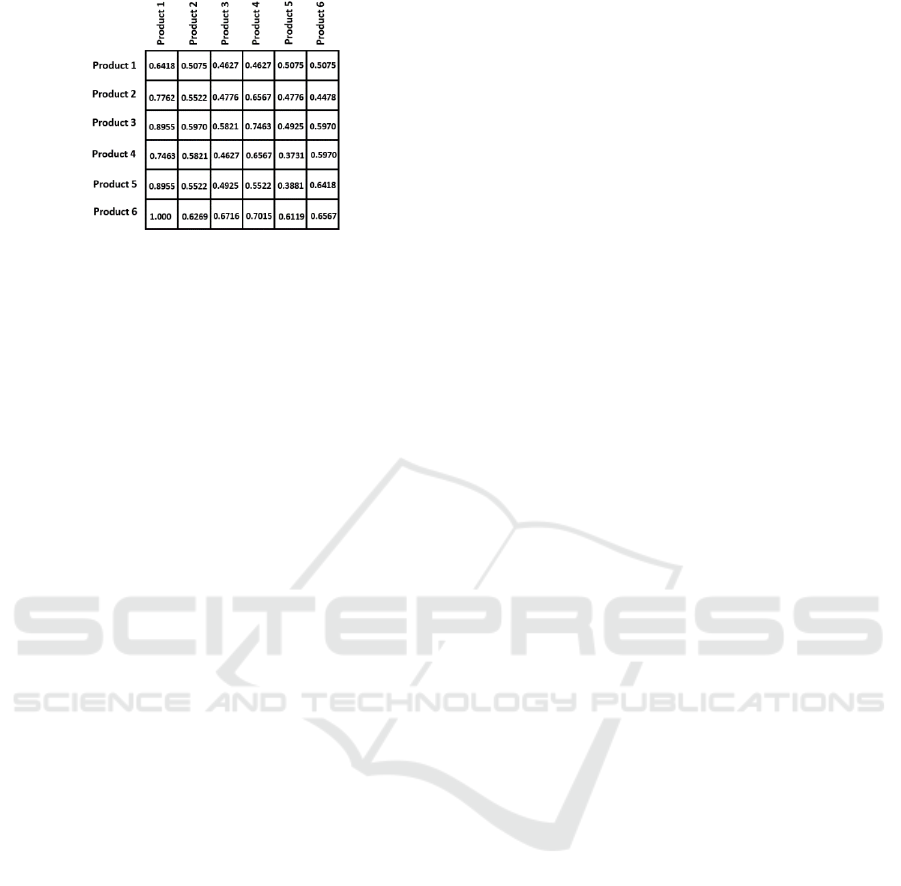
Figure 7: Validate Product Matrix (
.
Then results of PM and
ma tr ixe s wer e
shown in comparison (see Figure 6 and 7), both
matrixes were normalized matrixes. By analyzing and
comparing these two matrixes, the sustainability of
these six products can be examined. However,
different shareholders considered different
dimensions of the measurable indicators, so it is
difficult to directly determine which product to
choose.
5 CONCLUSIONS
In order to explore the sustainability of products,
three dimensions (economic, environmental, and
social) were used in this article, giving a total of 12
measurable indicators. All of the measurable
indicators were scored by experts for further
exploration. The knowledge domain of product
process structure is compounding sustainability
indicators into its approaches. This paper introduced
a five-step approach, which was split into two phases
(predicting and validating). After identifying a
number of products based on the measurable
indicators and determining the sustainability of the
selected products in the first phase, the second phase
(steps 4 and 5) concentrated on validating the selected
products by comparing the sustainability of the
similar products. In the first phase, the two matrices
(the product DSM (P) and the measurable indicator
DMM (M)) were introduced to capture the
measurable indicators. In the second phase, the
function of the validated product matrix was defined
in order to compare the level of sustainability of each
of the different products. Through this process, the
sustainable products were compared and even chosen
for different demand.
The application of this approach was shown with
the smartphone industry being used as an example.
This provided relevant insights about the challenges
associated with the development of new smartphones.
Through the measurement of product sustainability,
more environmentally friendly products will have
more advantages, and consumers will favour these
products more, thus counter-promoting the selection
of raw materials by merchants and manufacturers and
the recycling of subsequent products. The
measurement of products by multiple indicators also
reflects different requirements for product
sustainability. Different consumers can choose
products that are more suitable for them according to
their own requirements, which increases the
satisfaction experience for consumers.
6 LIMITATIONS AND
RECOMMDATIONS
In fact, there are different categories of sustainability
measurement indicators. This article only classifies
12 indicators into three categories. In the illustrative
example, only six types of mobile phones were
measured. Therefore, these measurement methods
may not be suitable for large quantities of goods such
as fast-moving goods.
Through the sustainable development of the
product, the product itself can achieve continuous
development in performance or function, and meet
the market demand of different performance, thereby
extending the service life, maximizing the recycling
use of the limited resources of the brothers, and
achieving the circular economy goal of utilization and
recycling. Through the transformation and upgrading
of modern industrial technology methods and
concepts, the application of multiple life cycles and
multiple performance modes of products can be
realized.
For future work, we will expand more categories to
consider the sustainability of products, and
understand consumer needs through statistics and
other methods. These measurement methods will also
be applied to more fields, such as clothing. We will
also optimize the model so that the measurement
indicators better reflect the sustainability of the
product.
ACKNOWLEDGEMENTS
This study was supported by the National Natural
Science Foundation of China (No. 71929101 and
71872011).
ICORES 2021 - 10th International Conference on Operations Research and Enterprise Systems
246

REFERENCES
Aarseth, W., Ahola, T., Aaltonen, K., Økland, A.,
Andersen, B., 2017. Project sustainability strategies: a
systematic literature review. International Journal of
Project Management (in press).
Alvarez-Dionisi, L. E., Turner, R., & Mittra, M., 2016.
Global project management trends. International
Journal of Information Technology Project
Management, 7(3), 54–73.
Brones, F., and Carvalho, M. M., 2015. From 50 to 1:
Integrating literature toward a systemic ecodesign
model. Journal of Cleaner Production, 96(1), 44-47.
Browning, T.R., 2001. Applying the design structure matrix
to systemdecomposition and integration problems: a
review and new directions. IEEE Transactions on
Engineering Management, 48(3):292–306.
Cataldo, M., Wagstrom, P., Herbsleb, J.D., Carley, K.M.,
2006. Identification of coordination requirements:
implications for the design of collaboration and
awareness tools. In Proceedings of ACM conference on
computer-supported cooperative work, Banff Canada,
353–362.
Daneshpour, H., 2016. The key drivers of sustainability. In
Proceedings of IEEE Conference. DOI: 978-1-5090-
2320-2/16.
Dempsey, N., Bramley, G., Power, S., Brown, C., 2011.
The social dimension of sustainable development:
Defining urban social sustainability. Sustainability
Development, 19 (5):289–300.
Eskerod, P., & Huemann, M., 2013. Sustainable
development and project stakeholder management:
what standards say. International Journal of Managing
Projects in Business, 6(1), 36–50.
Ghadimi, P., Azadnia, A. H., Yusof, N. M., & Saman, M.
Z. M., 2012. A weighted fuzzy approach for product
sustainability assessment: a case study in automotive
industry. Journal of Cleaner Production, 33, 10-21.
Gore, A., 2006. An inconvenient truth: The planetary
emergency of global warming and what we can do
about it, Rodale, New York.
Harik, R., El Hachem, W., Medini, K., & Bernard, A., 2015.
Towards a holistic sustainability index for measuring
sustainability of manufacturing companies.
International Journal of Production Research, 53(13),
4117−4139.
Higgins, P., 2010. Eradicating ecocide: laws and
governance to prevent the destruction of our planet,
Shepheard Walwyn Publishers Ltd., London.
Huntzinger, D. N. and Thomas, D. E., 2009. A life-cycle
assessment of Portland cement manufacturing:
comparing the traditional process with alternative
technologies. Journal of Cleaner Production, 17(7),
668-675.
Klakegg, O.J., 2009. Pursuing relevance and sustainability:
improvement strategies for major public projects.
International Journal of Managing Projects in
Business, 2:499–518.
Labuschagne, C., Brent, A.C., 2005. Sustainable project life
cycle management: the need to integrate life cycles in
the manufacturing sector. International Journal of
Project Management, 23:159–168.
Ma, J., and Kremer, G., 2016. A sustainable modular
product design approach with key components and
uncertain end-of-life strategy consideration.
International Journal of Advanced Manufacturing
Technology, 85(1), 741-763.
Okudan Kremer, G.E., Ma, J., Chiu, M-C., and Lin, T-K.,
2013. Product modularity and implications for the
reverse supply chain. Supply Chain Forum: An
International Journal. 14(2), 54-69.
Pimmler, T.U., Eppinger, S.D., 1994. Integration analysis
of product decompositions. In ASME conference on
design theory and methodology, Minneapolis, 343–351.
Silvius, A.J.G., Schipper, R.P.J., 2014. Sustainability in
project management: a literature review and impact
analysis. Society Business, 4:63–96.
Sosa, M.E., Eppinger, S.D., Rowles, C.M., 2004. The
misalignment of product architecture and
organizational structure in complex product
development. Management Science, 50(12):1674–
1689.
Steward, D., 1981. The design structure matrix: a method
for managing the design of complex systems. IEEE
Transactions on Engineering Management, 28(3):71–
74.
Measuring Sustainability Performance in the Product Level
247
