
Characteristics of Minimum Variance Beamformer for Frequency and
Plane-wave Compounding
Ryoya Kozai
1
, Norio Tagawa
1 a
, Masasumi Yoshizawa
2
and Takasuke Irie
1,3
1
Electrical Engineering and Computer Science, Tokyo Metropolitan University, Hino-shi, Tokyo, Japan
2
Tokyo Metropolitan College of Industrial Technology, Arakawa-ku, Tokyo, Japan
3
Microsonic Co. Ltd., Kokubunji-shi, Tokyo, Japan
Keywords:
Ultrasonic Imaging, Minimum Variance Beamforming, Frequency Compounding, High Resolution.
Abstract:
Recently, coherent plane-wave compounding (CPWC) that achieves high spatiotemporal resolution has been
studied actively as a spatial compounding beamformer. Further, various frequency compounding methods have
been proposed for reducing speckle noise. We already proposed the method called frequency and plane-wave
compounding minimum variance distortionless response (FPWC-MVDR), which achieves high spatial reso-
lution imaging by simultaneously optimizing frequency and spatial compounding based on minimum variance
scheme. In the algorithm of this method, the data-compounded-on-receive MVDR (DCR-MVDR) principle
developed for CPWC is extended and applied. In this study, we analyze the features and characteristics of
FPWC-MVDR and the weaknesses to be solved in the future through experiments.
1 INTRODUCTION
In order to realize high-resolution ultrasound imag-
ing, it is necessary to increase the amplitude of the tar-
get signals and reduce the noise level. Beamforming
is the standard method to realize it. Recent work on
ultrasound beamforming has made particular progress
in improving lateral resolution. Receive beamform-
ing is the basis of array signal processing using an
array transducer composed of multiple transducer el-
ements, and is a technology that generates spatial res-
olution by forming the beam directivity. The most
basic beamforming method is Delay-and-Sum (DAS)
(Thomenius, 1996). In this method, the delays of the
received signals of each element are aligned before
they are added. However, this technique is strongly
limited by the beamwidth, which is determined by the
aperture width of the transducer array.
Various beamformings have been proposed to
form narrower beams (Camacho et al., 2009), (Li
and Li, 2003), (Matrone et al., 2015). Among
them, much study has been done on minimum dis-
persion distortion-free response (MVDR) beamform-
ing (Capon, 1969), (Vignom and Burcher, 2008), (Asl
and Mahloojifar, 2012). MVDR is a method to min-
imize the noise power by minimizing the variance of
a
https://orcid.org/0000-0003-0212-9265
beamforming while guaranteeing the all-pass charac-
teristics of the target signal. The variance can be
minimized by adaptively calculating the weights for
adding the received echoes using the data variance-
covariance matrix. As a result, the signal level other
than the target is reduced, and the improvement in lat-
eral resolution and signal-to-noise ratio (SNR) can be
expected. In a conventional system, the true variance-
covariance matrix cannot be known, and it is esti-
mated from the received echo. Therefore, various es-
timation methods have been proposed as approximate
calculations. The most popular of these is subarray
averaging (Synnevag et al., 2007). In this method,
the sensor array is first divided into subarrays, and for
each, the tensor product of the vectors whose com-
ponents are the echoes of each subarray element is
calculated. Then, a variance-covariance matrix is es-
timated by averaging them. However, to prevent the
variance-covariance matrix from becoming singular,
the subarray length must be less than half its origi-
nal length. This will significantly reduce the image
resolution. In addition, these processes have the dis-
advantage that real-time imaging is difficult due to the
high computational cost.
Nguyen et al. proposed the Data-Compounded-
on-Receive (DCR-MVDR) beamforming (Nguyen
and Prager, 2018) to solve these problems. This is
a method that efficiently applies MVDR to Coherent
Kozai, R., Tagawa, N., Yoshizawa, M. and Irie, T.
Characteristics of Minimum Variance Beamformer for Frequency and Plane-wave Compounding.
DOI: 10.5220/0010300404230430
In Proceedings of the 16th International Joint Conference on Computer Vision, Imaging and Computer Graphics Theory and Applications (VISIGRAPP 2021) - Volume 4: VISAPP, pages
423-430
ISBN: 978-989-758-488-6
Copyright
c
2021 by SCITEPRESS – Science and Technology Publications, Lda. All rights reserved
423

Plane-Wave Compounding (CPWC) (Montaldo et al.,
2009) and achieves both temporal resolution and spa-
tial resolution. CPWC is a method that can trans-
mit and receive plane waves while changing the an-
gle and perform receive beamforming to obtain the
same image resolution as conventional focus beam
transmission in a short time. IDCR-MVDR requires
a variance-covariance matrix of echoes for changes
in plane wave transmit angle, which does not require
subarray averaging and is calculated using a snapshot
from the echo vectors received by the array. There-
fore, processing can be performed without reducing
the matrix size.
On the other hand, a technique called frequency
compounding has also been studied as an approach
to improve image quality (Magnin et al., 1982),
(Mesurolle et al., 2006), (Cui and Liu, 2011), which is
a method of transmitting and receiving different fre-
quencies in the same path and averaging them to en-
hance the target signal and reduce artifact echo. This
takes advantage of the different interference patterns
depending on the frequency. This method is mainly
used for speckle reduction.
We have proposed the frequency and plane-wave
compounding minimum variance distortionless re-
sponse (FPWC-MVDR), which can realize high spa-
tial resolution imaging by optimizing compounding
of the frequency and plane waves simultaneously
(Kozai et al., 2020). DCR-MVDR principle devel-
oped for CPWC is extended and applied to the al-
gorithm of this method. The novelty of our ap-
proach is to optimize frequency compounding as well.
Traditional frequency compounding uses a constant
weighted average. However, this does not effectively
use frequency information for ultrasound imaging.
There may be appropriate averaging weights for each
frequency, depending on the pixel position to be im-
aged. FPWC-MVDR has adopted an approach that
optimizes frequency compounding by adaptively cal-
culating the averaging weights. In this paper, we show
various characteristics of FPWC-MVDR investigated
through experiments. In particular, the trend of fre-
quency weights offers interesting implications for fu-
ture work.
2 METHOD
2.1 Minimum Variance Distortionless
Response
In this paper, all observations are treated as analytic
signals obtained by quadrature detection of RF sig-
nals, that is, IQ (In-phase and Quadrature-phase) sig-
nals. First, we explain MVDR using conventional
sub-array averaging. Beamformer output is generally
expressed by the following exuation.
y(t) = w
H
x, (1)
where w is a weight vector,
H
is Hermitian transpo-
sition, and x is a received echo vector composed of
echoes acquired by all the elements, and has a time
delay corresponding to the imaging position and as-
sociated phase correction. The number of elements is
set to N. MVDR adaptively finds the weight vector
w by solving the following constrained optimization
problem (Mehdizadeh et al., 2012).
Minimize w
H
Rw, subjectto w
H
1
N
= 1, (2)
where R is the N × N variance-covariance matrix. w
can be obtained by solving this minimization problem
and the solution is obtained as follows:
ˆw =
R
−1
1
N
1
>
N
R
−1
1
N
. (3)
In the subarray averaging process, an estimate of R
is found by partitioning x into N − L + 1 subarrays of
length L. The estimated value
ˆ
R is as follows:
ˆ
R =
1
N − L + 1
N−L+1
∑
l=1
x
l
x
H
l
, (4)
where x
l
≡ [x
l
,x
l+1
,·· · ,x
l+L−1
]
>
. By this subarray
processing, the matrix size becomes L × L, hence the
size of w is also L. Therefore, the averaged echo for
each subarray ¯x
l
is defined by the following equation.
¯x
l
=
1
L
l+L−1
∑
m=l
x
m
. (5)
By using the weights of Eq. 3, the out put of MVDR
for each pixel ˆy is as follows:
ˆy =
N−L+1
∑
l=1
ˆw
l
¯x
l
. (6)
2.2 Coherent Plane-wave Compounding
In CPWC processing, plane waves are transmitted and
received multiple times at different angles. When
transmitting M times at different angles and receiv-
ing with N elements, the following two-dimensional
array can be generated by performing time delay and
phase correction according to pixel position.
X =
x
1,1
x
1,2
··· x
1,N
x
2,1
x
2,2
··· x
2,N
.
.
.
.
.
.
.
.
.
.
.
.
x
M,1
x
M,2
··· x
M,N
, (7)
VISAPP 2021 - 16th International Conference on Computer Vision Theory and Applications
424
where x
i, j
is the echo received by element j for the
pulse transmitted at the angle i. Details of the de-
lay calculation are given in (Montaldo et al., 2009).
The following CPWC output is obtained by averag-
ing these matrix elements.
ˆy
CPWC
=
1
MN
M
∑
i=1
N
∑
j=1
x
i, j
. (8)
2.3 Data-Coumpounded-on-Receive
MVDR
The DCR-MVDR uses the array information and an-
gle information of Eq. 7 because it transmits and
receives while changing the angle like CPWC. The
DCR-MVDR creates a snapshot from the array infor-
mation and adaptively determines the angle weights
without using the sub-array averaging in MVDR. The
snapshot is calculated as follows:
s
k,i
=
1
N − 1
N
∑
j=1, j6=k
x
i, j
. (9)
The variance-covariant matrix is defined using the
snapshot of Eq. 9.
ˆ
R
DCR
=
1
N
N
∑
k=1
s
k
s
H
k
+ εI, (10)
where ε is the diagonal loading parameter and I is an
identity matrix. Adjusting ε increases the diagonal
and makes the variance-covariance matrix more ro-
bust. ε is set relative to ∆ = Tr(
ˆ
R)/L, where L is the
rank of
ˆ
R indicating the first term in the right hand
side of Eq. 10. The signal to which the weights are
applied is the vector u ≡ [u
1
,u
2
,·· · ,u
M
]
>
, which is
obtained by adding the matrix components of Eq. 7 in
the array direction. Namely, each element u
i
is com-
puted as follows:
u
i
=
N
∑
j=1
x
i, j
, for i = 1, 2,·· · ,M. (11)
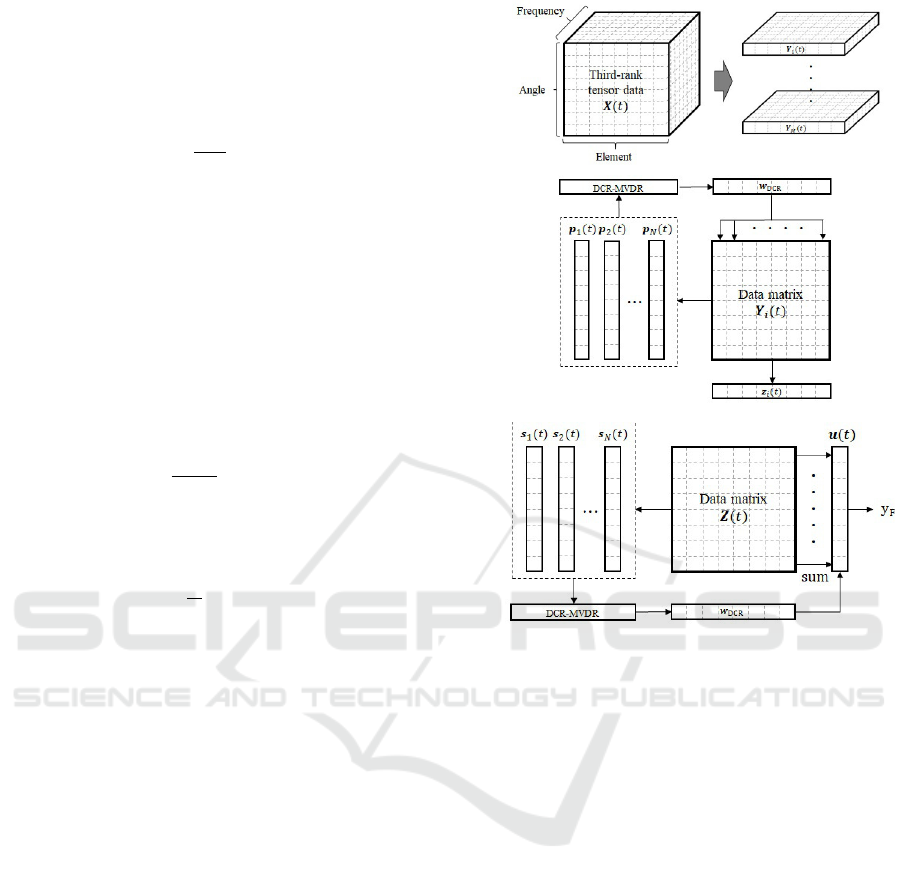
2.4 Frequency and Plane-wave
Compounding-MVDR
When M times are transmitted at different angles and
different frequencies are transmitted L times for each
angle, and N elements are used, the third-order tensor
data X can be generated (Fig. 1(a)). First, as shown in
Fig. 1(a), the matrix Y for each angle is extracted and
used as frequency and array information. Then, fre-
quency weights are calculated by DCR-MVDR pro-
cessing, and the weights are multiplied in the fre-
quency direction to compress the frequency informa-
tion (Fig. 1(b)). Where p
i
(i = 1,2, ··· ,N) represents a
(a)
(b)
(c)
Figure 1: FPWC-MVDR processing overview: (a) partion
third-order tensor data; (b) frequency compression; (c) an-
gular weights calculation and FPWC-MVDR output.
snapshot for each transmission angle defined as Eq. 9.
The matrix Z ≡ [z
1
,z
2
,·· · ,z
M
], where z
i
is generated
as in Fig. 1(b), is formed by performing the above pro-
cessing at all angles. Finally, by performing the same
processing as DCR-MVDR on this matrix, it becomes
the output of FPWC-MVDR (Fig. 1(c)).
3 EXPERIMENTS
3.1 Experiment Condition
In the experiments, the transmission and reception se-
quences were generated using an experimental plat-
form for medical ultrasound (RSYS0003, Microsonic
Inc., Japan) with a sampling rate of 31.25 MHz. The
number of transducer elements used for both trans-
mission and reception is 64, while the element pitch is
0.315 mm. Transmitted waves are restricted to 7-level
quantization. A linear array probe (T0-1599, Nihon
Dempa Kogyo Co., Ltd., Japan) was also used. The
center frequency of this probe is 7.5 MHz and its spe-
Characteristics of Minimum Variance Beamformer for Frequency and Plane-wave Compounding
425
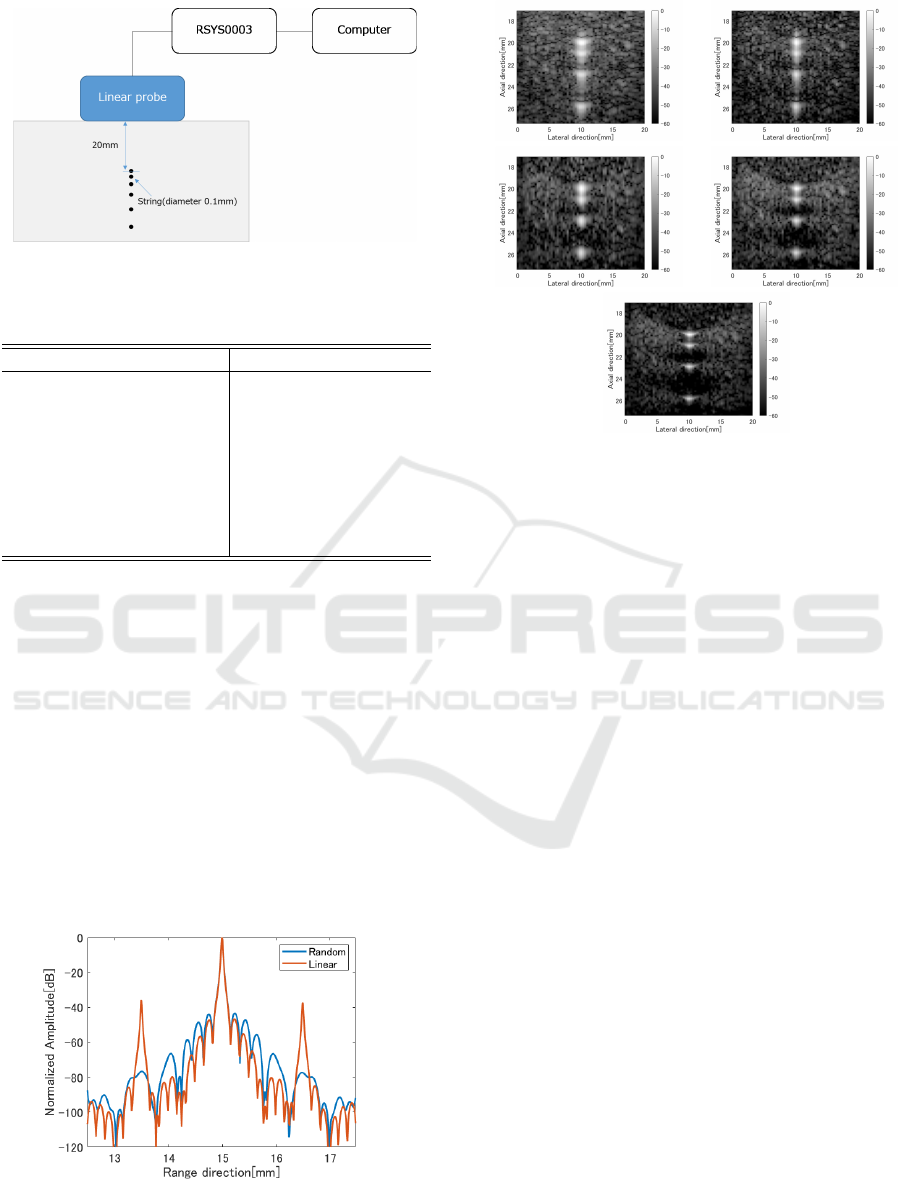
Figure 2: Experimental setting for soft tissue-mimicking
phantom.
Table 1: Experimental parameters.
Parameter Value
Transmission wave FM-chirp pulse
Frequency band width 2 MHz
Chirp pulse duration 8 µs
Transmission center freq. Randomly determined
at 4 − 8 MHz
Transmission voltage 60 V
Apodization Hanning window
Measurement tenparature 24
◦
C
cific bandwidth is 70 %. The signal processing was
performed offline using MATLAB software.
Figure 2 shows the experimental setting. We
present the experimental results obtained using a
soft tissue-mimicking phantom (US-2 multi-purpose
phantom N-365; Kyoto Kagaku Co., Ltd., Japan),
with a speed of sound of 1,432 m/s (25
◦
C) and at-
tenuation of 0.59 dB/cm/MHz. As shown in Fig. 2,
the phantom contains six string wires with a diame-
ter of 0.1 mm. The distances between these wires are
1.0 mm, 2.0 mm, 3.0 mm, 4.0 mm and 5.0 mm, mea-
sured from the side closest to the phantom.
Table 1 shows the experimental setting. As for
transmission, plane FM-chirp waves were transmit-
ted 33 times while changing the angle in 0.5 deg.
Figure 3: Comparison of intensity distribution profiles in
the axial direction by regular and random changes of trans-
mission frequency band.
(a) (b)
(c) (d)
(e)
Figure 4: B-mode images when targeting string : (a)
CPWC; (b) DCR-MVDR; (c) FC-DCR-MVDR; (d) FPWC-
MVDR; (e) Normalized FPWC-MVDR.
steps from −8.0 deg. to +8.0 deg.. In addition, we
changed the frequency at each angle and transmit-
ted 8 times. 64 elements were used for transmis-
sion and reception. First, it was necessary to consider
whether to change the transmission frequency band,
that is, the center frequency of the transmission wave,
at regular intervals or randomly. Therefore, the finite
element method (FEM) simulation under almost the
same transmission/reception conditions as the exper-
iment was performed using the engineering simula-
tion software OnScale. The object to be imaged is a
thin metal wire. Figure 3 shows an example of the in-
tensity distribution profile obtained by FPWC-MVDR
using both frequency change methods. From this,
it can be seen that periodic changes cause artifacts
due to coherence between different frequencies. In
the following, a random frequency change is adopted.
In order to evaluate the performance of the frequency
compounding, we also transmitted once at each angle
using the total band of frequencies used. Due to the
experimental system’s limitations, the pulse width is
limited and is strongly affected by frequency depen-
dent attenuation (FDA), so a relatively low frequency
is used.
3.2 Performance Evaluation
We first evaluate the beamformer performance. Fig-
ure 4 is a comparison of B-mode images. Figure 4(a)
and (b) are B-mode images of CPWC and DCR-
MVDR when the total frequency band is used. Fre-
quency Compound-DCR-MVDR (FC-DCR-MVDR)
VISAPP 2021 - 16th International Conference on Computer Vision Theory and Applications
426
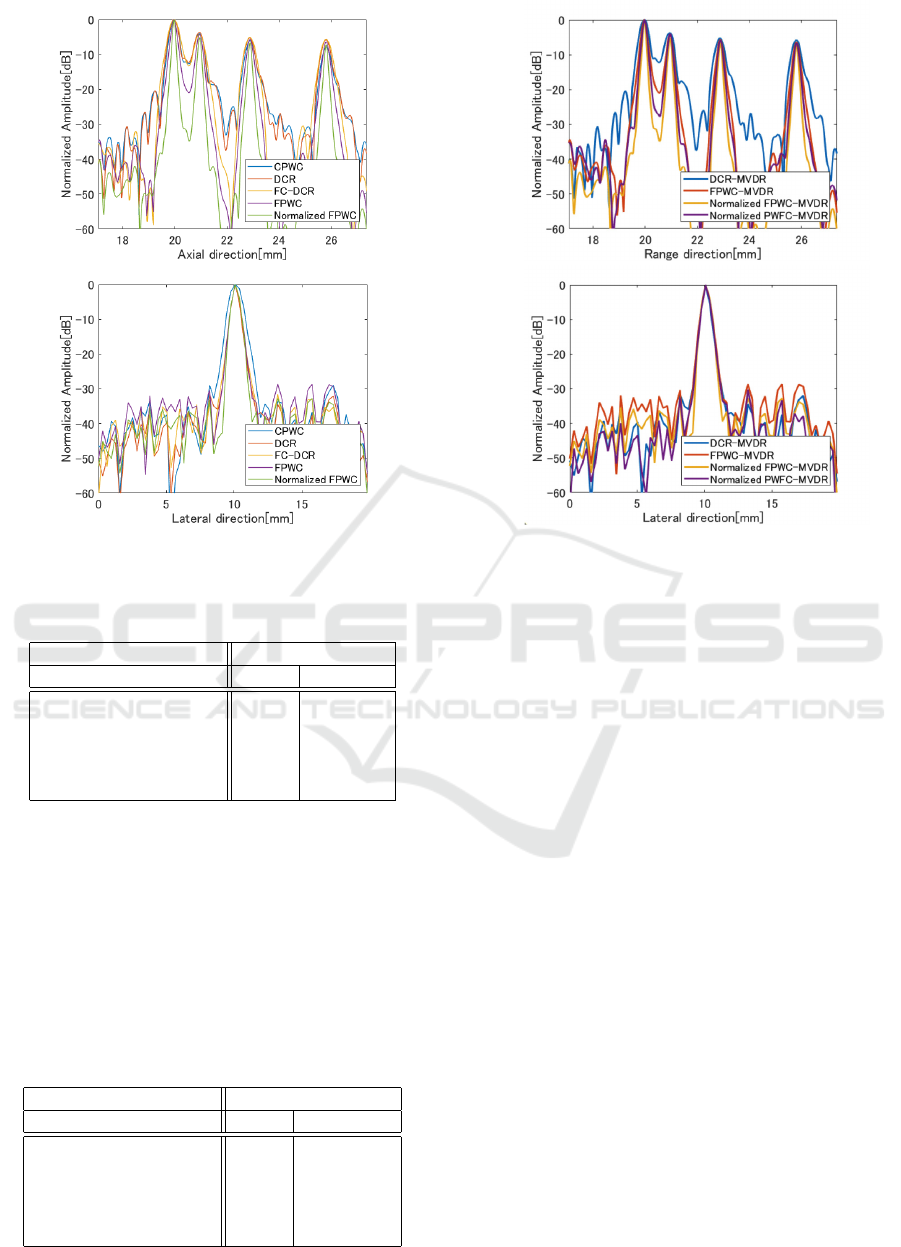
(a)
(b)
Figure 5: Intensity distribution profiles: (a) on the axial
in the center of the B-mode image; (b) on the lateral line
through the foremost target.
Table 2: Axial resolution at the foremost target.
Axial width [mm]
Method -6 dB -10 dB
CPWC 0.44 0.57
DCR-MVDR 0.44 0.60
FC-DCR-MVDR 0.55 0.73
FPWC-MVDR 0.37 0.53
Norm. FPWC-MVDR 0.23 0.23
in Fig. 4(c) is a method in which DCR-MVDR is
combined with a frequency compounding at constant
weights, and the frequency compounding is not op-
timized. Figure 4(d) is a result of the proposed
method, FPWC-MVDR. Figure 4(e) is a B-mode im-
age that has been FPWC-MVDR processed after the
frequency dependent attenuation (FDA) compensa-
tion (Normalized FPWC-MVDR), considering that
frequency information is not used effectively due to
the FDA.
Table 3: Lateral resolution at the foremost target.
Lateral width [mm]
Method -6 dB -10 dB
CPWC 0.95 1.58
DCR-MVDR 0.63 0.95
FC-DCR-MVDR 0.63 0.95
FPWC-MVDR 0.63 0.95
Norm. FPWC-MVDR 0.63 0.95
(a)
(b)
Figure 6: Intensity distribution profiles when frequency
compounding is performed after plane wave compounding:
(a) on the axial in the center of the B-mode image; (b) on
the lateral line through the foremost target.
To check the performance in more detail, Fig. 5
shows the intensity distribution profile across the
string at the foremost position. In addition, Tables 2
and 3 show the axis and lateral resolution at the fore-
most target. In DCR-MVDR and FC-DCR-MVDR,
we set ε = ∆. In FPWC-MVDR and Normalized
FPWC-MVDR, we set ε = ∆ for frequency weight
calculation and ε = 2∆ for angle weight calculation.
These results show that frequency compounding re-
duces axial side lobes. In addition, it can be con-
firmed that FPWC-MVDR, which adaptively obtains
the weights of the frequency compounding, can re-
alize high axial resolution. we can also confirm that
compensating the FDA improves its performance.
3.3 Other Characteristics
First, the processing order of the frequency com-
pounding and the plane wave compounding was ex-
changed, and the effect was evaluated. Figure 6 shows
the results of comparing the intensity profiles. In this
figure, the method of conducting the plane wave com-
pounding first is referred to as PFWC-MVDR. The
results show that the PFWC-MVDR has a slightly
lower axial resolution than the FPWC-MVDR, while
slightly improving the lateral sidelobe level. How-
ever, since the number of transmissions with the fre-
Characteristics of Minimum Variance Beamformer for Frequency and Plane-wave Compounding
427
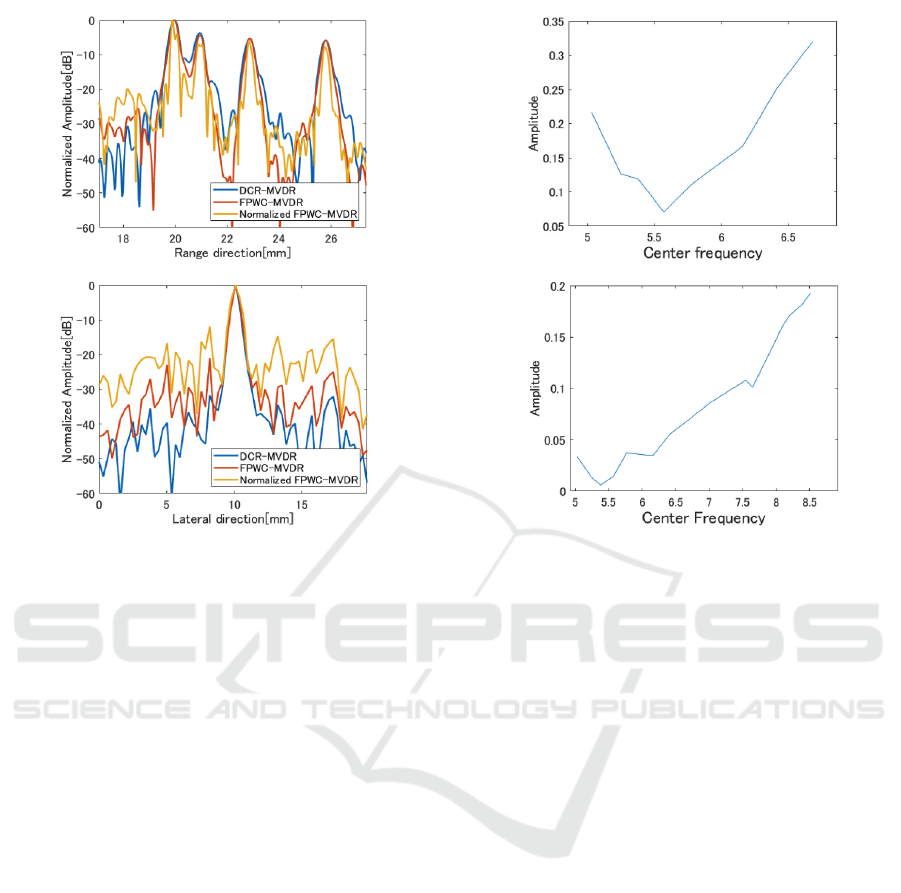
(a)
(b)
Figure 7: Intensity distribution profiles when using the en-
tire frequency band (4-10 MHz): (a) on the axial in the cen-
ter of the B-mode image; (b) on the lateral line through the
foremost target.
quency changed is 8 less than the number of transmis-
sions with the azimuth direction changed with 33, it
is necessary to confirm the effect in the future.
Subsequently, DCR-MVDR, FPWC-MVDR, and
Normalized FPWC-MVDR were executed using the
entire effective band of 4− 10 MHz of the used probe.
The results are shown in Fig. 7. Since the frequency
components of the received echo are approximately
7 MHz or less, the performance is degraded com-
pared to the case where the 4 − 8 MHz band is used
(Fig. 5). Normalized FPWC-MVDR compensates
for the FDA attenuation by the normalization pro-
cess, but the sidelobe increases especially in the lat-
eral direction. Therefore, the frequency weights at the
foremost target position were investigated. Compar-
ing the weights of both determined by Normalized
FPWC-MVDR shown in Fig. 8, it can be seen that
the high frequency band is heavily used in the case of
4 − 10 MHz. Since the high frequency band is gen-
erally used heavily, there is a possibility that the low
SNR in the high frequency band may have an adverse
effect.
What is interesting about the result of these
weights are that the tendency of the magnitude of the
weights with respect to the frequency are V-shaped,
that is, the weights are inversely proportional to the
frequency in the low frequency band. An interesting
(a)
(b)
Figure 8: Absolute value of weights used for frequency
compounding: (a) when using the 4 − 8 MHz band, (b)
when using the 4 − 10 MHz band.
result is that lower frequencies are used more heav-
ily than frequencies near the center. Therefore, the
frequency weighting (amplitude and phase) by Nor-
malized FPWC-MVDR was evaluated by FEM simu-
lation using OnScale. Figure 9 shows the characteris-
tics obtained around the target at a position of 15 mm
in the axial direction and 2.24 mm in the lateral direc-
tion. From these, it can be seen that the closer to the
target, the sharper the V-shape with the larger weight.
It can also be confirmed that the phase of the weight is
inverted with respect to the center of the entire band,
but the relationship of this characteristic with the tar-
get position is not so clear.
4 CONCLUSIONS
In this study, we evaluated the performance and
characteristics of the receive beamforming method
FPWC-MVDR that we recently proposed by opti-
mally integration of frequency and spatial compound-
ing. Previously, we were studying methods for detect-
ing the positions of a small number of reflectors with
high resolution (Tagawa and Zhu, 2018), (Zhu and
Tagawa, 2019a), (Zhu and Tagawa, 2019b), (Nguyen
et al., 2020), and they were suitable for anomaly de-
tection such as tumor imaging. On the other hand,
the technical feature of these methods was to realize
VISAPP 2021 - 16th International Conference on Computer Vision Theory and Applications
428
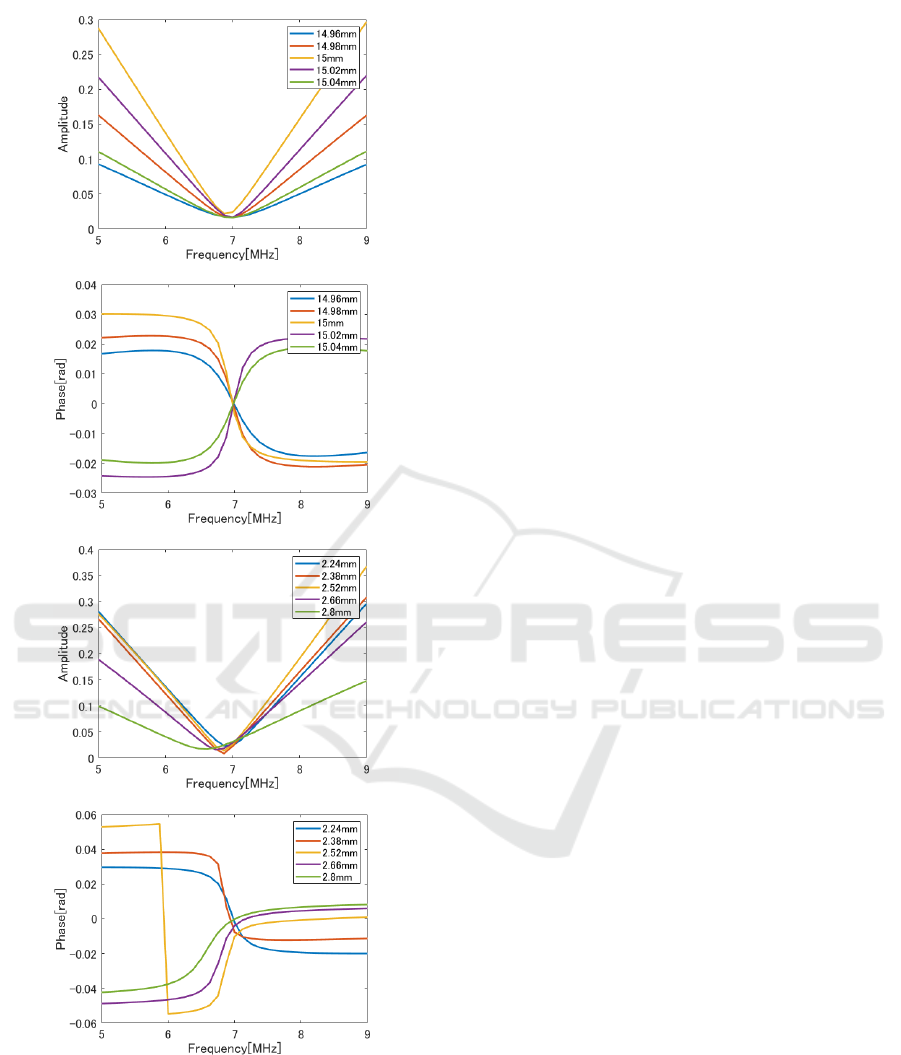
(a)
(b)
(c)
(d)
Figure 9: Differences in frequency compounding weights
around the imaging target position: (a) axial weight magni-
tude; (b) axial weight phase; (c) lateral weight magnitude;
(d) lateral weight phase.
the resolution of the wavelength level of the carrier by
utilizing various frequencies for transmission and re-
ception. The FPWC-MVDR featured in this study is
also the result of applying the viewpoint of effective
use of multiple frequencies to receive beamforming.
From the evaluation results shown in this paper,
it was found that the frequency characteristics of the
weights used in the frequency compounding are par-
ticularly interesting. This result seems to indicate
that the addition of echoes with carrier frequencies far
from the center of the band is required to effectively
cancel the off-axis signal. In the future, we will an-
alyze the meaning and inevitability of the character-
istics of this weight through detailed simulations and
imaging experiments of various objects.
In the FPWC-MVDR, considering the reduction
of the calculation amount, the echo data is first re-
duced in the frequency direction, the data amount is
reduced, and then the plane wave transmission an-
gle is reduced to output. If importance is placed
on the optimality, it is desirable to calculate a two-
dimensional weight map of frequency and transmis-
sion angle and reduce the three-dimensional tensor
data at once. On the other hand, assuming a case
where a high frame rate image such as a cardiac echo
is required, a method capable of extracting the car-
rier phase more efficiently is desirable. In the fre-
quency compounding in this study, pulses of differ-
ent carrier waves were transmitted multiple times and
the corresponding echoes were used. However, the
FPWC-MVDR proposed in this study can also be ex-
ecuted by extracting and analyzing narrowband com-
ponents by signal processing from the echo for one
wideband transmission. We have already begun re-
search on this method. In addition, the realization of
adaptive beamforming by deep learning is effective
in reducing the amount of calculation, and there are
many reports (Luijten et al., 2019). This idea is also
applicable to our FPWC-MVDR. We plan to proceed
with further studies in terms of both computational
complexity and efficiency.
Research on improving image quality by reducing
speckles and noise is also being enthusiastically pur-
sued in the field of optics (Leo et al., 2014), (Shah-
doosti and Rahemi, 2019), (Jeon et al., 2018). In re-
cent years, many studies on super-resolution technol-
ogy based on deep learning have been conducted on
various images (Yang et al., 2019), (Ouyang et al.,
2018), (Huang et al., 2018). Based on the results
there, it is important to improve the image quality of
ultrasonic images from a wider perspective.
REFERENCES
Asl, B. M. and Mahloojifar, A. (2012). A low-complexity
adaptive beamformer for ultrasound imaging using
structured covariance matrix. IEEE Trans. UFFC,
59(4):660–667.
Characteristics of Minimum Variance Beamformer for Frequency and Plane-wave Compounding
429

Camacho, J., Parrilla, M., and Fritsch, C. (2009). Phase
coherence imaging. IEEE Trans. UFFC, 56:958–974.
Capon, J. (1969). High-resolution frequency-wavenumber
spectrum analysis. In Proc. IEEE, volume 57, pages
1408–1418.
Cui, S. and Liu, D. C. (2011). Noise reduction for ul-
trasonic elastography using transmit-side frequency
compounding: a preliminary study. IEEE Trans.
UFFC, 58(3):509–516.
Huang, H., Yang, J., Huang, H., Song, Y., and Gui, G.
(2018). Deep learning for super-resolution channel es-
timation and doa estimation based massive mimo sys-
tem. IEEE Trans. Vehicular Technology, 67(9):8549–
8560.
Jeon, W., Jeong, W., Son, K., and Yang, H. (2018). Speckle
noise reduction for digital holographic images using
multi-scale convolutional neural networks. Optics let-
ters, 43(17):4240–4243.
Kozai, R., Tagawa, N., Yoshizawa, M., and Irie, T.
(2020). Optimization of frequency and plane-wave
compounding by minimum variance beamforming. In
IEEE Int. Ultrasonics. Symp.
Leo, M., Piccolo, R., Distante, C., Memmolo, P., Paturzo,
M., and Ferraro, P. (2014). Multilevel bidimensional
empirical mode decomposition: a new speckle reduc-
tion method in digital holography. Optical Engineer-
ing, 53(11):112314–1–10.
Li, P. C. and Li, M. L. (2003). Adaptive imaging using
the generalized coherence factor. IEEE Trans. UFFC,
50:128–142.
Luijten, B., Cohen, R., de Bruijn, F. J., Schmeitz, H. A. W.,
Mischi, M., Eldar, Y. C., and van Israel, R. J. G.
(2019). Deep learning for fast adaptive beamform-
ing. In IEEE Int. Conf. Acoust. Speech and Signal
Process., pages 1333–1337.
Magnin, P. A., von Ramm, O. T., and Thurstone, F. L.
(1982). Frequency compounding for speckle contrast
reduction in phased array images. Ultrasonic imaging,
4(3):267–281.
Matrone, G., Savoia, S. A., Caliano, G., and Magenes, G.
(2015). The delay multiply and sum beamforming al-
gorithm in ultrasound b-mode medical imaging. IEEE
Trans. Med. Imag., 34(4):940–949.
Mehdizadeh, S., Austeng, A., Johansen, T. F., and Holm, S.
(2012). Eigenspace based minimum variance beam-
forming applied to ultrasound imaging of acoustically
hard tissues. IEEE Trans. Med. Imag., 31(10):1912–
1921.
Mesurolle, B., Bining, H. J., Khoury, M. E., Barhdadi, A.,
and Kao, E. (2006). Contribution of tissue harmonic
imaging and frequency compound imaging in inter-
ventional breast sonography. Journal of ultrasound in
medicine, 25(7):845–855.
Montaldo, G., Tanter, M., Bercoff, J., Benech, N., and
Fink, M. (2009). Coherent plane-wave compounding
for very high frame rate ultrasonography and transient
elastography. IEEE Trans. UFFC, 56(3):489–506.
Nguyen, C. H., Tagawa, N., Yoshizawa, M., and Irie, T.
(2020). Performance improvement of ultrasonic range
super-resolution based on phase rotation by dealing
with echo distortion. Proc. of Meeting on Acoust.
(POMA), 38:055009–1–13.
Nguyen, N. Q. and Prager, R. W. (2018). A spatial co-
herence approach to minimum variance beamforming
for plane-wave compounding. IEEE Trans. UFFC,
65(4):522–534.
Ouyang, W., Aristov, A., Lelek, M., Hao, X., and Zimmer,
C. (2018). Deep learning massively accelerates super-
resolution localization microscopy. Nature Biotech-
nology, 36:460–468.
Shahdoosti, H.-R. and Rahemi, Z. (2019). Edge-preserving
image denoising using a deep convolutional neural
network. Signal Processing, 159:20–32.
Synnevag, J. F., Austeng, A., and Holm, S. (2007). Adaptive
beamforming applied to medical ultrasound imaging.
IEEE Trans. UFFC, 54(8):1606–1613.
Tagawa, N. and Zhu, J. (2018). Super-resolution ultrasound
imaging based on the phase of the carrier wave with-
out deterioration by grating lobes. In Int. Conf. Pattern
Recog., pages 2791–2796.
Thomenius, K. E. (1996). Evolution of ultrasound beam-
formers. In IEEE Int. Ultrason. Symp., volume 2,
pages 1615–1622.
Vignom, F. and Burcher, M. R. (2008). Capon beamforming
in medical ultrasound imaging with focused beams.
IEEE Trans. UFFC, 55:619–628.
Yang, W., Zhang, X., Tian, Y., Wang, W., Xue, J.-H., and
Liao, Q. (2019). Deep learning for single image super-
resolution: A brief review. IEEE Trans. Multimedia,
21(12):3106–3121.
Zhu, J. and Tagawa, N. (2019a). High resolution ultrasonic
imaging based on frequency sweep in both of trans-
ducer element domain and imaging line domain. Jpn.
J. Appl. Phys., 58:SGGE03–1–7.
Zhu, J. and Tagawa, N. (2019b). Improvement of perfor-
mance degradation in synthetic aperture extension of
enhanced axial resolution ultrasound imaging based
on frequency sweep. Sensors, 19:2414–1–18.
VISAPP 2021 - 16th International Conference on Computer Vision Theory and Applications
430
