
Automatic Diagnosis of COPD in Lung CT Images based on Multi-View
DCNN
Yin Bao, Yasseen Al Makady and Sasan Mahmoodi
School of Electronics and Computer Science, University of Southampton, University Road, Southampton, U.K.
Keywords:
COPD, Deep Convolutional Neural Network, Multi-View, Classification.
Abstract:
Chronic obstructive pulmonary disease (COPD) has long been one of the leading causes of morbidity and
mortality worldwide. Numerous studies have shown that CT image analysis is an effective way to diagnose
patients with COPD. Automatic diagnosis of CT images using computer vision will shorten the time a patient
takes to confirm COPD. This enables patients to receive timely treatment. CT images are three-dimensional
data. The extraction of 3D texture features is the core of classification problem. However, the classification
accuracy of the current computer vision models is still not high when extracting these features. Therefore,
computer vision assisted diagnosis has not been widely used. In this paper, we proposed MV-DCNN, a multi-
view deep neural network based on 15 directions. The experimental results show that compared with the state-
of-art methods, this method significantly improves the accuracy of COPD classification, with an accuracy of
97.7%. The model proposed here can be used in the medical institutions for diagnosis of COPD.
1 INTRODUCTION
Chronic obstructive pulmonary disease (COPD) is
a disease in which changes in bronchial epithelial
cells cause inflammation of the lungs, resulting in de-
creased lung function (Lapperre et al., 2007). The
main clinical manifestation of this disease is contin-
uous irreversible airflow limitation or obstruction of
lung tissue due to functional small airway disease, at-
mospheric disease and destruction of lung tissue (em-
physema) (Han et al., 2010). Individuals with this dis-
ease frequently develop complications such as mus-
cular atrophy, cardiovascular disease, osteopenia and
chronic infections. COPD has long been one of the
leading causes of morbidity and mortality worldwide
(Mannino and Buist, 2007). COPD will also be one
of the leading causes of death in humans in the future.
Currently, there are two mainstream diagnostic meth-
ods used to diagnose COPD. The first one is the Pul-
monary Function Test (PFT) whereas the other is by
Computed Tomography (CT) medical image. The
PFT includes spirometry, maximal respiratory pres-
sures and diffusing capacity. However, a major prob-
lem with PFT is that it is not sensitive to the early
diagnosis of COPD (Dirksen et al., 1998). CT is an
alternative to PFT and has proven to be more infor-
mative than PFT (Dharmagunawardhana et al., 2014).
So far, the dominant diagnostic approach has been
for professional physicians to analyze the specific
manifestations of emphysema by looking at high-
resolution CT images. However, not all patients have
the opportunity to be examined by a professional doc-
tor due to the cost of medical treatment. Therefore,
automatic analysis by computer may greatly improve
the accuracy of diagnosis, reduce the threshold of pa-
tient detection and decrease the workload for profes-
sional physicians.
Computer vision approaches have significant im-
provements in many fields including medical image
analysis. At present, most of the methods used for
medical diagnosis are in the form of two-dimensional
(2D) image analysis. However, extracting features
from 2D images could lead to a low accuracy of com-
puter diagnosis, because 2D images do not contain the
spatial structure characteristics of the object (depth in-
formation) (Almakady et al., 2018; Almakady et al.,
2020a). In order to improve the accuracy of medical
diagnosis by computer, it is not enough to use the fea-
ture extraction technology of 2D images only. There-
fore, the successful extraction of texture features from
3D data may contribute in the performance improve-
ment of computerized medical diagnosis.
In this paper, we propose a method that extracts
the features of 3D medical image data for COPD de-
tection. Meanwhile, this method is also used to real-
ize the automatic diagnosis of COPD with high accu-
racy.
Bao, Y., Al Makady, Y. and Mahmoodi, S.
Automatic Diagnosis of COPD in Lung CT Images based on Multi-View DCNN.
DOI: 10.5220/0010296805710578
In Proceedings of the 10th International Conference on Pattern Recognition Applications and Methods (ICPRAM 2021), pages 571-578
ISBN: 978-989-758-486-2
Copyright
c
2021 by SCITEPRESS – Science and Technology Publications, Lda. All rights reserved
571

2 RELATED WORK
There are currently two methods to classify 3D data:
one method is to directly use 3D volume data based
on a 3D Convolutional Neural Network (3DCNN) to
carry out the problem. Another is to use multi-view
2D images to classify on a 2D convolutional neural
network.
2.1 3D CNN
Alakwaa et al. (Alakwaa et al., 2017) proposed the
method of using 3DCNN to classify 3D data. They
detected data points of interest based on the U-Net
model (Ronneberger et al., 2015) and used for classi-
fication. Similarly, Zhu et al. (Zhu et al., 2018) pro-
posed a deep three-dimensional Dual-Path network
(DPN). This method divided the classification net-
work into two parts; the pathological feature detection
and classification and used the 3D Fast R-CNN and
U-Net to perform the classification. Dey et al. (Dey
et al., 2018) proposed 3D Multi-Output DenseNet
(MoDenseNet) that used two 3D images with differ-
ent input scales to cover local and global images of
pulmonary nodules. However, a major problem with
3D CNN is high computation cost. Compared with
2D CNN, it requires to calculate one more dimen-
sion, which leads to convolutions with high computa-
tional costs. Shen et al. (Shen et al., 2017) proposed a
new Multi-Crop Convolutional Neural Network (MC-
CNN) with a new pooling method to replace the tradi-
tional maximum pooling layer. Their aim is to extract
multi-scale features from the feature map extracted
from the convolution layer. This method relatively
decreases the required time for computation to obtain
the multi-scale features. However, the biggest disad-
vantage of using 3DCNN is that it requires a huge
amount of computation, which stretches the compu-
tational power of computers to its limits. This short-
coming directly leads to the research results which
may not be useful in the medical field. Secondly,
the disadvantage of 3DCNN is that not all parts of
3D data have contributing features. This results in a
waste of computing resources if a full convolution op-
eration is deployed. Therefore, employing the Multi-
View 2D approach may greatly decrease the computa-
tional burden without compromising the classification
performance.
2.2 Multi-View 2D
Hatt et al. (Hatt et al., 2018) intercepted 8 slices of the
same size from the 3D volume data along the spin-
dle direction of the high-resolution CT image. The
eight slices were combined into one montage image.
Finally, it is used as the input of a five-layer convolu-
tional neural network. They demonstrate that combin-
ing multiple slices of 3D data into a single and com-
pact shape descriptor has higher recognition perfor-
mance than a single image recognition architecture.
However, using only eight multi-angle images may
not capture all the features of a 3D medical image.
This may be one of the reasons for the low classifi-
cation accuracy. Similarly, Liu and Kang (Liu and
Kang, 2017) proposed a Multi-View Convolutional
Neural Network (MV-CNN). The whole lung CT im-
ages were cropped into multi-view and multi-scale
images. These images are stacked together into the
neural network. However, this method only consid-
ered the scale invariance of the multi-perspective im-
ages, and ignored the effect of rotation and translation
on the results. Gomez-Donoso et al. (Gomez-Donoso
et al., 2017) presented the LochaNet method, which
loads 3D volume data and calculates the center point
of each axis. Then the slices with model size of 5%
were obtained on the XY, XZ and YZ planes respec-
tively. They are projected onto a plane, producing a
500 × 500 pixel image.
However, the main disadvantage of these methods
is that they could not effectively extract the features
of 3D volume data. The possible reasons may be that
the number of network layers is too small or the main
features of 3D volume data cannot be well represented
by the intercepted images.
In this paper, we proposed a 15-direction multi-
view deep convolutional neural network model for the
diagnosis and classification of COPD patients. We
first divide the 3D data of each lung into 15 views,
which is shown in Figure 1. Then the 15 views are
input into the multi-input anti-aliased ResNet18 pre-
Trained model (He et al., 2016). Finally, back propa-
gation is used to reduce the classification error so as to
achieve more accurate classification. Different from
the previous network, the multi-view we extracted is
more comprehensive. In addition, we train the neu-
ral network by adding rotation, translation and multi-
scale data enhancement methods.
3 METHOD
The multi-View DCNN algorithm is mainly com-
posed of three steps: The first step is to extract images
from 15 perspectives from three-dimensional data.
The second step is to enhance the data of these 15
views respectively. The final step is to construct 15
Multi-View DCNN (MV-DCNN) models to extract
and classify the features.
ICPRAM 2021 - 10th International Conference on Pattern Recognition Applications and Methods
572
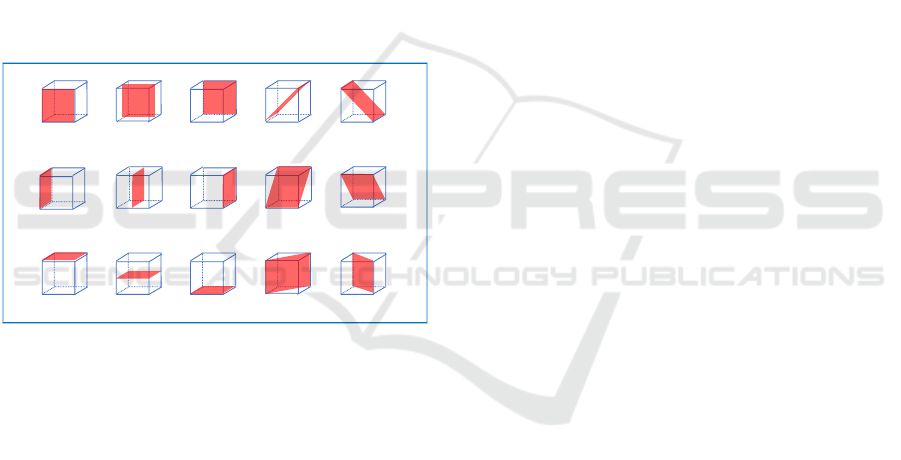
3.1 Multi-View Image Extraction
First of all, the experimental data are clipped into
cubes of 64 × 64 × 64 size. The reason the size of
the data is processed to 64 × 64 × 64 is not only that
the characteristic information can be retained in large
quantities, but also that the computing power of the
computer is not burdened. Although the larger the
size of the data, the more features it posses. The large
amount of data may cause the computer to run out
of memory or compute slowly. Next, we extract 15
slices from the 3D experimental data. The location of
multi-view image extraction can be seen in the Figure
1. The blue cube represents the cube data with the size
of 64 ×64 ×64. The red part indicates the location of
the 2D slice extracted from the 3D data. This process
provides us 15 slices (View 1-15) in each cube. The
purpose of this is to enrich the depth characteristic in-
formation of the direction, so as to make the extracted
3D data features more comprehensive.
View1
View6
View11
View2 View3 View4 View5
View7 View8 View9 View10
View12 View13 View14 View15
Figure 1: Principle diagram of multi-view image extraction.
3.2 Data Augmentation
One of the reasons computer vision has not been
widely adopted in the medical field is the small num-
ber of data sets used for training. Due to the small
size of the datasets, a neural network model usually
suffers from the problem of overfitting. The result of
overfitting problem is that the training set may have
high accuracy. However, the accuracy of the test set
is much lower than that of the training set. This is be-
cause small data sets are insufficient to describe the
true distribution of the problem. Therefore, we solve
the overfitting problem by adding data augmentation.
Each data is enhanced by means of subsampling, ro-
tation, translation, Gaussian blur, and noise addition.
The data augmentation is performed 50 times in
each training. The volume of data has been expanded
200 times. The advantage of this is that it not only
increases the amount of data, but also improves the
robustness of the data in terms of translation, blur, and
noise.
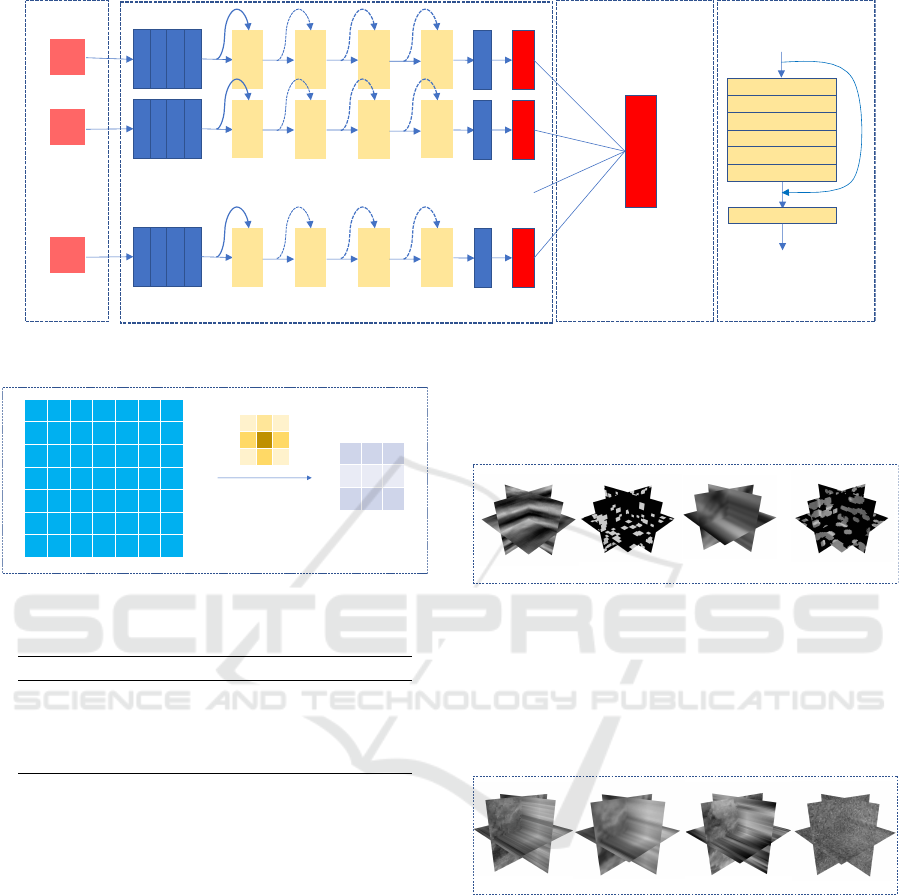
3.3 MV-DCNN Model
The whole feature extraction network is based on
the Anti-aliased ResNet18 (Zhang, 2019). We adopt
15 Anti-aliased ResNet18 models and the Classifica-
tion layer to construct the MV-DCNN. The specific
network structure diagram is shown in the Figure 2.
Their network structure and principles are explained
in details in the following sections.
3.3.1 Anti-aliased ResNet18
Anti-aliased ResNet 18 is a shift-invariant network
structure, which is a combination of the ResNet 18
network architecture and BlurPool. Its structure can
be seen in Figures 2 (c) and (d). The anti-aliasing
CNN model can enhance the robustness of the net-
work to image translation and improve the classifica-
tion accuracy. The details of principle of ResNet18
(He et al., 2016) and BlurPool are described in the
following sections.
3.3.2 BlurPool
Antialiasing CNN model is an improvement of
ResNet model. Because ResNet is sensitive to shift.
Thus, BlurPool (Zhang, 2019) is used instead of Max-
pool to reduce aliasing effects. The principle is shown
in the Figure 3. Different from the traditional pooling
layer, the BlurPool layer uses Gaussian kernel to con-
volve with the image. Since the size of stride is set
to 2, the size after the convolution is the same as that
of the traditional pooling layer. However, the differ-
ence is that the use of Gaussian convolution kernel
can reduce the effects of aliasing, so as to reduce the
impact of image shift on the output. Not only does
Anti-aliased ResNet 18 replace the pooling layer, it
also adds the BlurPool layer to the residual block.
3.3.3 Classification Layer
Each anti-aliased ResNet18 model has two outputs;
healthy and COPD. We add a classification layer after
the output of the 15 models. This classification layer
consists of a full connection layer. The input is 30
channels and the ouput is 2 channels. The role of the
classification layer is to vote on 15 models to get the
optimal classification result.
Automatic Diagnosis of COPD in Lung CT Images based on Multi-View DCNN
573
View1
Conv3×3
BN
ReLU
BlurPo ol
Conv3×3
BN
(d) BasicBlock(a) Input (b) Anti-aliased ResNet18
ReLU
View2
…
View15
Conv3×3
BN
ReLU
BlurPo ol
BasicBlock1
_×2
BasicBlock2
_×2
BasicBlock3
_×2
BasicBlock4
_×2
Av g pool
fc_num of
class
Conv3×3
BN
ReLU
BlurPo ol
BasicBlock1
_×2
BasicBlock2
_×2
BasicBlock3
_×2
BasicBlock4
_×2
Av g pool
fc_num of
class
Conv3×3
BN
ReLU
BlurPo ol
BasicBlock1
_×2
BasicBlock2
_×2
BasicBlock3
_×2
BasicBlock4
_×2
Av g pool
fc_num of
class
fc_num of class
…
(c) Classification
Figure 2: The network structure of MV-DCNN.
1 2 1
2 4 2
1 2 1
Conv2d
kernel
Figure 3: The principe of BlurPool.
Table 1: The number of the classes.
Name of Category Number
Fourier 15
Geometric 25
Interpolated 30
Mixed texture 25
4 METHOD EVALUATION
4.1 Dataset
The performance of this model is evaluated on the
RFAI dataset. The database of RFAI is one of the
synthetic texture datasets that can be used to evaluate
the effectiveness of 3D texture feature classification
methods (Paulhac et al., 2009). The 3D volume data
of this database is composed of 64 2D images.
The database has a total of four ways to generate
textures. The first method is to use Fourier transform
method to synthesize volume texture from a 2D tex-
ture, as shown in Figure 4 (a). The second method is
to synthesize the volume texture using the 3D geom-
etry, as shown in Figure 4 (b). The third method is to
interpolate two or more texture images to synthesize
volume texture, as shown in Figure 4 (c). The final
method is to combine the first three methods to syn-
thesize the volume texture, as shown in Figure 4 (d).
The number of classes contained in each category is
shown in Table 1.
(a) Fourier (b) Geometric
(d) Mixed texture(c) Interpolated
Figure 4: Examples from four categorizes.
According to the different types of distortion, each
class is divided into 4 categories: normal texture (a),
Gaussian fuzzy texture (b), subsampled texture (c),
and Gaussian noise texture (d) (e.g, see Figure 5).
Each of the four texture types contains 10 volumet-
ric images of 64 × 64 ×64 size.
(a) Normal (b) Smooth (c) Subsampling (d) Noise
Figure 5: Example of volumetric textures synthesized by
four methods. These four samples are from the texture of
the stone in the interpolation class.
4.2 Implementation
The models of this experiment are all written with the
open source Pytorch environment. All models in this
experiment are run on a Google Colab cloud server
with NVIDIA Tesla 100 and 25 GB of RAM.
The batch size of all models is 64. The filter size
of Blurpool is set to 3. The initial learning rate is
0.001, and the learning rate decay is carried out once
every ten times of training, with the decay rate of 0.5.
The lower limit of attenuation rate is 0.00001. In the
training, we use Adam optimization algorithm to op-
ICPRAM 2021 - 10th International Conference on Pattern Recognition Applications and Methods
574

timize each model, and its parameters are default val-
ues. The loss function of the model adopts cross en-
tropy. The pre-training model was used for training.
Consequently, during the training we freeze the first
seven layers of the model. All experiments in this pa-
per have been carried out for 10 times. All parameter
settings are shown in the Table 2.
Our proposed MV-DCNN model is tested on four
types of RFAI datasets respectively. The parameters
of each dataset are fine-tuned and the performance of
the model is evaluated by its accuracy. The accuracy
shows the classification performance of the model in
each category. The ratio of training set and test set in
this data set is 1:1. Parameter settings for each type
of dataset are described below.
The data for each type of dataset is cropped by the
center into 32 × 32 images, because rotation causes
edge distortion. Each data is performed 50 times for
data enhancement, all of which are added to the train-
ing set.
Interpolation: In this data set, we perform 5 ways
of data enhancement in the training set. The first
is random translation. The horizontal and vertical
translation ranges are (-0.1*image width, 0.1*image
width). The second is to add random Gaussian noise
to the whole picture. The third is random Gaussian
blur, whose standard deviation varies in a range of
(0.8,1). The fourth and fifth are two sets of random
rotations. The rotation ranges are (-120, 120) and (-
90, 90), respectively. The final classification number
is set to 30.
Fourier: In this data set, we perform data enhance-
ment for the training set in six ways. Random rotation
is added in the first and the second, and the rotation
angle ranges are (-120, 120) and (-90, 90), respec-
tively. The third is random subsampling. The remain-
ing three are random translation, random Gaussian
blur, and random Gaussian noise. They have the same
parameter setting as the Interpolation. The number of
categories is set to 15.
Geometric: In this data set, we add 5 ways of data
enhancement to the training set. In the first and the
second type respectively add the random rotation.
The rotation angle range is (-45, 45) and (-90, 90).
The remaining three data augmentation are random
translation, random Gaussian blur, and random Gaus-
sian noise. They have the same parameter setting as
the Interpolation. The final classification number is
set to 25.
Mixed Texture: All parameter settings are the same
as in Geometric.
5 RESULT AND DISCUSSION
We evaluate all four categories of the datasets and
compare them with the state of the art methods. In
addition, this experiment considers all subsets of each
category, including normal subset, rotation subset,
noise subset, smoothing subset and subsampling sub-
set. We take the normal subset of each category as the
training set and test the remaining subset of the cor-
responding data set. The results are shown in Table
3. The accuracy of correct classification of the data
in the table indicates that the MV-DCNN model is su-
perior to the other two methods in terms of robust-
ness to these three kinds of disturbances. Geometric
regularity in this class was somewhat lower than in
GMRF
3Dri
42,1
methods. However, under the interference
of Gaussian blur and subsampling, the performance
of MV-DCNN model is significantly better than the
other two methods. The proposed method has good
adaptability to each kind of data set.
6 APPLICATION TO COPD
DETECTION
In this experiment, the method proposed here is em-
ployed for COPD detection. The COPD dataset in this
paper is derived from 32 subjects. Thirteen subjects
are diagnosed with COPD, and the remaining 19 sub-
jects are healthy. The size of the HRCT volume image
is 512 × 512 × 512. Each sample is associated with a
mask image of the entire lung to keep only the lung
and discard the surrounding tissues. The CT data used
in this work are acquired as a part of a study into the
application of imaging to the characterization of the
phenotypes of COPD. The written informed consent
was given and signed by all subjects. The study was
approved by the Southampton and South West Hamp-
shire local research ethics committee (LREC number:
09/H0502/91) and the University Hospital Southamp-
ton Foundation Trust Research and Development De-
partment. The study was conducted in the Southamp-
ton NIHR Respiratory Biomedical Research Unit.
Because the amount of data is too small and the
individual data is too large. Each whole lung HRCT
image is divided into 16 volumes of 64 ×64 ×64 size
as shown in Figure 6 .
6.1 The Result of MV-DCNN on COPD
Dataset
After the pre-processing step is performed, we feed
the data into our proposed method. the ratio of train-
ing set and test set is randomly assigned to train and
Automatic Diagnosis of COPD in Lung CT Images based on Multi-View DCNN
575
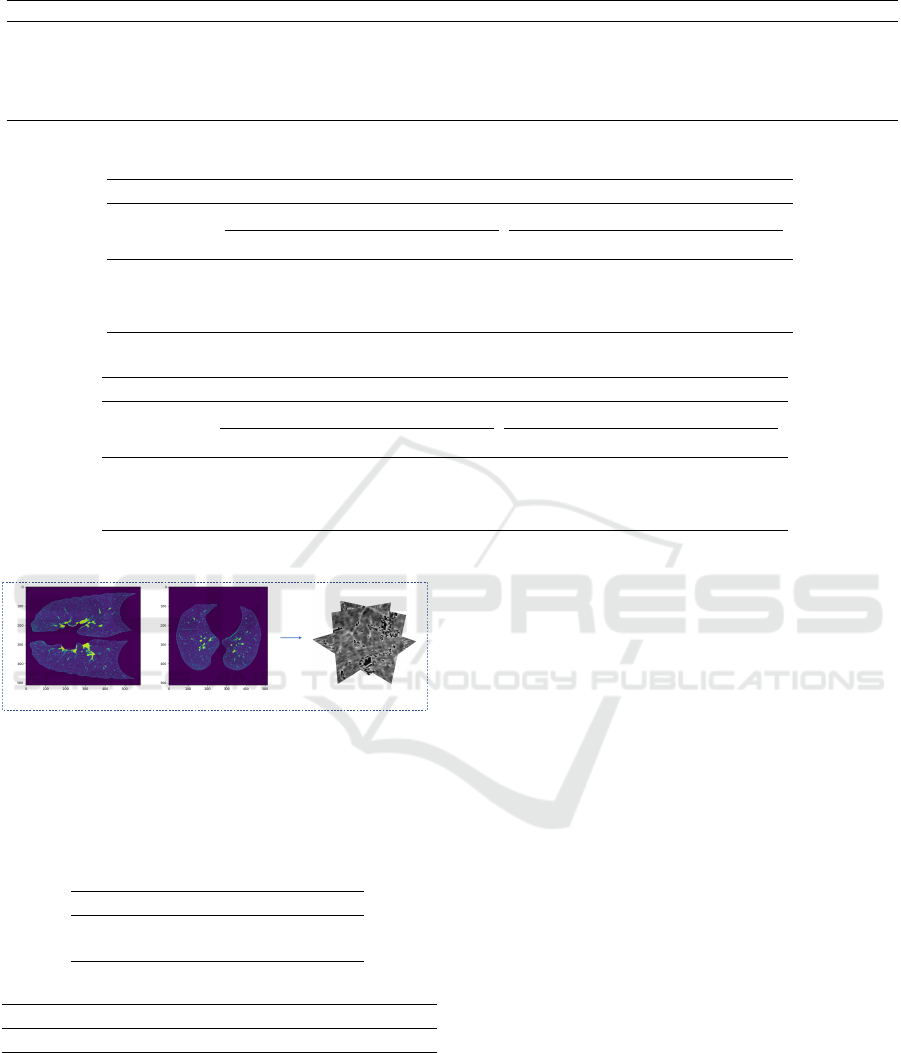
Table 2: Experimental data parameter setting.
Categories of Data Enhancement Random Rotation1 Random Rotation2 Random Gaussian Blur Random Translation
Fourier (-120, 120) (-90, 90) (0.8, 1.0) (0.1, 0.1)
Geometric (-45, 45) (-90, 90) (0.8, 1.0) (0.1, 0.1)
Interpolated (-120, 120) (-90, 90) (0.8, 1.0) (0.1, 0.1)
Mixed texture (-45, 45) (-90, 90) (0.8, 1.0) (0.1, 0.1)
COPD - - (0.95, 1.0) (0.01, 0.01)
Table 3: Classification accuracies [%] of our method and some other methods using RFAI datasets.
Synthetic texture dataset
Descriptor Fourier Geometric
Noise Smooth Subsampling Noise Smooth Subsampling
MV-DCNN 100 96.5 56.7 96.0 84.2 33.8
GMRF
3Dri
42,1
100 72.0 47.0 100 82.8 28.4
3DRiesz 100 87.0 45.0 96.0 42.0 21.0
(a) Result of Fourier and Geometric.
Synthetic texture dataset
Descriptor Interpolated Mixed texture
Noise Smooth Subsampling Noise Smooth Subsampling
MV-DCNN 94.8 99.5 61.8 100 96.4 32.2
GMRF
3Dri
42,1
93 78.59 49.16 99.6 92 26.8
3DRiesz - - - - - -
(b) Result of Interpolated and Mixed texture.
(a)
(b) (c)
Figure 6: Figure (a) shows the YZ plane of the lung. Figure
(b) shows the XY plane of the lung. Figure (c) shows a
sample of randomly segmented lung data.
Table 4: The data results in the table are one out of ten ran-
dom sample classification training sessions. The confound-
ing matrix, accuracy, specificity, and sensitivity of the test
results are recorded in the table.
Confusion Matrix True False
Positive 42 2
Negative 59 0
(a) Confusion Matrix.
Result (%) Accuracy Specificity Sensitivity
MV-DCNN 98.05 96.72 100
(b) Results.
test at a ratio of 8:2. The model is trained for 10
times, and the training set and test set are randomly
assigned at a ratio of 8:2. Then the average of the
accuracy is calculated. Three methods of data en-
hancement are added to the COPD dataset: random
translation (horizontal and vertical translation range
(-0.01*width, 0.01*width)), random Gaussian noise,
and random Gaussian blur. These three enhancements
are run 30 times per data. The number of categories
is set to 2, healthy and COPD. We compare the per-
formance of the MV-DCNN model with texture-based
methods deep learning-based methods.
The classification performance is reported as clas-
sification accuracy, sensitivity, and specificity.
The results of MV-DCNN tests on the COPD dataset
are shown in the Table 4. According to the re-
sults in Table 4 (b), the specificity of this model is
96.2%. This suggests that the model has the poten-
tial to diagnose healthy individuals as COPD. How-
ever, the probability of such an error is only 3.8%.
The sensitivity of the model to diagnosis COPD has
reached 100%. This means that the model can diag-
nose COPD accurately. Therefore, from the test re-
sults, our model can be used in the COPD detection
for medical institutions.
6.2 Comparison to Texture based
Methods
This section compares our approach with five meth-
ods based on texture feature extraction. They are re-
spectively GMRF
3Dri
42,1
(Almakady et al., 2020b) , the
local parameter histogram (LPH) (Dharmagunaward-
hana et al., 2016), 3D Gray Level Co-occurrence
ICPRAM 2021 - 10th International Conference on Pattern Recognition Applications and Methods
576

Table 5: Classification accuracies [%] of our method and some other methods using COPD datasets.
Method Classification accuracy [%]
A MV-DCNN 97.7
B GMRF
3Dri
42,1
90.25
C LPH 75.0
D LBP 78.12
E 3D GLCM 75
F Gabor filters 78.12
G SIFT 75
H Intensity features method 68.75
I Density-based method 71.88
Table 6: Comparison of our method with deep learning-
based methods on the COPD dataset.
Method Classification accuracy [%]
A MV-DCNN 97.7
B Voting CNN 88.2
C ResNet-50 87.5
D AlexNet 85.94
E VoxResNet 3D 74.3
Matrix (3DGLCM) (Han et al., 2015), Gabor filters
(Manjunath and Ma, 1996) and the SIFT (Xu et al.,
2012) method. The result of these methods are re-
ported in the literature. GMRF
3Dri
42,1
and SIFT are
both rotation and scale invariant descriptors for tex-
ture classification. For each slice, they detect a num-
ber of key points unrelated to rotation. Then the 128-
dimensional eigenvectors are constructed with these
key points and the classification task is performed.
GMRF
3Dri
42,1
has better rotation invariance from the
method B and method G in Table 5. However, method
A in Table 5 proposed here is significantly superior to
these five methods, with an accuracy rate of 97.7%.
This suggests that the manual extraction method may
still be missing some information. This results in
poor overall discriminative ability despite good per-
formance with some invariance properties. On the
contrary, our method has a robust discriminative abil-
ity and can well extract the pathological characteris-
tics of COPD.
6.3 Comparison with
Deep-Learning-based Methods
In this section, we compare our method with four
methods based on deep neural network. They are
ResNet 3D (He et al., 2016), AlexNet (Krizhevsky
et al., 2012), VoxResNet 3D (Zhu et al., 2018), and
Voting CNN (Du et al., 2020). All experimental re-
sults are shown in Table 6. The experimental results
show that our method has the highest accuracy and
is significantly higher than the second one. Meth-
ods C, D, and E in the Table 6 directly convolvs 3D
data. There are two possible reasons for their inac-
curacy. One is that such operations require the sac-
rifice of data size to satisfy the computing power of
the computer. As a result, the features carried by the
data is not enough, which makes it impossible to ex-
tract contributing features for classification. Another
reason is that they use less data and do not enhance
the data, which can lead to over-fitting of the model.
Method B in Table 6 also uses the method of multi-
view. However, it may be that the author only consid-
ers Air Tree and the perspective is not comprehensive
enough, leading to low accuracy. In conclusion, MV-
DCNN model has a high accuracy rate and is higher
than the current state-of-art methods. These results
suggest that our proposed method can assist physi-
cians in the medical diagnosis of COPD and can be
applied to the diagnosis of off-line medical institu-
tions.
7 CONCLUSIONS
This paper proposes the MV-DCNN model COPD di-
agnosis. In this paper, the concrete implementation
method of MV-DCNN is introduced in details. Fi-
nally, we introduce the whole experiment process and
performance of the model. Based on deep neural net-
work, MV-DCNN classifies 3D texture data by using
15 multi-view slices of 3D data. Then, the accuracy
of classification is successfully improved through var-
ious methods of data enhancement and transfer learn-
ing. The accuracy of our MV-DCNN is 97.7% for
the diagnosis of COPD, which has good classifica-
tion performance compared with the state of the art
method in this paper.
REFERENCES
Alakwaa, W., Nassef, M., and Badr, A. (2017). Lung can-
cer detection and classification with 3d convolutional
Automatic Diagnosis of COPD in Lung CT Images based on Multi-View DCNN
577

neural network (3d-cnn). Lung Cancer, 8(8):409.
Almakady, Y., Mahmoodi, S., and Bennett, M. (2020a).
Copd detection using three-dimensional gaussian
markov random fields based on binary features. In
2020 IEEE International Conference on Image Pro-
cessing (ICIP), pages 340–344. IEEE.
Almakady, Y., Mahmoodi, S., Conway, J., and Bennett,
M. (2018). Volumetric texture analysis based on
three-dimensional gaussian markov random fields for
copd detection. In Annual Conference on Medical
Image Understanding and Analysis, pages 153–164.
Springer.
Almakady, Y., Mahmoodi, S., Conway, J., and Bennett, M.
(2020b). Rotation invariant features based on three
dimensional gaussian markov random fields for vol-
umetric texture classification. Computer Vision and
Image Understanding, 194:102931.
Dey, R., Lu, Z., and Hong, Y. (2018). Diagnostic classifi-
cation of lung nodules using 3d neural networks. In
2018 IEEE 15th International Symposium on Biomed-
ical Imaging (ISBI 2018), pages 774–778. IEEE.
Dharmagunawardhana, C., Mahmoodi, S., Bennett, M., and
Niranjan, M. (2014). Quantitative analysis of pul-
monary emphysema using isotropic gaussian markov
random fields. In 2014 International Conference on
Computer Vision Theory and Applications (VISAPP),
volume 3, pages 44–53. IEEE.
Dharmagunawardhana, C., Mahmoodi, S., Bennett, M., and
Niranjan, M. (2016). Rotation invariant texture de-
scriptors based on gaussian markov random fields for
classification. Pattern Recognition Letters, 69:15–21.
Dirksen, A., Holstein-Rathlou, N.-H., Madsen, F., Skov-
gaard, L. T., Ulrik, C. S., Heckscher, T., and Kok-
Jensen, A. (1998). Long-range correlations of se-
rial fev1 measurements in emphysematous patients
and normal subjects. Journal of applied physiology,
85(1):259–265.
Du, R., Qi, S., Feng, J., Xia, S., Kang, Y., Qian, W., and
Yao, Y.-D. (2020). Identification of copd from multi-
view snapshots of 3d lung airway tree via deep cnn.
IEEE Access, 8:38907–38919.
Gomez-Donoso, F., Garcia-Garcia, A., Garcia-Rodriguez,
J., Orts-Escolano, S., and Cazorla, M. (2017). Lon-
chanet: A sliced-based cnn architecture for real-time
3d object recognition. In 2017 International Joint
Conference on Neural Networks (IJCNN), pages 412–
418. IEEE.
Han, F., Wang, H., Zhang, G., Han, H., Song, B., Li, L.,
Moore, W., Lu, H., Zhao, H., and Liang, Z. (2015).
Texture feature analysis for computer-aided diagnosis
on pulmonary nodules. Journal of digital imaging,
28(1):99–115.
Han, M. K., Agusti, A., Calverley, P. M., Celli, B. R.,
Criner, G., Curtis, J. L., Fabbri, L. M., Goldin, J. G.,
Jones, P. W., MacNee, W., et al. (2010). Chronic ob-
structive pulmonary disease phenotypes: the future of
copd. American journal of respiratory and critical
care medicine, 182(5):598–604.
Hatt, C., Galban, C., Labaki, W., Kazerooni, E., Lynch, D.,
and Han, M. (2018). Convolutional neural network
based copd and emphysema classifications are predic-
tive of lung cancer diagnosis. In Image Analysis for
Moving Organ, Breast, and Thoracic Images, pages
302–309. Springer.
He, K., Zhang, X., Ren, S., and Sun, J. (2016). Deep resid-
ual learning for image recognition. In Proceedings of
the IEEE conference on computer vision and pattern
recognition, pages 770–778.
Krizhevsky, A., Sutskever, I., and Hinton, G. E. (2012). Im-
agenet classification with deep convolutional neural
networks. In Advances in neural information process-
ing systems, pages 1097–1105.
Lapperre, T. S., Sont, J. K., van Schadewijk, A., Gos-
man, M. M., Postma, D. S., Bajema, I. M., Timens,
W., Mauad, T., Hiemstra, P. S., Group, G. S., et al.
(2007). Smoking cessation and bronchial epithelial
remodelling in copd: a cross-sectional study. Respira-
tory research, 8(1):85.
Liu, K. and Kang, G. (2017). Multiview convolutional neu-
ral networks for lung nodule classification. Interna-
tional Journal of Imaging Systems and Technology,
27(1):12–22.
Manjunath, B. S. and Ma, W.-Y. (1996). Texture features
for browsing and retrieval of image data. IEEE Trans-
actions on pattern analysis and machine intelligence,
18(8):837–842.
Mannino, D. M. and Buist, A. S. (2007). Global burden of
copd: risk factors, prevalence, and future trends. The
Lancet, 370(9589):765–773.
Paulhac, L., Makris, P., Ramel, J.-Y., et al. (2009). A solid
texture database for segmentation and classification
experiments. In VISAPP (2), pages 135–141.
Ronneberger, O., Fischer, P., and Brox, T. (2015). U-net:
Convolutional networks for biomedical image seg-
mentation. In International Conference on Medical
image computing and computer-assisted intervention,
pages 234–241. Springer.
Shen, W., Zhou, M., Yang, F., Yu, D., Dong, D., Yang,
C., Zang, Y., and Tian, J. (2017). Multi-crop convo-
lutional neural networks for lung nodule malignancy
suspiciousness classification. Pattern Recognition,
61:663–673.
Xu, Y., Huang, S., Ji, H., and Ferm
¨
uLler, C. (2012). Scale-
space texture description on sift-like textons. Com-
puter Vision and Image Understanding, 116(9):999–
1013.
Zhang, R. (2019). Making convolutional networks shift-
invariant again. In ICML.
Zhu, W., Liu, C., Fan, W., and Xie, X. (2018). Deeplung:
Deep 3d dual path nets for automated pulmonary nod-
ule detection and classification. In 2018 IEEE Win-
ter Conference on Applications of Computer Vision
(WACV), pages 673–681. IEEE.
ICPRAM 2021 - 10th International Conference on Pattern Recognition Applications and Methods
578
